Standard Chartered analysts Bader Al Sarraf and Razia Khan examine how the Middle East escalation could affect Gulf Cooperation Council (GCC) economies. They focus on risks linked to the Strait of Hormuz and wider Gulf energy infrastructure.
The assessment looks at three transmission channels: fiscal outcomes, non-oil growth, and sovereign buffers. It expects the overall economic impact to be contained, but uneven across GCC states.
Exposure And Export Flexibility
Differences are linked to exposure to export disruption, the ability to bypass the Strait of Hormuz, and the structure of non-oil sectors. Economies with more export flexibility and alternative routes are expected to absorb disruption more easily.
GCC public finances start from a relatively strong position, supported by large sovereign balance sheets in many countries. Sovereign wealth assets and foreign exchange reserves exceed USD 6.5tn, providing a buffer against domestic and external shocks.
Saudi Arabia, the UAE and Oman are identified as having greater export flexibility and bypass options. Countries that rely more on the strait and have constrained trade routes are expected to face a larger impact.
With Middle East tensions now entering their fourth week, we are seeing significant price action directly linked to risks around the Strait of Hormuz. Brent crude has surged over 25% in the last month, touching $112 per barrel as markets price in potential supply disruptions. This level of uncertainty suggests traders should consider long volatility strategies through options on major oil benchmarks.
Volatility And Relative Value Trades
Implied volatility in the crude markets has reached its highest point since the energy market dislocations of early 2024, indicating that options are pricing in larger-than-usual price swings. Rather than simply betting on direction, purchasing straddles or strangles could prove effective, profiting from a large price move whether it goes up or down. These strategies are a direct play on the ongoing geopolitical instability.
We also see a clear divergence opening up between Gulf economies, which creates opportunities for pairs trading. Saudi Arabia’s ability to bypass the strait via its East-West pipeline makes its market more resilient compared to others more reliant on the waterway. This is reflected in recent performance, with the Saudi Tadawul index down only 4% this month while Dubai’s market has fallen over 9%.
A potential trade based on this is to go long Saudi equity index futures while simultaneously shorting futures on a more exposed market. This strategy isolates the specific Hormuz risk, hedging against a general market downturn while profiting from the relative outperformance of the more resilient economy. The massive sovereign wealth buffers exceeding $6.5 trillion should, however, prevent a systemic collapse, putting a theoretical floor on market downside.
This situation contrasts sharply with the relative calm we saw through most of 2025, where oil traded in a predictable range. The current environment demands a focus on assets with clear exposure to the conflict’s divergent outcomes. We believe using defined-risk option spreads is prudent, as it allows for capitalizing on the heightened volatility while capping potential losses if tensions were to suddenly de-escalate.
Create your live VT Markets account and start trading now.
Start trading now – Click here to create your real VT Markets account
US shares fell on Thursday, with the Dow down about 230 points (0.5%), the S&P 500 down 0.8%, and the Nasdaq Composite down 1.1%. Dow futures moved from about 46,200 to roughly 46,800 before slipping back towards early-session levels.
Overnight, Asian markets dropped after Iran rejected a US 15-point ceasefire proposal and floated a counterproposal tied to halting strikes and control of the Strait of Hormuz. South Korea’s Kospi fell more than 3%, while China’s Shanghai index and Hong Kong’s Hang Seng each fell about 1%.
Global Markets React To Rising Tensions
European markets also weakened, with the Stoxx 600 about 0.8% lower as Brent crude rose above $106. Later, reports included a five-day US pause on strikes nearing expiry in 48 hours and the reported killing of the IRGC Navy commander.
Gulf states issued a joint statement condemning Iran-linked strikes from Iraqi territory, and two people were killed in Abu Dhabi after debris fell from an intercepted ballistic missile. Brent rose about 5% to above $107 and WTI rose more than 4% to near $95, while the 10-year yield neared 4.4% and 20- and 30-year yields approached 5%.
Tech shares fell after Google Research detailed TurboQuant, said to cut memory needs by up to six times with zero accuracy loss; Samsung fell 5% and SK Hynix 6%, while Lam Research and Applied Materials fell about 4%. Initial jobless claims rose to 210K from 205K, continuing claims fell 32K to 1.82 million, and the Fed held rates at 3.50%–3.75% with one 2026 cut projected; CME FedWatch shows an 89% chance of no change through June.
With President Donald Trump’s deadline approaching, we are treating the risk of escalating conflict with Iran as the market’s primary driver. We are buying protection against a sharp downturn, as the CBOE Volatility Index (VIX) is likely underpricing the risk of a full-blown conflict in the Strait of Hormuz. Historical precedent from past Mideast crises, such as the 1990 Gulf War buildup which saw the VIX more than double, suggests volatility could spike aggressively from here.
The surge in Brent crude to over $107 a barrel is a direct result of the blockade, but the real risk is a complete supply interruption. The U.S. Energy Information Administration has consistently reported that the Strait of Hormuz handles over 20% of global oil transit, so a prolonged closure could send prices significantly higher. We are therefore holding long positions through call options on WTI and Brent futures to capitalize on this upside risk.
Portfolio Hedging And Rates Pressure
This combination of geopolitical tension and higher oil prices creates a clear headwind for broad equity indices. We are hedging our long-term portfolios by buying put options on the S&P 500 and shorting Dow Jones futures. This defensive stance is necessary until we see a credible diplomatic resolution, as sustained high energy costs will eat into corporate profits and consumer spending.
In the technology sector, the sell-off in memory chip makers like Micron and Samsung is a structural shift, not just a temporary reaction. We see Alphabet’s AI memory breakthrough as a genuine threat to long-term demand, and we are initiating short positions on key semiconductor ETFs. This sets up a classic pairs trade, allowing us to go long on the innovator, Alphabet, while betting against the companies being disrupted.
Finally, we cannot ignore the Federal Reserve’s hawkish stance, which provides a challenging backdrop for the market. With jobless claims remaining low at 210,000 and the CME FedWatch tool showing an 89% probability of rates holding steady through June, there is no monetary policy cushion for stocks. The spike in the 10-year Treasury yield toward 4.4% reinforces the pressure on equities, especially long-duration growth names.
Create your live VT Markets account and start trading now.
Start trading now – Click here to create your real VT Markets account
The United States held a 7-year note auction where the yield rose to 4.255%. The previous auction yield was 3.79%.
This change shows borrowing costs for this maturity moved higher compared with the prior sale. The figures reported were 4.255% and 3.79%.
Market Inflation And Debt Supply Concerns
This poor 7-year auction, with yields jumping to 4.255%, points to serious market concerns about inflation and future government debt supply. We see this as a signal that the market is demanding higher compensation for holding longer-term U.S. debt. This is not happening in a vacuum, as the most recent Nonfarm Payrolls data showed unexpected strength, adding over 250,000 jobs and fueling fears the Federal Reserve will stay hawkish.
We are adjusting by increasing short positions in Treasury futures, as higher yields mean lower bond prices. We recall the sharp bond market sell-off in the fall of 2025, which began with similar signs of weak auction demand. Consequently, positioning for a further rise in interest rate volatility by purchasing options on the MOVE Index seems prudent.
For equity derivatives, this environment is negative for growth stocks that are sensitive to interest rates. We are buying put options on the Nasdaq 100 ETF to hedge against a potential downturn in the tech sector. This strategy is based on the historical correlation we observed in 2025, where a 50-basis-point rise in the 10-year yield corresponded with a roughly 5-7% drop in the Nasdaq.
Dollar Strength And Forex Positioning
Higher U.S. interest rates also tend to strengthen the dollar as foreign capital seeks better returns. We anticipate the U.S. Dollar Index (DXY), currently trading around 105.50, to test its recent highs. Therefore, we are adding to long U.S. dollar positions against currencies with more dovish central banks, like the Euro and the Yen.
Create your live VT Markets account and start trading now.
Start trading now – Click here to create your real VT Markets account
USD/CHF rose on Thursday as the US Dollar strengthened amid rising Middle East tensions. The Swiss Franc lagged, with traders wary of possible Swiss National Bank action to limit currency gains.
The pair was trading near 0.7941 at the time of writing, up for a third day. It rebounded from the 2 March low around 0.7674 and broke above resistance near 0.7800.
Technical Levels And Moving Averages
That 0.7800 area sits close to the 50-day Simple Moving Average at 0.7794. USD/CHF also moved above the 100-day SMA at 0.7890 and is now testing the 200-day SMA at 0.7946.
A sustained move above 0.7946 could push the pair towards 0.8000, then 0.8050. The Relative Strength Index is 62, above the midline.
The MACD line remains above the signal line in positive territory, with a modest histogram. Support is seen at the 100-day SMA and then the 0.7800 breakout zone.
Around this time in 2025, we saw the USD/CHF pair building a bullish case as it tested its 200-day moving average near 0.7946. The move was driven by a strong US Dollar and concerns that the Swiss National Bank (SNB) would intervene to weaken the franc. That breakout proved to be a critical turning point for the pair’s direction over the last year.
Fast forward to today, March 26, 2026, and the fundamental picture has become even clearer, solidifying that uptrend. The SNB has followed through on its dovish stance, having cut its key interest rate to 1.25%, with Swiss inflation now sitting at a low 1.3%. Meanwhile, the US Federal Reserve remains on hold as recent data showed American inflation is proving sticky at 3.2%, keeping the policy divergence between the two central banks wide.
Options Strategies For Derivative Traders
This interest rate difference makes holding US Dollars more profitable than Swiss Francs, fueling steady demand for the pair. The continued geopolitical uncertainty in the Red Sea has also primarily benefited the US Dollar as the preferred safe-haven asset over the Franc. The market’s focus has clearly shifted from fearing SNB intervention to actively trading the reality of its dovish policy.
Given the pair is now trading substantially higher, around 0.9180, the bullish momentum we saw starting last year is still intact. The 0.8000 level, a mere target in March 2025, is now a distant long-term support level. The current trend suggests that any dips are likely buying opportunities rather than reversals.
For derivative traders, this environment favors strategies that capitalize on continued, albeit potentially slower, upside. Buying call options with strike prices at 0.9250 or 0.9300 for May 2026 expiry allows for participation in further gains while strictly defining risk. This is a direct play on the persistent strength of the US economic and interest rate position over Switzerland’s.
Alternatively, for those looking to hedge or position for a short-term pullback, buying put options below a key technical level like the 50-day moving average at 0.9110 could be prudent. A surprise shift in Fed guidance or a sudden de-escalation of global tensions could trigger a sharp correction. This strategy provides a protective floor against the long-standing rally showing signs of fatigue.
Create your live VT Markets account and start trading now.
Start trading now – Click here to create your real VT Markets account
Silver (XAG/USD) traded lower on Thursday, near $68.50 at the time of writing. It was down 3.85% on the day, extending a pullback after earlier gains this week.
The move followed renewed demand for the US Dollar amid geopolitical tensions in the Middle East. Iran rejected a US-proposed ceasefire deal, while continued military exchanges kept risk aversion elevated.
Dollar Strength Pressures Silver
US Dollar strength put pressure on USD-priced precious metals. At the same time, rising Oil prices lifted global inflation concerns and supported expectations of higher interest rates for longer.
Markets also priced in a prolonged restrictive stance from major central banks, particularly the Federal Reserve. This shift pushed US Treasury yields higher, reducing the appeal of Silver as a non-yielding asset.
Some flows moved towards cash as volatility increased and positions were reduced. Silver struggled to gain support from safe-haven demand because the stronger Dollar and higher yields dominated.
Traders continued to watch Middle East developments alongside inflation and monetary policy expectations. These factors were expected to remain key drivers for Silver in the near term.
Options And Positioning Considerations
We recall how around this time in early 2025, silver was struggling under the weight of a powerful US Dollar and rising yields, even with geopolitical tensions flaring. That period taught us that the greenback and interest rate expectations can easily overpower silver’s traditional safe-haven appeal. Today, with silver trading around $31.50, those same forces are still the primary drivers to watch.
The key headwind remains US Treasury yields, with the 10-year note stubbornly hovering around 4.3% after the February 2026 inflation data came in slightly above expectations. This makes holding non-yielding silver costly, which suggests traders should be cautious about buying long-dated, out-of-the-money call options. Instead, consider strategies like call debit spreads to define risk and lower the initial cash outlay.
Implied volatility in silver options has been elevated, reflecting uncertainty about when the Federal Reserve will finally begin its rate-cutting cycle, which markets are now pricing for the third quarter of 2026. This higher volatility means option premiums are richer, making it an attractive environment for selling cash-secured puts or put credit spreads. This strategy allows traders to collect income while defining a price level below the current market where they would be comfortable owning silver.
The US Dollar Index (DXY) is holding firm above the 105 level, acting as a constant cap on any significant rally in precious metals. We saw this exact dynamic play out in 2025, where every attempt by silver to break out was smothered by dollar strength. Therefore, traders with long silver exposure via futures or ETFs should consider hedging their position with options on dollar-tracking funds.
Looking at recent market positioning, the latest Commitment of Traders report shows that hedge funds have trimmed their net-long exposure to silver futures for the third consecutive week. This indicates a waning conviction in silver’s immediate upside potential as the “higher for longer” narrative regains traction. This cautious institutional stance suggests that buying protective puts could be a prudent move to guard against a potential retest of the $30 support level in the coming weeks.
Create your live VT Markets account and start trading now.
Start trading now – Click here to create your real VT Markets account
USD/JPY traded higher near 159.70 on Thursday, 26 March, and kept an overall upward trend as the US Dollar stayed supported while the Japanese Yen remained under pressure.
US President Donald Trump said the recent rise in oil prices and the fall in the stock market during tensions with Iran were less severe than he expected. He also said any economic damage would be reversed.
Dollar Yen Trend Outlook
The US Dollar remained firm on Trump’s comments, safe-haven demand, and stable yields during ongoing geopolitical tensions. Markets also adjusted expectations for aggressive Federal Reserve easing.
On the 4-hour chart, USD/JPY traded at 159.64 and the near-term bias was neutral as it consolidated near recent highs. The pair stayed above the 20-period and 100-period Simple Moving Averages, while the RSI was around 60.
Support levels were noted at 159.44 and 159.28, with resistance at 159.70. A drop below 159.28 would shift focus towards the 20-period SMA.
The technical analysis section was produced with the help of an AI tool.
Options Strategy Considerations
Looking back to this time last year, we saw the dollar strengthen significantly against the yen. President Trump’s comments during the Iran tensions helped push USD/JPY toward the 160 level, a key psychological barrier. This reinforced a strong bullish trend that rewarded those positioned for a higher dollar.
Today, the underlying dynamic remains largely the same, with the pair now trading near 164.50. This continued strength is driven by the persistent interest rate differential between the US Federal Reserve and the Bank of Japan. Data from early 2026 shows the Bank of Japan has held its key short-term interest rate near zero, while U.S. rates remain comparatively high, attracting capital flows into the dollar.
Given this persistent upward momentum, buying call options on USD/JPY presents a clear strategy for the coming weeks. This allows traders to capitalize on a potential move towards the 166 level with a defined risk. We saw similar setups pay off during the sustained climb throughout 2025.
However, we should also be mindful of volatility, as implied volatility for the yen has historically spiked during policy hints from Tokyo. We remember the sharp, temporary swings in late 2025 when the Bank of Japan first signaled a policy review. Therefore, using options to structure trades that benefit from increased price movement, not just direction, could also prove wise.
For those already holding long positions from lower levels, buying put options with a strike price around 162.00 could serve as a valuable hedge. This approach would protect accumulated profits from a sudden downturn or a surprise policy shift. It effectively acts as an insurance policy against any unexpected resurgence in the yen.
Create your live VT Markets account and start trading now.
Start trading now – Click here to create your real VT Markets account
Norges Bank signalled a more hawkish stance, with inflation pressures seen as wider than the energy shock. Its projections now fully price at least one rate rise, while ING expects one move due to its bearish oil and gas baseline and a downward-sloping EUR/NOK view.
After the meeting, 1-year NOK swap rates rose by nearly 10bp, adding to a +43bp increase since the start of the war. The move suggests markets were surprised by the tone and the stronger guidance towards rate increases.
The bank pointed to broad-based inflation risks and other factors that could keep inflation in place. It also warned that not raising rates could weaken the krone and reduce the effect of lower imported inflation.
Market pricing implies 16bp of tightening for May and 33bp for June. With some members favouring a hike at the latest meeting, May appears more likely than later.
The NOK swap curve indicates 60bp of tightening over the next year, and two hikes are possible, though ING’s base case remains one. The policy rate is 4.0%, and Norges Bank projects inflation peaking at about 3.5%, with downside risks for front-end NOK swap rates.
With Norway’s core CPI for February 2026 unexpectedly hitting 3.2%, concerns about persistent inflation are re-emerging. Brent crude holding steady above $95 a barrel only adds fuel to this fire, complicating the outlook for Norges Bank. This environment closely mirrors the broad-based price pressures we saw build up in early 2022.
We recall the bank’s surprisingly forceful commitment to rate hikes back in 2022, which caught many off guard and sent swap rates soaring. At that time, the committee explicitly noted that a weaker krone was an inflationary risk it would not tolerate. This historical precedent suggests the bank will again act decisively to defend the currency and curb imported inflation.
Given that the market is only pricing a 25% chance of a hike by the June 2026 meeting, there appears to be value in positioning for a hawkish surprise. Front-end NOK swap rates seem too low, presenting an opportunity for traders to enter payer swaps or buy short-term interest rate futures. We believe the risk is skewed towards a sharp upward repricing in the coming weeks, much like the 43bp move we saw in early 2022.
A hawkish repricing will almost certainly benefit the Norwegian Krone, as it did during the 2022-2023 tightening cycle. The recent drift upwards in EUR/NOK towards 11.50 looks vulnerable to a reversal. Options traders could consider buying NOK calls against the Euro to position for a downward move.
Start trading now – Click here to create your real VT Markets account
Gold fell on Thursday, ending a two-day rise as uncertainty over US-Iran talks continued. XAU/USD traded near $4,444, down about 1.38%, after pulling back from Wednesday’s high near $4,602.
Iran rejected a proposed 15-point plan and said any deal would be on its own terms, including security guarantees and recognition of its authority over the Strait of Hormuz. Reports of extra US troop deployments and the end of a five-day pause on planned strikes later this week kept the outlook unclear.
Gold Pullback And Liquidity Stress
Gold was down over 15% from the March peak of $5,419, after dropping more than 20% from that high earlier this week. Traders were reported to be selling Gold for cash, mainly US Dollars, to meet losses or margin calls during volatile markets.
Rising Oil prices increased inflation concerns and supported expectations of higher interest rates for longer. Markets now expect the Fed to hold rates through 2026, instead of pricing at least two cuts, pushing US Treasury yields higher.
Technically, price was rejected at the 100-day SMA, with the RSI in the low 30s and ATR rising. Resistance sits near $4,622, then $4,964 and $5,000, while support is near $4,306 and the 200-day SMA around $4,112.
Central banks added 1,136 tonnes of Gold worth about $70 billion in 2022, the highest yearly purchase on record. Gold often moves inversely to the US Dollar and US Treasuries, and tends to benefit when rates fall.
The current market shows that gold is not acting as a typical safe-haven asset, even with significant geopolitical tension between the US and Iran. The demand for cash, specifically US dollars, is the dominant force right now, pushing traders to sell gold to cover other positions. We believe this trend will persist as long as broader market volatility remains high.
Derivatives Positioning And Reversal Risk
This pressure is intensified by the fear of inflation driven by high oil prices, which have now climbed above $110 a barrel, a level reminiscent of the 2022 energy shock. This has fueled market expectations that the Federal Reserve will hold interest rates firm throughout 2026, which in turn strengthens the US dollar. The most recent Consumer Price Index (CPI) data, showing inflation ticking back up to 4.5%, supports this hawkish outlook.
For derivative traders, this environment suggests a bearish stance on gold in the near term. We see buying put options with strike prices near the immediate support of $4,306 as a direct way to capitalize on further downside. If that level breaks, the next logical target would be puts aimed at the 200-day moving average around $4,112.
Given that volatility is expanding, option premiums are becoming more expensive. This presents an opportunity for selling call credit spreads with strikes safely above the key resistance at the 100-day moving average of $4,622. This strategy allows us to collect premium and profits from gold’s price remaining stagnant or falling further.
However, we must be prepared for a sharp reversal if a diplomatic breakthrough occurs. A peace deal would likely send oil prices tumbling, immediately easing inflation fears and weakening the case for prolonged high interest rates. In such a scenario, the primary reason for selling gold would disappear, potentially causing a rapid price squeeze.
We recall the massive central bank gold purchases that defined the market in 2025, continuing a trend of strong institutional demand. This underlying buying provides a long-term floor for the price, but it is currently being overshadowed by the market’s acute need for liquidity. This situation is similar to the dash for cash we witnessed in March 2020, where gold briefly sold off with other assets before resuming its climb.
Create your live VT Markets account and start trading now.
Start trading now – Click here to create your real VT Markets account
The Canadian Dollar weakened against the US Dollar on Thursday as Middle East tensions and uncertainty over US-Iran talks supported the Greenback. USD/CAD traded near 1.3848, its highest level since 20 January, extending gains for a fourth day.
Iran rejected a US 15-point proposal intended to end the conflict, saying any agreement would be on its own terms and only after conditions such as security guarantees and recognition of its control over the Strait of Hormuz. Press TV, citing the Iranian Army, reported a warning that any ground incursion would be “more dangerous and costly” for the United States, amid reports of further US troop deployments.
Geopolitical Risk Lifts The Greenback
US President Donald Trump said talks were ongoing despite Iran’s public denial. In a Truth Social post, he said Iranian negotiators were “begging” for a deal and warned time was running out, adding there may be “no turning back”.
Oil prices stayed volatile and above pre-conflict levels, adding to inflation concerns and complicating rate paths for the Federal Reserve and the Bank of Canada. Markets expect the Fed to hold rates through 2026 at 3.50%–3.75%, with odds of 3.75%–4.00% rising to about 40% by October, while money markets price about 75 basis points of BoC hikes by end-2026.
Given the ongoing tensions, we see the US Dollar’s strength against the Canadian Dollar persisting. Derivative traders should consider buying USD/CAD call options with strike prices above 1.3900 to capitalize on this upward momentum. This strategy offers a defined-risk way to profit if geopolitical uncertainty continues to favor the safe-haven greenback.
The situation has caused a significant spike in market volatility, which we can use to our advantage. Looking back at similar Mideast tensions in early 2024, implied volatility on currency pairs like this jumped over 30% in a matter of days. Therefore, strategies that profit from price swings, such as long straddles on the CAD, could be effective if a resolution or escalation causes a sharp market move.
Oil prices are a critical factor, with WTI crude futures now holding above $98 a barrel, a sharp increase from the $85 range we saw in late 2025. While this typically supports the CAD, the fear of global demand destruction is capping any real benefit for the currency. We should watch options on oil futures, as bets are increasing that prices could test the $110 level if the Strait of Hormuz is threatened.
Rates Volatility And Strategy Positioning
This oil-driven inflation complicates the Federal Reserve’s path, especially after we saw US core CPI struggle to get below 3.1% at the end of last year. While the market is pricing a 60% chance of rates staying on hold, traders are increasingly buying Fed Funds futures that would pay out if a precautionary rate hike occurs before October. This positioning acts as a hedge against a more aggressive, inflation-fighting Fed.
The Bank of Canada is in an even tougher position, given that our domestic growth was a sluggish 1.2% in the final quarter of 2025, well below the US figure of 2.9%. The market pricing in 75 basis points of hikes seems aggressive given this backdrop, suggesting an opportunity to bet against such a hawkish outcome. We could consider using derivatives on Canadian bond futures to position for the BoC being unable to match the Fed’s potential tightening cycle.
With the US economy on stronger footing and the USD benefiting from safe-haven flows, the path of least resistance for USD/CAD remains upward. A simple strategy is to structure bull call spreads, which involves buying a call option and selling another at a higher strike price. This lowers the cost of the trade while still allowing for profit from a continued, steady rise toward the 1.4000 psychological level in the coming weeks.
Create your live VT Markets account and start trading now.
Start trading now – Click here to create your real VT Markets account
SpaceX is not publicly traded, and there is no confirmed IPO timeline despite ongoing speculation.
Elon Musk has consistently prioritised long-term mission goals over public market pressure.
A Starlink IPO is more realistic, but only once revenue and cash flow stabilise.
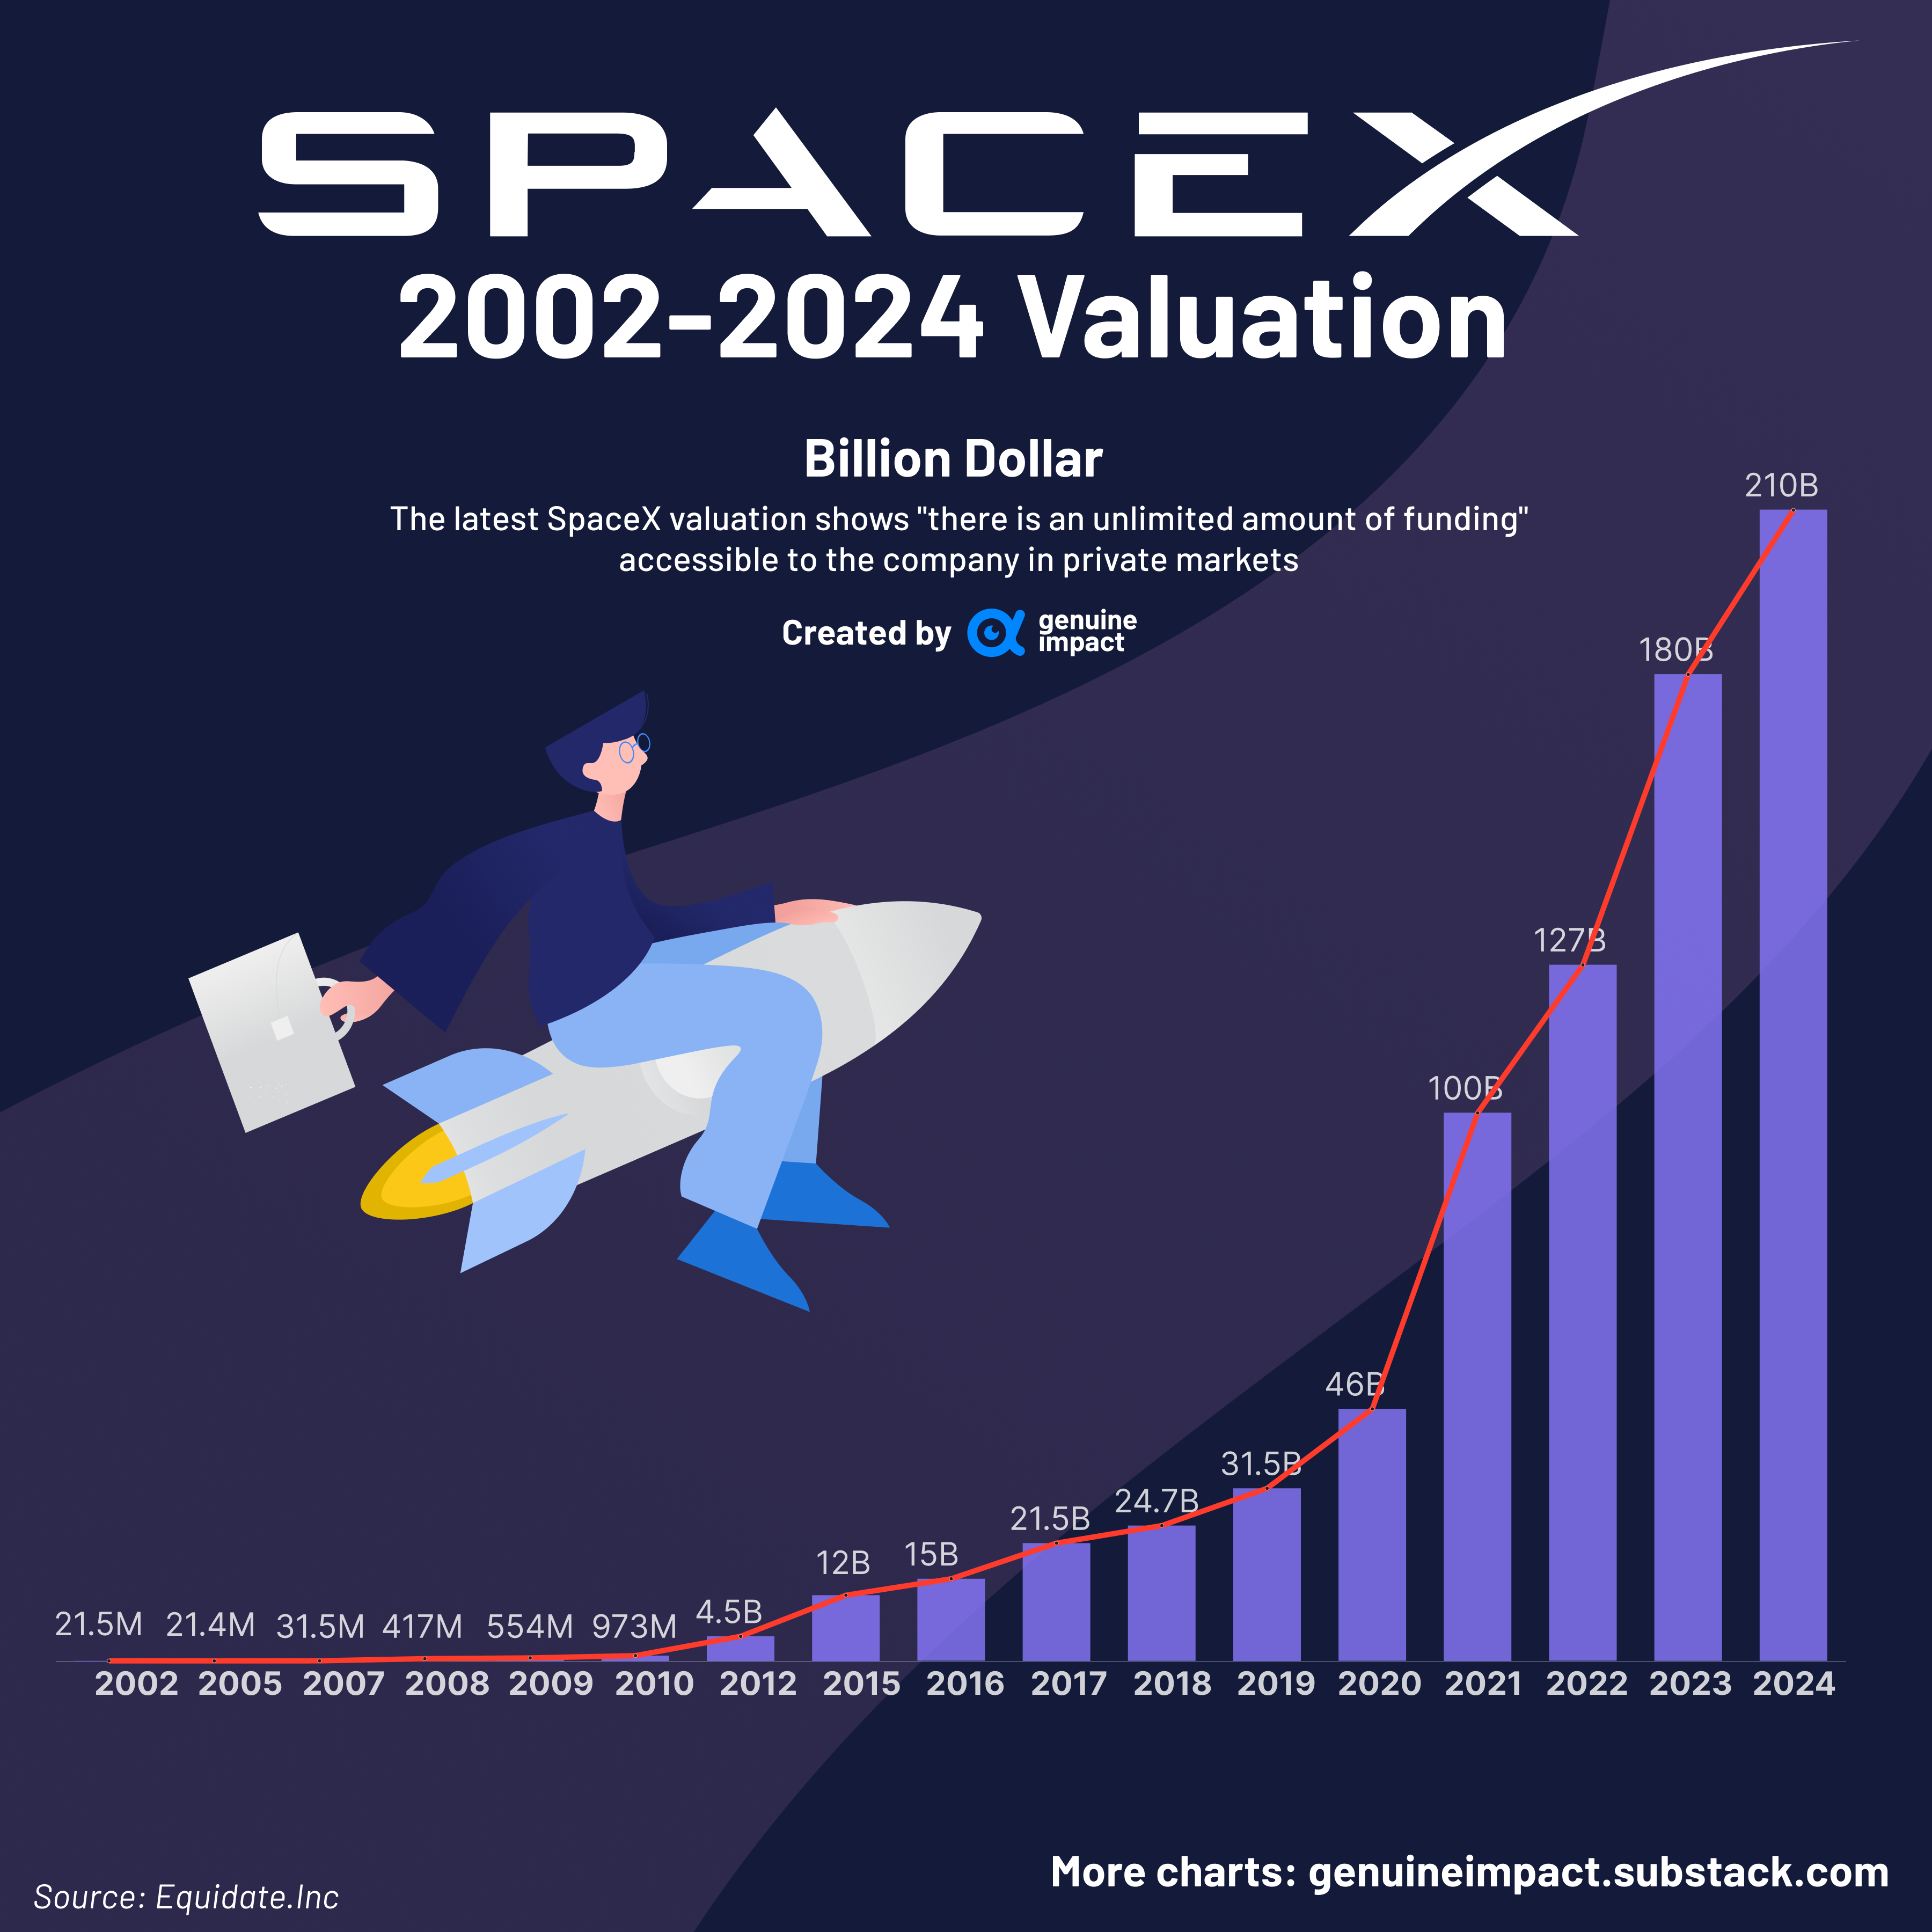
Interest in a SpaceX IPO has grown alongside the company’s rapid rise in valuation and influence. As one of the most valuable private companies in the world, SpaceX sits at the centre of several powerful narratives — space exploration, satellite infrastructure, and next-generation technology.
That combination makes it a natural target for speculation.
Search trends around “SpaceX stock” and “SpaceX IPO” have surged, particularly as retail traders look for the next high-growth opportunity similar to Tesla or Nvidia. However, much of what circulates online tends to blur the line between possibility and reality.
SpaceX is aiming to file its initial public offering prospectus with regulators later this week or next week, The Information reported, citing a person with direct knowledge of the plans https://t.co/ZUOEpEYYRVpic.twitter.com/VtU9SiDhYf
To understand whether a SpaceX IPO is likely, it is important to separate speculation from what has actually been said and done.
Myth 1: SpaceX is Already Publicly Traded
SpaceX remains a privately held company, and this is one of the most common points of confusion.
Unlike publicly listed firms, SpaceX shares are not available on exchanges such as the Nasdaq or NYSE. Ownership is concentrated among founders, employees, and private traders who participate in funding rounds.
Recent private market valuations have placed SpaceX in the range of $150 billion to $180 billion, reflecting strong investor confidence in both its launch business and Starlink division.
However, this valuation does not translate into public accessibility. For most traders, SpaceX stock simply does not exist in a tradable form.
This disconnect between visibility and accessibility is one of the main drivers behind persistent IPO rumours.
Myth 2: A SpaceX IPO Has Already Been Announced
There is no confirmed SpaceX IPO date, and no official filing indicating that the company is preparing to go public.
Elon Musk has addressed this topic on multiple occasions, and his position has been relatively consistent. He has emphasised that taking SpaceX public too early could create pressure to prioritise short-term profitability over long-term objectives.
This matters because SpaceX operates very differently from a typical technology company. Its core activities likerocket development, reusable launch systems, and deep-space missions require heavy capital investment with uncertain timelines.
In public markets, companies are expected to deliver predictable earnings and quarterly performance. SpaceX’s business model does not naturally fit that framework.
Myth 3: SpaceX Will Go Public Soon
Speculation around a near-term IPO often resurfaces during periods of strong valuation growth or major announcements. However, there is little evidence to suggest that a full SpaceX listing is imminent.
The company continues to reinvest heavily into:
Starship development.
Launch capacity expansion.
Global satellite infrastructure.
These projects are long-cycle investments that may take years to generate consistent returns.
Musk has previously indicated that a public listing would only make sense once revenue streams become more stable and predictable. At present, SpaceX’s value is still closely tied to future potential rather than fully realised earnings.
That makes it less suited to the expectations of public equity markets in the near term.
What’s Actually Likely: A Starlink IPO First
If any part of SpaceX were to go public, the most likely candidate is Starlink.
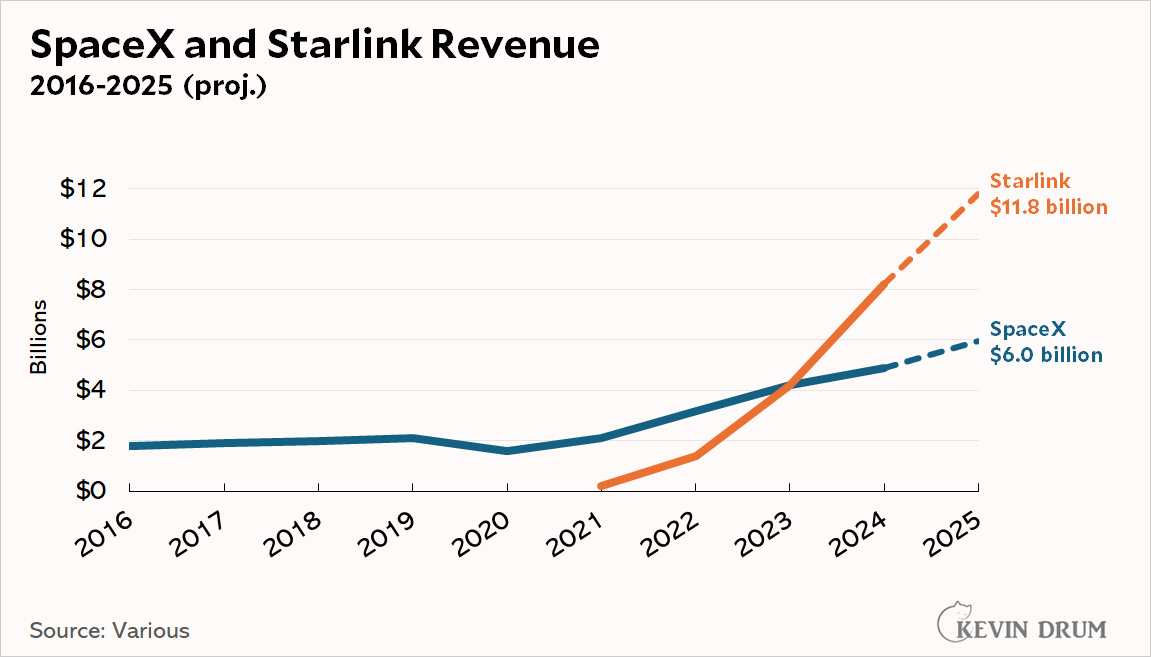
Starlink differs from the rest of SpaceX in one key way: it generates recurring revenue. The satellite internet service has expanded rapidly, serving millions of users across multiple regions and building a more traditional subscription-based business model.
Musk has suggested that Starlink could eventually be spun off as a separate entity once:
Cash flow becomes more predictable.
Operational scaling stabilises.
The business reaches a more mature stage.
From a market perspective, Starlink fits the profile of a typical IPO candidate far more closely than SpaceX’s launch operations.
This is why many analysts view a Starlink IPO as the more realistic scenario, rather than a full listing of SpaceX itself.
Why Starlink Still Matters
Even with the fresh SpaceX IPO headlines, Starlink remains the most useful part of the story for traders to understand.
Starlink is no longer just a futuristic side project. In its 2025 progress report, the company said it connected more than 4.6 million new active customers in that year alone and expanded service to 35 additional countries and territories. It also said Direct to Cell service is now commercially available in the United States and New Zealand, supported by a constellation of more than 400 satellites.
That matters because public markets understand recurring services better than they understand long-horizon engineering ambition. Rocket launches, reusable systems, and deep-space projects are powerful narratives, but recurring connectivity revenue, mobile partnerships, and scaling subscriber growth are easier for investors to price.
What Traders Can Actually Watch Instead
If SpaceX itself still sits out of reach for now, the better question becomes: where does the same theme show up in listed markets?
The first bucket is telecom adoption. T-Mobile has the clearest live commercial connection to Starlink through T-Satellite. When the Starlink story strengthens, this is one of the first listed names traders may want on the watchlist.
The second bucket is satellite communications peers and rivals. AST SpaceMobile says it is building direct-to-cell broadband to end dead zones. Iridium describes itself as a global mobile voice, data, and PNT satellite network and is pushing forward with NTN Direct.
AST SpaceMobile launched its largest-ever satellite from India, the first in a series of deployments to help the company compete against Elon Musk’s SpaceX in delivering space-based connectivity to mobile phones https://t.co/mzhCJLXRDc
These names do not give direct ownership of SpaceX or Starlink, but they do sit in the same commercial conversation around satellite connectivity, coverage, and next-generation network infrastructure.
The third bucket is space infrastructure. Rocket Lab describes itself as an end-to-end space company. That makes it a cleaner “space economy” read-through than stretching into unrelated tech stocks that only have a weak thematic link. CFD shares of companies like Virgin Galactic (SPCE) may also appeal to traders looking to dabble in the space sector.
The fourth bucket is thematic ETF exposure. Where available on the product list, space-focused ETFs can offer a broader basket approach. Roundhill’s MARS ETF says it invests in companies building the space economy, and its March 2026 factsheet lists Rocket Lab, AST SpaceMobile, EchoStar, Globalstar, and Viasat among its top holdings. Procure’s UFO ETF and VanEck’s JEDI ETF also explicitly frame themselves around space, satellite, and communications exposure.
SpaceX may still be private today, but the price action around satellite communications and the wider space economy is already visible in listed markets. Track relevant shares, ETFs, and market themes on the VT Markets app.
What a SpaceX IPO Could Mean for Markets
If SpaceX were to go public, it would likely be one of the most significant listings in modern market history.
At current valuation levels, an IPO could:
Rank among the largest technology listings ever.
Attract substantial institutional capital.
Influence index weightings and fund allocations.
Beyond size, it would also carry narrative weight. SpaceX sits at the intersection of several major themes:
Advanced technology.
Infrastructure expansion.
Long-term innovation.
A public listing would reinforce these themes and potentially draw further capital into adjacent sectors.
Bottom Line
SpaceX IPO rumours are driven more by investor interest than by confirmed plans.
The company remains private, with no official listing timeline. While a Starlink IPO is a realistic possibility in the future, a full SpaceX public offering appears unlikely in the near term.
For now, SpaceX continues to prioritise long-term growth and innovation over public market participation—making it one of the most closely watched private companies in the world.
Create a live VT Markets account today to access our platform features, including market insights and educational content.
FAQs
Is SpaceX publicly traded? No, SpaceX is a private company and is not listed on any stock exchange.
Has SpaceX officially announced its IPO? Reuters has reported that SpaceX is aiming to file soon and may reserve a large share of the offering for retail investors, but final details are still not confirmed publicly.
Why does Starlink matter so much to this story? Because Starlink has real commercial scale. It added more than 4.6 million new active customers in 2025, expanded to 35 more countries, and now has Direct to Cell service live in the United States and New Zealand.
What public assets are closest to the Starlink theme? T-Mobile is one of the clearest public links through its T-Satellite with Starlink service. Traders can also watch satellite communications names such as AST SpaceMobile and Iridium, plus space infrastructure companies and relevant ETFs where available.
Why has SpaceX not gone public? SpaceX remains private to maintain long-term focus, avoid short-term market pressure, and retain operational flexibility.
Start trading now – Click here to create your real VT Markets account