Sweden’s manufacturing PMI increased to 57.2 in April. It was 56.3 in the previous month.
The rise in Sweden’s manufacturing PMI to 57.2 indicates an accelerating expansion in the sector, which is a strong signal for the country’s economic health. This continued strength suggests robust corporate earnings ahead, particularly for industrial and export-oriented companies. We should therefore anticipate increased upward momentum in derivatives tied to the Swedish economy.
Given this positive economic data, we see the Swedish Krona (SEK) as undervalued against the Euro. The strong PMI figure makes it less likely that the Riksbank will consider cutting interest rates in the near future, creating a favorable interest rate differential for the SEK. We are looking at positions like EUR/SEK put options to capitalize on expected Krona appreciation over the next few weeks.
This report also reinforces a bullish outlook on Swedish equities, especially within the industrial sector. The data points to higher new orders and production, which should translate directly into stronger revenue for companies on the OMX Stockholm 30 index. Consequently, we are considering buying call options on the index to gain exposure to a potential market rally.
This PMI figure complements last week’s inflation data, which showed core inflation holding firm at 2.3%, slightly above the Riksbank’s target. Looking back, we saw a similar situation in mid-2025 when strong economic indicators delayed expected rate cuts and led to a sustained rally in Swedish assets. This historical precedent gives us confidence that the market may be underpricing the strength of the current economic momentum.
As a result, the market’s pricing for future interest rate cuts from the Riksbank may be too aggressive. The combination of accelerating manufacturing and sticky inflation could force a hawkish shift in the central bank’s tone. We are therefore exploring interest rate swaps that would benefit from Swedish rates remaining higher for longer than currently anticipated.
Equity markets ended last week higher, led by technology and growth shares, despite Iran-related tensions and higher oil prices weighing on sentiment. Markets also saw equities and bond yields rise at the same time.
A negative correlation between equities and bonds was reported to be returning, after a period when they had tended to move together. The week finished with higher share prices alongside higher yields.
Earnings Strength Driving Market Gains
Earnings season was described as very strong and as a key driver of the recent gains. Geopolitical risks linked to Iran and the wider Middle East were described as a source of potential downside.
Equity markets were reported to be up around 6–7% year-to-date, with returns said to be driven mainly by positive earnings growth rather than valuation changes. The piece notes it was produced using an AI tool and reviewed by an editor.
With strong first-quarter earnings providing a solid foundation, we should consider bullish strategies on equities. Recent reports show that over 80% of S&P 500 companies have surpassed their Q1 2026 earnings per share estimates, lending credibility to this rally. This suggests buying call options on tech-heavy indices could be a sound move for the coming weeks.
The persistent tensions in the Middle East mean we must remain cautious about potential shocks. WTI crude oil has pushed past $95 a barrel, its highest level since the flare-up we saw back in late 2025. Buying out-of-the-money call options on energy ETFs could serve as an effective hedge against a sudden escalation.
Balancing Equity Bond Exposure
We’re seeing a return to the classic negative correlation between stocks and bonds, a strong risk-on signal. As the 10-year Treasury yield hovers near 4.8%, this trend suggests traders could consider pairing a long equity position with a short bond position. This might involve buying put options on a long-duration bond fund like TLT.
The strong earnings momentum is acting as a support level for the market, which may dampen overall volatility. With the VIX settling back below 15, selling cash-secured puts or put credit spreads on robust companies that have already reported strong results could be a viable strategy. This approach allows us to collect premium while betting that the earnings backdrop will prevent a sharp downturn.
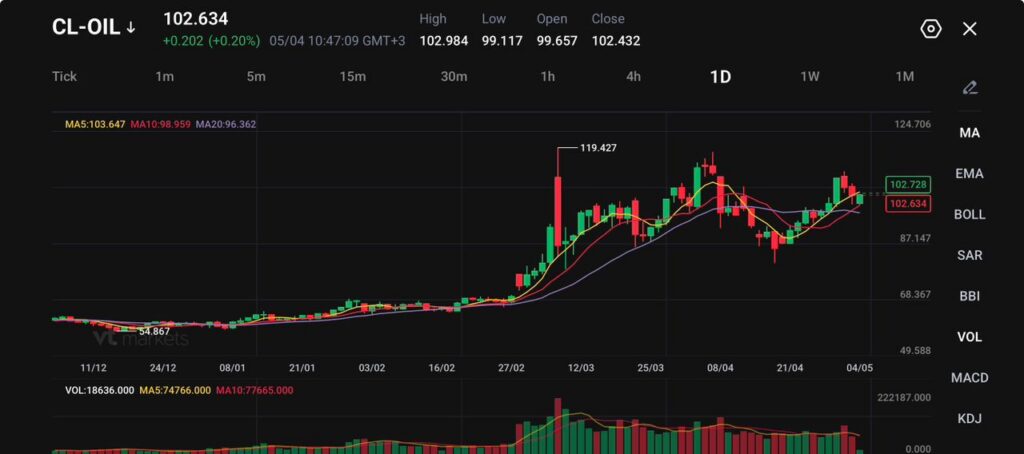
CL-OIL traded at 102.634, up 0.202 points, or 0.20%, after reaching a session high of 102.984.
WTI crude futures climbed above $102 per barrel on Monday, snapping a two-day decline.
Iran warned it would target any US forces entering the Strait of Hormuz and cautioned commercial vessels and oil tankers against moving without military coordination.
Tehran is reviewing Washington’s response to its latest 14-point proposal, keeping a narrow diplomatic path open.
WTI crude futures climbed back above $102 per barrel on Monday, snapping a two-day decline as traders reacted to fresh danger in the Strait of Hormuz. Reports said a tanker was hit by projectiles shortly after President Donald Trump announced plans to guide ships through the waterway. Reuters reported that the vessel was hit near the Strait of Hormuz, while Iran warned that US forces entering the strait could be attacked.
A fresh plan announced by Trump to help vessels through the Strait of Hormuz has left shipping executives perplexed, as attacks continue and traffic remains at a near standstill https://t.co/s59WVYAXLW
The market is trading the risk of a rescue corridor turning into a military flashpoint. Trump’s initiative, called “Project Freedom,” aims to help civilian ships flagged in non-aligned countries leave the contested passage and resume operations. Implementation is set to begin Monday, but Iran’s warning has raised the chance that even a humanitarian route could trigger a direct clash.
This keeps crude supported despite recent profit-taking. Oil prices have surged sharply this year as the Middle East conflict and the effective closure of the Strait of Hormuz have disrupted global markets. The next move now depends on whether Project Freedom eases the shipping backlog or draws US forces deeper into the strait.
Iran’s Warning Keeps The Risk Premium Alive
Iran said it would target any US forces entering the narrow strait. It also cautioned commercial vessels and oil tankers against moving without coordination with its military. That keeps shipping risk high and forces traders to price the chance of fresh delays, insurance costs, and supply disruption.
Iran's military warned US forces not to enter the Strait of Hormuz after President Donald Trump said the US would start helping to free ships stranded in the Gulf by the US-Israeli war on Iran https://t.co/oKby2ZyOUHpic.twitter.com/MCaSngx7Gz
The Strait of Hormuz remains the key pressure point because it carries a large share of global energy trade. The International Energy Agency says almost 20% of global LNG trade moved through the strait in 2025, while oil flows through the route remain vital for Middle East exporters.
For the market, the problem is simple. Any route that depends on military escort can lower one risk while raising another. If Project Freedom helps neutral ships exit without escalation, oil may lose some war premium. If Iran challenges the operation, crude could quickly retest the recent highs.
Diplomacy Still Has A Narrow Opening
Tehran said it is reviewing Washington’s response to its latest 14-point proposal. That keeps hopes for a diplomatic resolution alive, even though mistrust remains high. Al Jazeera reported that Iran’s proposal seeks to end the war rather than extend the truce, with all issues resolved within 30 days.
Iran International reported that the first phase of the proposal would involve a gradual reopening of the Strait of Hormuz and the lifting of the US blockade on Iranian ports, while Tehran would handle sea mines.
This gives oil a two-way risk profile. A credible path toward reopening Hormuz could cool crude prices fast. A rejected deal, or a clash during Project Freedom, could rebuild upside pressure and pull traders back toward the previous panic zones.
Technical Analysis
CL-OIL is trading near 102.60, holding within a choppy recovery after failing to sustain momentum above the 109–110 zone, with price now rotating back into a mid-range consolidation. The broader structure still reflects a recovery from earlier lows, but recent price action shows hesitation as buyers struggle to maintain follow-through.
From a technical standpoint, momentum is mixed and beginning to flatten. Price is hovering around the 5-day (103.64) and 10-day (98.95) moving averages, with the short-term average starting to roll over while the 10-day continues to offer support. The 20-day (96.36) remains below, indicating that while the broader structure has not fully broken down, upside momentum has clearly slowed.
Key levels to watch:
Support: 102.00 → 98.95 → 96.35
Resistance: 103.60 → 105.90 → 109.40
Price is currently sitting just below 103.60 resistance, aligning with the short-term moving average. A break above this level could help stabilise momentum and open a move back toward 105.90, where prior supply has capped rallies. However, failure to reclaim this zone keeps the market vulnerable to further range-bound behaviour.
On the downside, 102.00 is acting as immediate support, and a break below this level would expose 98.95, with deeper downside risk toward 96.35 if selling pressure builds.
Overall, oil is consolidating after a failed push higher, with price compressing between support and resistance. The next directional move will likely depend on whether buyers can reclaim the 103.60 zone or if the market rolls over into a deeper retracement.
Market Implications
Oil above $102 keeps inflation risk in the market. Higher crude can lift transport, shipping, fuel, and production costs, especially if tanker movement remains restricted through the Strait of Hormuz. That can support the US dollar, keep central banks cautious, and weigh on equity sectors exposed to fuel and logistics costs.
Energy shares may stay supported while supply risk remains high. Airlines, transport firms, consumer names, and manufacturers may face pressure if crude holds above $100 and shipping delays continue. Emerging markets that import energy may also face weaker trade balances and currency strain.
The cautious forecast favours a volatile range while CL-OIL holds between 98.959 and 103.647. A daily close above 103.647 would support a move back toward higher resistance, especially if Project Freedom faces military resistance. A break below 98.959 would suggest the market is fading the latest headline risk and could pull price back toward 96.362.
Learn more about trading Energies on VT Markets here.
Trader Questions
Why Did WTI Crude Oil Rise Above $102?
WTI crude oil rose above $102 per barrel after reports said a tanker was hit by projectiles in the Strait of Hormuz. The incident raised fresh concern over oil supply disruptions and helped crude snap a two-day decline.
CL-OIL traded at 102.634, up 0.202 points, or 0.20%, after reaching a session high of 102.984.
What Is Driving Oil Prices Higher Right Now?
Oil prices are being driven higher by renewed supply risk in the Strait of Hormuz. Traders are watching reports of tanker attacks, Iran’s warnings to commercial ships, and President Donald Trump’s plan to guide vessels through the waterway under “Project Freedom.”
The market is also reacting to the wider Middle East conflict, which has already disrupted global energy flows this year.
What Is Project Freedom And Why Does It Matter For Oil?
Project Freedom is President Donald Trump’s plan to help civilian ships flagged in non-aligned countries exit the Strait of Hormuz. It matters for oil because any attempt to guide ships through the waterway could either ease supply stress or trigger fresh confrontation with Iran.
If the project works smoothly, oil prices may lose some risk premium. If Iran responds militarily, crude could rise again.
Why Is The Strait Of Hormuz Important For Crude Oil Markets?
The Strait of Hormuz is important because it is one of the world’s key energy chokepoints. When shipping through the strait is restricted, oil markets price in tighter supply, higher insurance costs, freight delays, and possible delivery shortages.
This is why even a single tanker incident can move WTI and Brent crude prices quickly.
How Is Iran Affecting Oil Prices?
Iran is affecting oil prices by warning that it could target any US forces entering the Strait of Hormuz. Tehran also cautioned commercial vessels and oil tankers against moving through the waterway without coordination with its military.
These warnings keep the oil market focused on supply risk, even as Iran reviews Washington’s response to its latest 14-point proposal.
Start trading now – Click here to create your real VT Markets account
Gold prices in Pakistan fell on Monday, based on data compiled by FXStreet. Gold was priced at PKR 41,301.61 per gram, down from PKR 41,357.44 on Friday.
Gold also dropped to PKR 481,733.80 per tola from PKR 482,385.10 per tola on Friday. Other listed prices were PKR 413,016.00 for 10 grams and PKR 1,284,624.00 per troy ounce.
Pakistan Gold Prices Methodology
FXStreet derives Pakistan gold prices by converting international prices using the USD/PKR exchange rate and local measurement units. The figures are updated daily at the time of publication and are for reference, as local rates may differ.
Central banks are the largest holders of gold and added 1,136 tonnes worth about $70 billion in 2022, according to the World Gold Council. This was the highest annual purchase since records began, with rising reserves noted in China, India and Turkey.
Gold often moves inversely to the US Dollar and US Treasuries, and can also move opposite to risk assets such as equities. Prices may also shift with geopolitical tension, recession concerns, and changes in interest rates, as gold has no yield.
We see the recent dip in gold prices as a potential entry point rather than a sign of weakness. Geopolitical instability remains a key factor, with ongoing maritime trade tensions providing a solid backdrop for gold’s safe-haven appeal. These situations often cause traders to seek safety in tangible assets over currencies.
Drivers To Watch
The strong demand from central banks continues to provide a solid floor for prices. According to the latest World Gold Council data for the first quarter of 2026, central banks globally added a net 290 tonnes to their reserves, marking the strongest start to a year on record. This persistent buying from emerging market banks, a trend we’ve seen grow since 2022, signals a continued strategic shift away from the US Dollar.
We should also consider the inverse relationship with the US Dollar, which has softened in recent weeks. After the US non-farm payrolls report for April came in below expectations at 175,000, market expectations for a Federal Reserve rate cut later this year have increased. A lower interest rate environment makes non-yielding gold a more attractive asset for traders to hold.
Looking back, the market volatility we witnessed in the second half of 2025 taught us how quickly capital can shift into gold during periods of uncertainty. The S&P 500’s recent 3% pullback from its highs last month is triggering a similar defensive rotation, suggesting that call options on gold could be a sensible strategy. This indicates a heightened sensitivity to risk among investors compared to previous years.
Gold remains a vital hedge against inflation and currency depreciation. While the latest CPI data showed inflation moderating to 3.1%, it is still well above the central bank’s target, which keeps the risk of eroding purchasing power in focus. This fundamental concern should support a steady, underlying demand for physical gold and related derivatives.
Indonesia’s trade balance rose to $3.32bn in March, up from $1.28bn in the previous period.
This means the surplus widened by $2.04bn compared with the prior figure.
The significant increase in Indonesia’s trade surplus is a fundamentally positive indicator for the Indonesian Rupiah. We should expect the IDR to gain strength against the US dollar over the next several weeks. This environment favors derivative strategies such as buying IDR call options or selling USD/IDR forward contracts to profit from the currency’s appreciation.
This trade performance is underpinned by strong global commodity demand, particularly for nickel, which saw prices increase by 4% in April 2026 due to renewed electric vehicle production forecasts. With the USD/IDR exchange rate currently around 16,400, this news could act as a catalyst to push the pair below key technical support levels. We are already observing a build-up in options contracts betting on the Rupiah strengthening to below 16,250 by the end of the quarter.
This positive economic data also suggests upside for Indonesian equities, especially in the materials and basic resources sectors. The Jakarta Composite Index (JCI) should find support from this news, making JCI futures a potentially attractive long position. We should also consider buying call options on large, export-focused Indonesian companies that will directly benefit from this trade dynamic.
Looking back at the more inconsistent trade balances we saw through parts of 2025, this robust surplus marks a return to a stronger footing for the economy. A stronger Rupiah will aid Bank Indonesia’s efforts to manage inflation, which last printed at 3.5% year-over-year. This gives the central bank more policy room, which is a comforting signal for stability that derivative markets will price in.
Indonesia’s imports growth slowed to 1.51% in March, down from 10.85% in the previous period. The change shows a sharp easing in the pace of import expansion.
The figures compare March with the prior reading of 10.85%. No further breakdown of import categories or causes was provided.
Implications For Domestic Demand And Growth
The sharp drop in March imports to 1.51% from 10.85% signals a significant and abrupt slowdown in Indonesia’s domestic demand. This points to weakening consumer and business activity, which could negatively impact economic growth forecasts for the second quarter. We should now anticipate that the Q1 2026 GDP growth, which came in at 4.9%, may represent a peak for the year.
This weak import figure could, counterintuitively, provide short-term support for the Indonesian Rupiah (IDR). A lower import bill improves the nation’s trade balance, which has helped the IDR find a floor near 16,450 against the US dollar recently. However, we believe this is a fragile stability, as the underlying story of slowing growth may soon lead to capital outflows.
For our equity positions, this is a clear warning sign for the Jakarta Composite Index (JCI). We are reducing exposure to consumer-cyclical and industrial sector stocks, which are most sensitive to a domestic slowdown. This is a major shift from the bullish outlook we held in late 2025 when import growth was robust, fueled by government infrastructure projects.
The data puts Bank Indonesia in a difficult position, as April’s inflation numbers remained slightly elevated at 3.3%. This will likely force them to hold interest rates steady in the near term, even as the economy cools, creating policy uncertainty. We are positioning for higher volatility in IDR options markets as traders digest these conflicting signals of slowing growth and sticky inflation.
What We Are Watching Next
In the coming weeks, we will be watching for April’s export data to see if the trade balance can remain positive. A poor export number combined with these weak imports would confirm a broad economic downturn, likely pushing the IDR through its recent support levels. We are therefore considering buying out-of-the-money put options on the IDR as a low-cost hedge against this scenario.
Gold prices in India fell on Monday, based on FXStreet data. Gold was priced at INR 14,145.31 per gram, down from INR 14,159.59 on Friday.
Gold also slipped to INR 164,990.00 per tola from INR 165,154.70 per tola on Friday. Other listed prices were INR 141,454.70 for 10 grams and INR 439,970.00 per troy ounce.
Indian Gold Pricing Reference
FXStreet derives Indian gold prices by converting international prices using USD/INR and local units. The figures are updated daily at publication time and are for reference, as local rates may vary slightly.
Central banks are the largest holders of gold. They added 1,136 tonnes worth about $70 billion in 2022, according to the World Gold Council, the highest annual purchase on record.
Gold often moves opposite to the US Dollar and US Treasuries, and tends to move against risk assets. Its price can also react to geopolitical events, recession fears, and interest rate changes, as it is priced in US dollars (XAU/USD).
An automation tool was used to create the post.
Trading Outlook For Gold
With the date today being May 4th, 2026, we see gold maintaining its firm stance as a hedge against uncertainty. Recent data for the first quarter of 2026 points to a slowdown in global economic growth, reinforcing the metal’s safe-haven appeal. This environment makes holding long positions in gold futures an interesting strategy.
We are paying close attention to signals from the US Federal Reserve, which now suggest a possible rate cut later in the third quarter. Lower interest rates would decrease the opportunity cost of holding non-yielding bullion, which could push prices higher. This outlook supports buying call options with expirations in late 2026.
Looking back from our 2025 perspective, the trend of central bank buying that was so strong in 2022 continued, with an additional 950 tonnes added to reserves globally through last year. This consistent demand, coupled with persistent low-level geopolitical tensions, provides a solid floor for gold prices. It suggests that any significant dips in price will likely be met with strong buying interest.
The US Dollar Index has softened by about 3% since its peak earlier this year, providing a tailwind for gold. At the same time, risk assets have faltered, with the S&P 500 down roughly 2% year-to-date after a very strong performance in 2025. This classic inverse correlation suggests traders could use gold derivatives to hedge their equity portfolios.
For the coming weeks, this environment suggests considering long positions in gold futures or buying call options with strike prices above the current market level. Selling out-of-the-money put options could also be a viable strategy to collect premium while expressing a bullish-to-neutral view. We believe volatility will remain, creating opportunities for nimble traders.
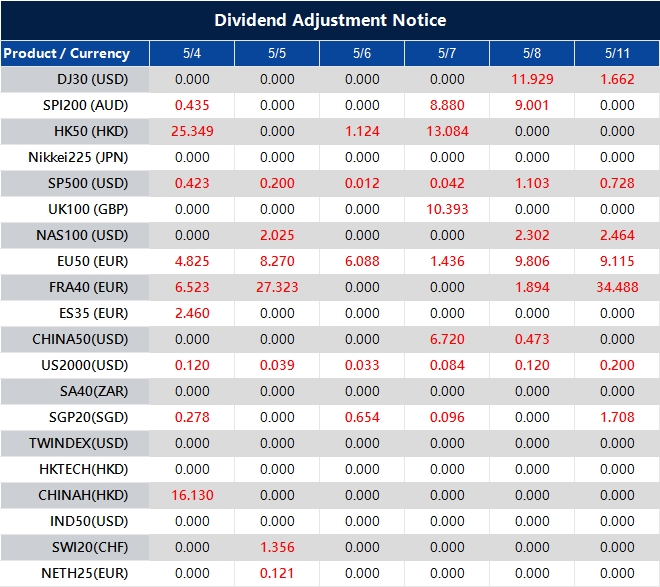
Please note that the dividends of the following products will be adjusted accordingly. Index dividends will be executed separately through a balance statement directly to your trading account, and the comment will be in the following format “Div & Product Name & Net Volume”.
Please refer to the table below for more details:
The above data is for reference only, please refer to the MT4/MT5 software for specific data.
If you’d like more information, please don’t hesitate to contact [email protected].
AUD/USD is trading in a consolidation phase above 0.7200 at the start of the week. It is holding near its highest level since June 2022, reached on Friday.
Market pricing for a Reserve Bank of Australia (RBA) rate rise at Tuesday’s meeting is supporting the Australian Dollar. At the same time, rising US-Iran tensions are supporting the safe-haven US Dollar, which is limiting gains.
Technical Outlook And Momentum
On the 4-hour chart, the pair recently rebounded from the 100-period Exponential Moving Average (EMA) and then broke and closed above the 0.7200 resistance level on Friday. The Relative Strength Index (RSI) is around 62, and the Moving Average Convergence Divergence (MACD) histogram is slightly positive.
These indicators point to ongoing upward momentum from the late-March swing low. If the pair pulls back, support may be found near the 100-period EMA around 0.7137, while a decisive break below that level could lead to a deeper correction.
The RBA sets rates across eight scheduled meetings each year. A rate rise is typically supportive for the AUD, while no change or a cut is typically negative for the currency.
We are seeing the AUD/USD hover around the 0.6650 mark ahead of the Reserve Bank of Australia meeting next week. The market is pricing in a small chance of a rate hike following last month’s quarterly inflation data, which showed CPI at 3.9%, proving stickier than anticipated. This situation is creating tension for the pair, as traders await fresh guidance from the central bank.
Options Strategies For Event Risk
This environment feels familiar, reminding us of a similar setup back in early 2025 when bullish sentiment pushed the pair above 0.7200 on rate hike expectations. We saw then how technical signals like the RSI and MACD strongly supported an upward move. However, that rally eventually lost steam as global factors began to favour the US dollar later that year.
Currently, the US dollar remains strong due to the Federal Reserve’s own cautious stance on inflation and persistent trade tensions in the South China Sea. Australian unemployment also recently ticked up to 4.1%, giving the RBA a reason to remain on hold despite price pressures. This dual-sided risk suggests that a straightforward bet on direction is difficult.
For those anticipating a hawkish surprise from the RBA, buying near-term AUD/USD call options with a strike around 0.6750 could be a prudent way to capture potential upside. This strategy offers a defined-risk approach to profit if the Aussie gets a significant boost from the central bank’s statement. The premium paid is the maximum potential loss, protecting against a sharp downward move.
Conversely, traders concerned about a dovish RBA or a flight to safety benefiting the USD could consider buying put options. A move below the recent support level of 0.6600 could accelerate, and puts would offer protection or a way to speculate on that outcome. This hedges against the possibility that the RBA prioritizes the slightly weakening labour market over the inflation figures.
Gold prices in Malaysia fell on Monday, based on FXStreet data. Gold was MYR 586.00 per gram, down from MYR 586.74 on Friday.
Gold also dropped to MYR 6,834.95 per tola from MYR 6,843.63 per tola on Friday. FXStreet listed MYR 5,859.96 for 10 grams and MYR 18,226.54 per troy ounce.
How FXStreet Calculates Local Gold Prices
FXStreet calculates local prices by converting international rates using USD/MYR and applying local units. The figures are updated daily at publication time and are for reference, with local rates able to differ slightly.
Central banks are the largest holders of gold. They added 1,136 tonnes worth about $70 billion in 2022, according to the World Gold Council, the highest annual total since records began.
Gold often moves inversely to the US Dollar and US Treasuries, and can also move opposite to risk assets such as shares. Prices may also react to geopolitical events, recession fears, and interest-rate changes, as gold pays no yield.
Given the minor pullback in gold, we see this as a consolidation phase rather than a change in the underlying trend. This small dip should be viewed in the context of gold’s strong performance during the geopolitical tensions we saw flare up again in late 2025. The metal remains a key safe-haven asset in portfolios.
Key Market Drivers To Watch
The primary driver to watch is the shifting stance of the US Federal Reserve. After holding rates steady through much of 2025 to combat persistent service-sector inflation, futures markets are now pricing in a greater than 60% probability of a rate cut by the fourth quarter of 2026. As a non-yielding asset, gold becomes more attractive as interest rate expectations fall.
This dynamic is weakening the US Dollar, which has fallen over 3% against a basket of currencies since March. This provides a significant tailwind for gold, which is priced in dollars. We also note that central bank buying, which set records back in 2022 and remained robust through 2025, continues to create a solid floor under the market, absorbing any significant dips.
For derivative traders, this environment suggests that buying long-dated call options is a prudent strategy. Contracts expiring in late 2026 or early 2027 would capture the potential price appreciation if the Fed does indeed begin an easing cycle. This approach offers leveraged upside while defining the maximum risk to the premium paid.
Implied volatility in gold options has not yet fully priced in this potential policy shift, with the GVZ index currently trading below its one-year average. This makes strategies like call spreads or even outright call purchases relatively inexpensive. Traders should monitor this, as a spike in volatility could present opportunities for selling premium.
In the coming weeks, all eyes should be on US inflation and employment data. Any signs of economic cooling will likely accelerate bets on Fed rate cuts, pushing gold higher. We will be closely watching the next CPI report for confirmation of this disinflationary trend.