Australia’s S&P Global Composite PMI fell to 47.0 in March, down from 52.4 previously.
A reading below 50 indicates contraction, while a reading above 50 indicates expansion.
Private Sector Activity Turns Negative
The latest PMI data shows a sudden shift from expansion to contraction in Australia’s private sector. This figure, at 47.0, is a significant negative surprise compared to last month’s 52.4 reading. We should view this as a primary signal that economic headwinds are strengthening considerably.
This unexpected downturn will likely inject significant uncertainty into the market. We anticipate a spike in implied volatility on the ASX 200 index. Traders should consider buying volatility through instruments like straddles, preparing for larger price swings in the weeks ahead.
The Reserve Bank of Australia is now under immense pressure to adopt a more dovish stance, despite inflation still being above target as of late 2025. This PMI reading makes future interest rate hikes highly improbable and brings potential rate cuts into focus. Interest rate futures should be adjusted to price in a higher probability of RBA easing before year-end.
A contracting economy directly threatens corporate earnings, making the outlook for equities bearish. We should consider establishing short positions on the ASX 200 index futures. Buying put options on the XJO provides a clear, risk-defined way to position for a potential market downturn.
Pressure Builds On Aud And Cyclicals
This data is bearish for the Australian dollar, especially as key commodity prices like iron ore have already slumped over 15% this year. The prospect of lower interest rates will further weigh on the currency. We should look at shorting AUD/USD futures or buying put options on the currency.
We expect cyclical sectors, such as mining and banking, to underperform significantly in this environment. This mirrors the pattern we observed during the economic slowdown in the latter half of 2024. Bearish positions on major resource and financial stocks or related ETFs are now warranted.
Create your live VT Markets account and start trading now.
Start trading now – Click here to create your real VT Markets account
Australia’s S&P Global Services PMI fell to 46.6 in March, down from 52.8 in the previous month.
A reading below 50 indicates contraction, while a reading above 50 indicates expansion.
Services PMI Shock And Market Implications
The sharp drop in the services PMI from 52.8 to 46.6 is a major red flag for the Australian economy. This signals the services sector, a key driver of growth, is now contracting unexpectedly. We should therefore anticipate increased bearish sentiment on Australian equities and the local dollar in the coming weeks.
Such a surprise downturn will likely cause a spike in implied volatility on indices like the ASX 200. This makes buying protective put options more expensive, but also potentially more necessary as a hedge against further declines. We could look at put spreads to cheapen the cost of entry while preparing for a potential slide towards the 7,500 level, a support zone tested back in late 2025.
The market will now quickly price in a higher probability of an interest rate cut from the Reserve Bank of Australia later this year. Just last week, interbank futures were only pricing a 20% chance of a cut by August; we expect that to jump above 50% on this news. This outlook puts downward pressure on the Australian dollar, making short AUD/USD positions via futures or options attractive.
This situation is reminiscent of the slowdown fears we saw in 2024, where sticky inflation kept the RBA from easing despite weakening growth signals. We should be particularly cautious with consumer discretionary and banking stocks, as they are highly sensitive to both service sector health and interest rate expectations. As of the last quarter, consumer spending had already fallen 0.5%, and this data suggests that trend is worsening.
This weakness may also reflect the recently reported sputtering in China’s services consumption, which fell by 1.5% last month. Australia’s reliance on Chinese demand for tourism and education services means a slowdown there directly impacts our domestic numbers. Therefore, we should monitor Chinese economic data even more closely as a leading indicator for our own market direction.
Australia’s S&P Global Manufacturing Purchasing Managers’ Index (PMI) fell to 50.1 in March, from 51 in the previous month.
A reading of 50 marks the line between expansion and contraction in manufacturing. At 50.1, the index indicates output was close to unchanged in March.
Manufacturing Growth Nearly Stalls
This new data shows Australia’s manufacturing sector has nearly stalled, with growth slowing to a crawl. The slide to 50.1 is just barely in expansion territory, signaling that economic momentum is fading fast. We should view this as a leading indicator of potential weakness for the broader Australian economy in the coming weeks.
Given this slowdown, the Reserve Bank of Australia is now less likely to consider further interest rate hikes. This puts downward pressure on the Australian dollar, so we are watching for opportunities to short the AUD/USD currency pair. Derivative traders might consider buying put options on the Aussie dollar, anticipating a move lower.
For the Australian stock market, this reading is a bearish signal for corporate earnings, especially in the industrial and materials sectors. We could see traders begin to price in a downturn by buying put options on the ASX 200 index. Selling call spreads would be another strategy to capitalize on a market that is unlikely to see a major rally from here.
This PMI figure supports the central bank’s recent decision to hold the cash rate at 4.35%, a level it has maintained for several months now. Inflation data has also been easing from the highs we saw in 2024, but it remains persistent. The RBA is now caught between this economic weakness and its inflation fight.
We saw a similar pattern of a weakening PMI back in early 2025, which preceded a period of notable volatility in the equity markets. That historical context suggests preparing for increased price swings. The current situation mirrors that period, where economic optimism began to wane significantly.
China Demand Adds To Headwinds
This local slowdown is amplified by recent manufacturing data from China, which has also shown a lack of strong recovery. As Australia’s largest trade partner, sluggish demand from China directly impacts our key commodity exports like iron ore. This reinforces a cautious or bearish outlook on our major mining stocks.
Create your live VT Markets account and start trading now.
Start trading now – Click here to create your real VT Markets account
EUR/USD rose 0.37% to 1.1613 on Monday after rebounding from near 1.1484. The move followed Donald Trump’s post about a five-day truce after talks between Tehran and Washington, which weakened the US Dollar.
Geopolitical news dominated trading as risk appetite improved, while oil prices, US Treasury yields, and the US Dollar fell. The US Dollar Index was down 0.37% at 99.13 after reaching 100.14, and the Dollar moved with West Texas Intermediate.
Geopolitical Tensions And Market Reaction
Tensions remained as Iran reportedly fired two intermediate-range ballistic missiles at Diego Garcia, and US warnings focused on the Strait of Hormuz. CBS reported US officials saying the strait contains about a dozen Iranian mines.
With little economic data, markets watched central bank comments and policy pricing. Markets are not expecting a US rate cut this year, while the chance of an ECB hike is near 64% for 30 April and 74% for June, with nearly 35 basis points priced in.
Technically, EUR/USD sat near 1.1614, with resistance at 1.1640, 1.1690, and around 1.1730. Support was cited at 1.1570, 1.1510, and 1.1420, with RSI near 48.
The temporary truce has introduced significant uncertainty, making short-term direction difficult to predict. We should consider buying volatility through options, like straddles or strangles, to profit from a large price swing in either direction if the truce holds or collapses. Looking back at the geopolitical shock in early 2022, we saw the 3-month implied volatility for EUR/USD jump by over 35% in a matter of weeks, a pattern that could repeat.
The fundamental outlook, however, seems to favor the Euro due to the clear divergence in central bank policy. With the ECB signaling potential rate hikes and the Fed appearing more hesitant, a medium-term strategy could involve buying EUR/USD call options to capture potential upside beyond the current geopolitical noise. This is the opposite of the trend we saw in 2022, when the Fed’s aggressive hiking schedule pushed the EUR/USD below parity while the ECB lagged behind.
Options Strategies And Key Technical Levels
We must also hedge against a sudden reversal where the truce fails and risk aversion returns, strengthening the US Dollar. A breakdown in talks could cause oil prices to spike again, similar to how WTI crude surged over 60% in the first half of 2022, which would pressure the Fed on inflation and boost the dollar. Buying out-of-the-money EUR/USD put options could be a cost-effective way to protect against a sharp drop back toward the 1.1484 lows.
Technically, the 1.1730 level represents a major resistance area, making it an attractive strike price for selling covered calls to generate income if we expect the rally to stall there. Conversely, a break below the 1.1570 support level could trigger further selling, which suggests that strike price could be a key level for protective puts. The market is pricing in a 64% chance of an ECB hike by April, so we should expect continued upward pressure on the Euro as long as the conflict de-escalates.
Create your live VT Markets account and start trading now.
Start trading now – Click here to create your real VT Markets account
NZD/USD traded near 0.5860 in early Asian hours, after giving back almost half of its intraday rise late in the US session. The pair was last noted around 0.5856 on the 4-hour chart.
Risk appetite improved after Donald Trump indicated possible de-escalation with Iran, citing “major points of agreement” and hoping for a meeting soon. This reduced demand for safe-haven assets and supported risk-linked currencies.
Market Drivers And Dollar Tone
The US Dollar Index traded below 100.00 at 99.10 as markets reassessed the Federal Reserve policy outlook. The steadier dollar limited NZD/USD upside.
Within Asia, stable sentiment and firmer commodity conditions offered extra support to the New Zealand dollar. Gains were restrained by uncertainty around global growth and trade.
Technically, price held above support and sat just above the 20-period moving average at 0.5837, while the 100-period moving average near 0.5884 capped progress. The RSI was 53, pointing to balanced momentum.
Support levels were 0.5842, then 0.5804 and 0.5763. Resistance was 0.5881, and a move above it could allow a push higher.
Historical Context And Current Regime
We recall a similar market mood back in 2025 when improved risk sentiment pushed the NZD/USD toward the 0.5860 level. Back then, geopolitical de-escalation and a consolidating US dollar created a fragile floor for the kiwi. That period taught us how quickly risk-on dynamics can support the currency, even if gains are limited.
Today, the situation has evolved, with the pair trading notably higher around 0.6155. The key driver now is the divergence in central bank policy, with New Zealand’s latest quarterly inflation data from late 2025 holding at 3.1%, keeping the RBNZ on a hawkish footing. In contrast, the US has seen core inflation cool to 2.5%, fueling speculation the Federal Reserve may be the first to cut rates this year.
Given this outlook, traders should consider buying NZD/USD call options to capitalize on potential upside. An option with a 0.6200 strike price and a June 2026 expiry would provide exposure to the expected upward trend. This strategy allows for significant gains if the policy divergence continues to push the pair higher.
For those more cautious about a “shallow grind” like we saw in the past, a bull call spread is a viable alternative. By buying the 0.6200 call and simultaneously selling a 0.6275 call, traders can lower their initial cost. This caps the maximum profit but offers a more cost-effective way to bet on modest, controlled gains.
Implied volatility for the kiwi is currently moderate, making options pricing reasonable compared to the spikes seen during the 2025 global growth scares. This environment is favorable for establishing new positions without overpaying for time premium. We should use this period of relative calm to position for the next directional move.
Looking ahead, the next RBNZ interest rate decision and the upcoming US non-farm payrolls report are the critical data points to watch. These events will either confirm the current policy divergence or force a reassessment of our bullish bias. Traders should be prepared to adjust their positions based on these outcomes in the coming weeks.
Create your live VT Markets account and start trading now.
Start trading now – Click here to create your real VT Markets account
Policymakers appear to be assuming the oil shock tied to the Iran conflict will eventually fade, allowing growth to remain firm and inflation to normalise.
That assumption is now the market’s biggest risk. If energy prices remain elevated, the Fed may be forced into a longer, higher-for-longer stance.
The biggest market risk is a policy mismatch: stronger growth forecasts, higher inflation projections and continued rate-cut guidance do not sit comfortably together.
Leadership uncertainty around Jerome Powell and the expected arrival of Kevin Warsh adds another layer of policy and market tension.
This week’s focus is on whether price action across the dollar, oil, gold, equities and crypto confirms a deeper macro repricing.
The Federal Reserve is trying to hold together a narrative that is becoming harder for markets to accept.
At the March 2026 FOMC meeting, officials voted 11–1 to keep the benchmark rate unchanged at 3.50% to 3.75%. On the surface, that looked like a steady and measured outcome. The median dot still points to one rate cut in 2026.
But the details told a more cautious story.
Chair Jerome Powell acknowledged two immediate problems. Inflation data had already been running firmer than expected before the Iran conflict intensified, and the geopolitical backdrop now makes the path forward
even less predictable. The Fed lifted its 2026 PCE inflation forecast to 2.7%, up from 2.4% in December, while also signalling that it is too early to fully measure the economic damage from the war and the associated supply risks around the Strait of Hormuz.
That leaves markets with an uneasy question: if inflation is moving higher and geopolitical risk is rising, why is the Fed still trying to keep rate cuts alive?
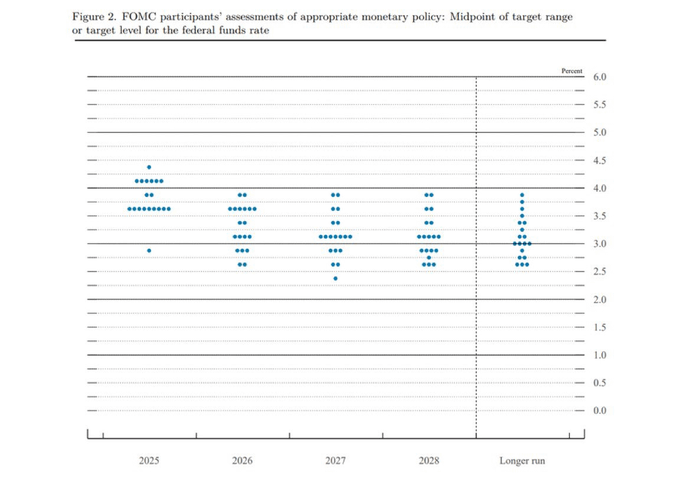
A Dot Plot That Looks Stable But Feels Less Dovish
Federal Reserve ‘dot plot’ (Courtesy: Federal Reserve)
The median projection still suggests one cut, but the internal shift was more important than the headline.
Powell said that four or five members moved their projections from two cuts to one, showing that the centre of the committee has shifted toward more caution. In other words, the dot plot did not collapse, but it did become less dovish.
That matters because markets tend to react first to the headline, then slowly catch up with the distribution underneath it.
The Fed is effectively telling markets that inflation remains sticky, oil risk is real, and uncertainty is elevated, yet some degree of policy easing is still possible later in the year. That only works if the energy shock fades and broader price pressures cool again.
For now, that looks more like an assumption than a conclusion.
Contradiction In The Growth Forecast
The latest Fed message not only suggests an inflation upgrade, it appears officials also lifted their 2026 GDP growth forecast to 2.4%. That creates a tension at the heart of the macro outlook.
If the Iran conflict is serious enough to raise inflation expectations and threaten energy markets, then forecasting stronger growth at the same time implies a very benign view of how temporary the shock will be.
The Fed appears to be betting that US demand can absorb higher energy costs without a meaningful hit to momentum. That may prove right, but it is a narrow path.
If oil remains elevated, the economy could slide toward a more stagflationary setup where inflation stays firm while growth deteriorates. In that environment, the projected rate cut would become even harder to justify.
Higher For Longer Quietly Becomes The Base Case
The market may still focus on the headline of “one cut,” but the deeper signal from the meeting is that higher for longer remains the dominant policy bias.
The Fed does not want to sound overly hawkish while markets are already dealing with war risk and fragile sentiment. But its own projections are moving in that direction. If inflation remains sticky and oil does not retreat, that single projected cut may disappear altogether.
That is why this week’s cross-asset price action matters so much. Markets are now testing whether the Fed’s optimistic balance between growth, inflation and easing can still hold.
Leadership Transition Adds Another Risk Layer
The macro picture is further complicated by leadership uncertainty inside the Fed.
The upcoming arrival of Kevin Warsh in June introduces a political and policy dimension that markets cannot ignore. Warsh is widely perceived as more supportive of lower rates, but he may be stepping into an environment where the inflation backdrop leaves very little room for early easing.
Political friction surrounding DOJ subpoenas and Senate confirmation dynamics could keep Powell in place longer than expected, delaying a clean leadership transition. That uncertainty could matter for market psychology, especially if traders begin to price not just the next move in rates but also the next policy-making regime.
In practice, Warsh may inherit a Fed that remains trapped in a higher-for-longer framework, regardless of his personal policy preferences.
Is The Fed Losing The Plot?
Under standard macro logic, when growth forecasts rise and inflation projections rise, the case for cutting rates becomes weaker, not stronger. Holding steady makes sense. Signalling that even one cut becomes much more debatable.
The Fed has acknowledged uncertainty from the Iran conflict, admitted inflation pressures have already intensified and still kept alive the idea of future easing. That combination is what makes the latest outlook feel unstable and even frivolous.
The more charitable interpretation is that policymakers are trying to avoid overreacting to what they still view as a temporary geopolitical shock. The harsher interpretation is that the Fed is trying to preserve market calm while the internal logic of its projections is becoming increasingly difficult to defend.
Either way, traders should pay less attention to the median dot alone and more attention to the committee’s direction. The broader message is that officials are drifting toward fewer cuts, more caution and less conviction in the disinflation story.
Upcoming Events
24 March 2026
1. US/UK/EUR Flash PMIs
First meaningful read on whether war risk and higher energy costs are starting to hit activity.
25 March 2026
1. JP CPI (February), Previous: 1.50%
A hotter inflation print could revive BOJ tightening expectations and make any fresh upside in USDJPY more sensitive.
2. US Import and Export Prices
A useful second-tier inflation check. If import prices stay firm, it adds to the view that the Fed may have to stay cautious even while still projecting a cut.
26 March 2026
1. US Initial Jobless Claims, Forecast: 211K, Previous: 205K
Labour-market resilience would reinforce the Fed’s cautious stance and keep the dollar supported. A softer claims trend could ease some of the pressure on risk assets.
For a full view of upcoming economic events, check out VT Markets’ Economic Calendar.
Key Movements Of The Week
This week is less about what the Fed said and more about whether markets believe it. For markets, the Fed’s latest message reinforces a fragile cross-asset setup.
US dollar may stay firm if the Fed’s underlying hawkish shift becomes more visible through rates pricing.
Oil remains central. As long as geopolitical risk keeps energy markets tight, inflation expectations stay vulnerable to another move higher.
Gold may remain supported by policy uncertainty, geopolitical stress and doubts about the durability of real disinflation.
Equities could struggle if investors begin to accept that rate cuts may not arrive as easily as previously expected, especially if growth optimism starts to fade.
Risk assets more broadly, including crypto, may face a tougher backdrop if the market begins to price a longer period of restrictive policy into an already uncertain macro environment.
Key Symbols to Watch
USDX || CL-OIL | USOUSD | SP500 |
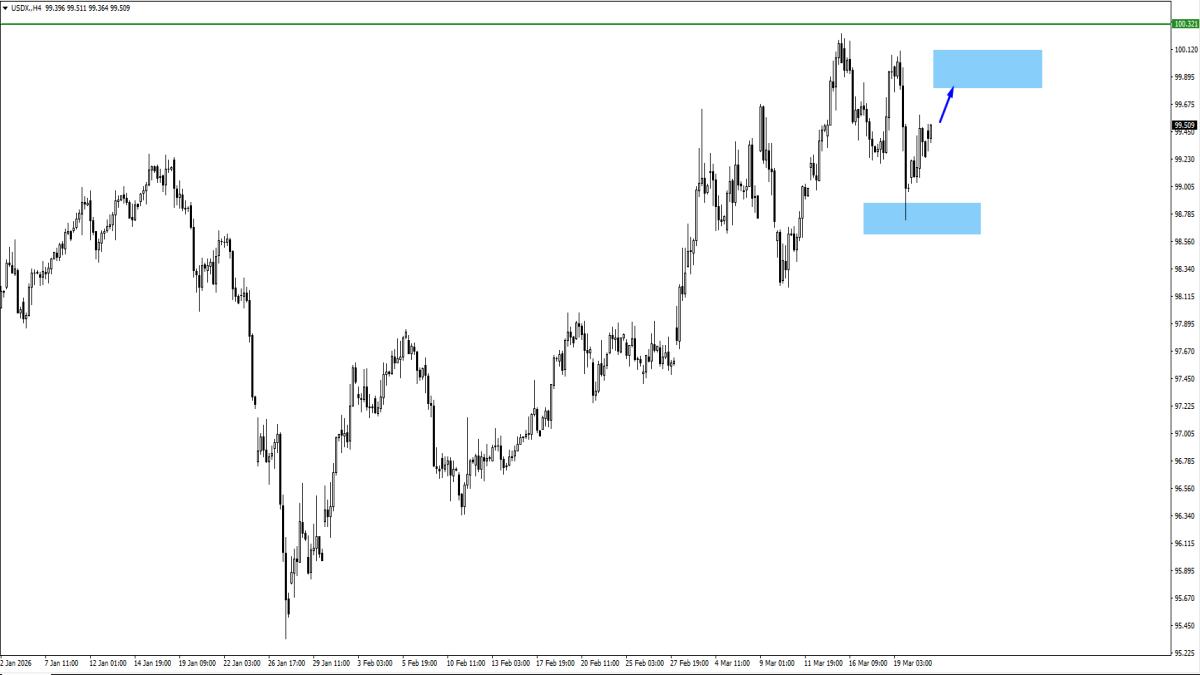
USDX
Watch this week
Resistance focus near 100.00.
Rejection there may trigger consolidation.
Acceptance above it would strengthen the higher-for-longer narrative.
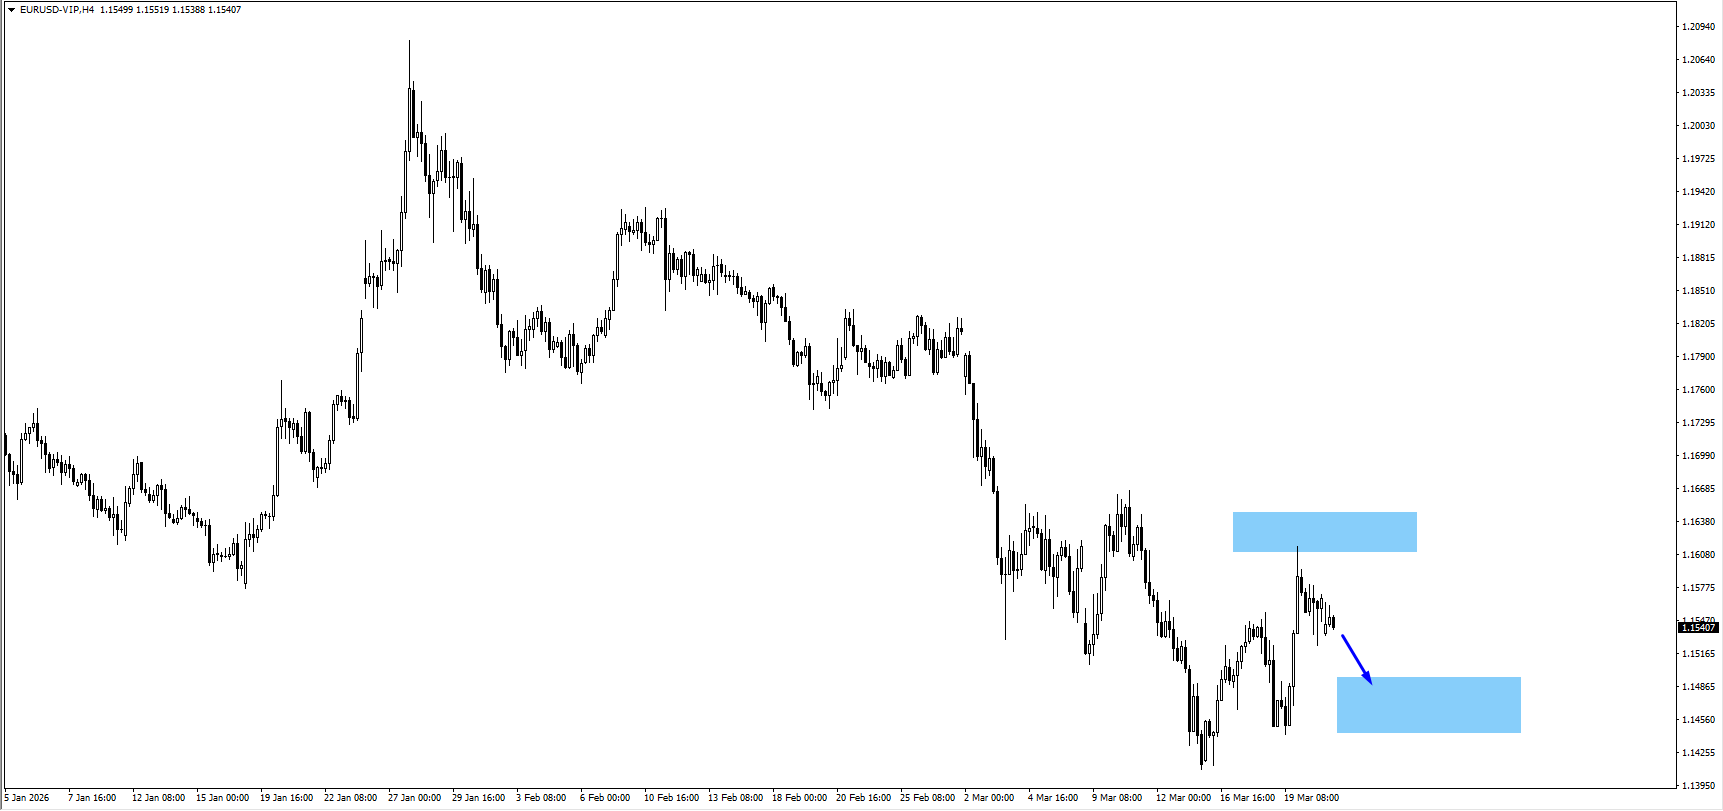
EURUSD
Watch this week
Near-term downside focus at 1.1475.
Weak price action there keeps pressure on the pair.
A firm hold could slow the dollar move.
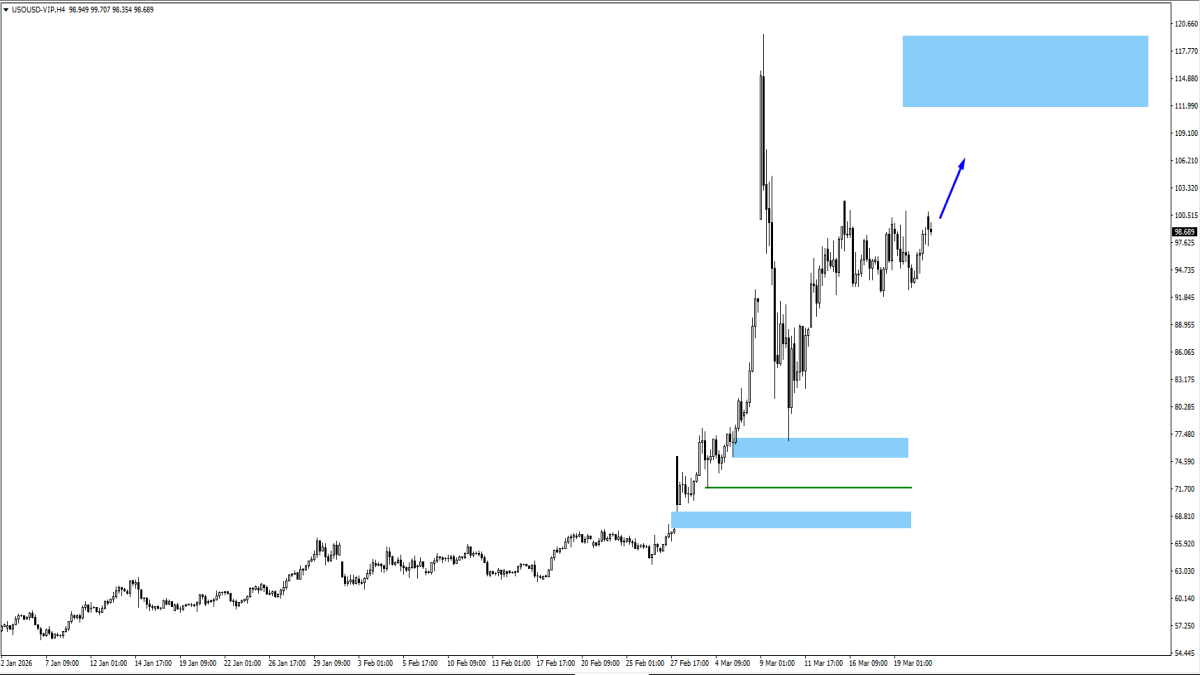
US Oil
Watch this week
Break and hold above 99.284.
Upside extension toward 112.20.
Any de-escalation headlines could trigger sharp retracement risk.
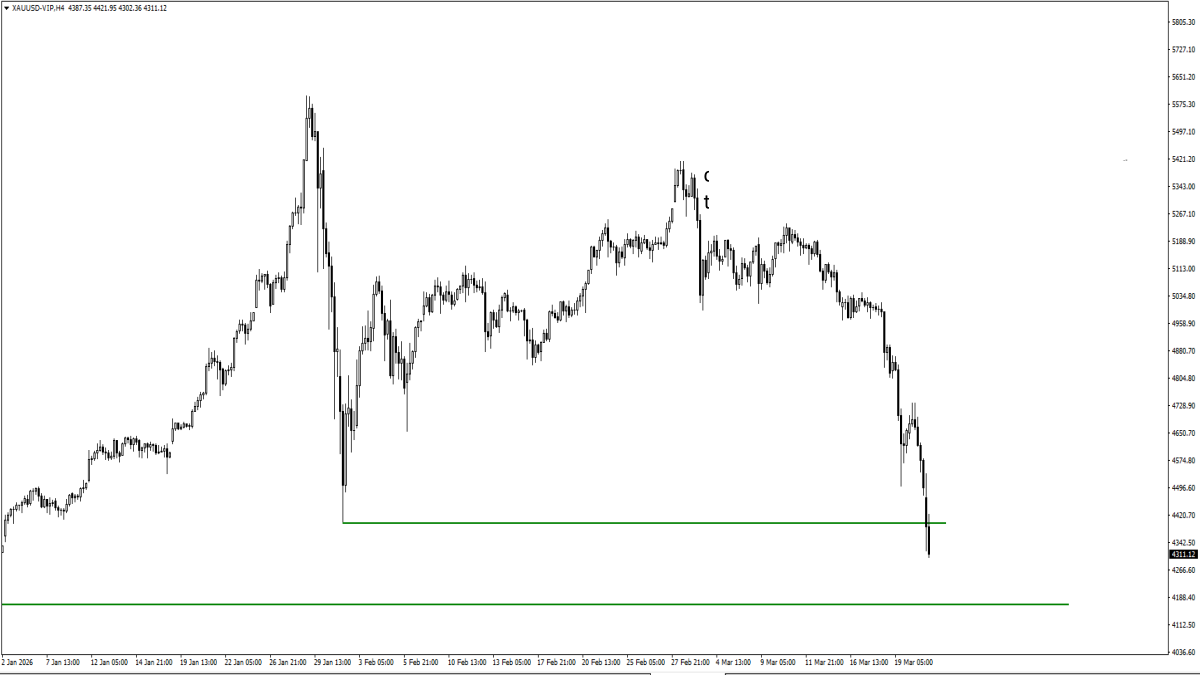
XAUUSD
Watch this week
Current support reaction after the break of 4402.73.
A break below 4169 would open another lower leg.
Stabilisation could produce a temporary consolidation phase.
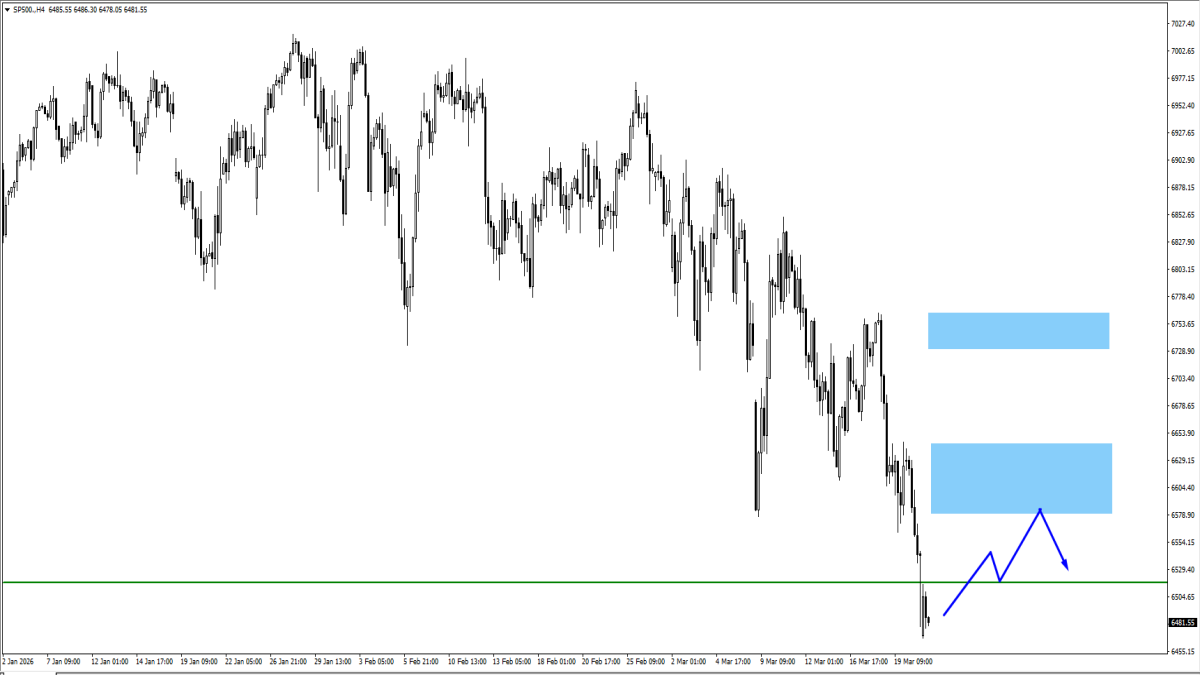
SP500
Watch this week
Breakdown below 6517.
Bearish rebound zones at 6600 and 6750.
A weak recovery structure would fit the Fed/oil risk narrative.
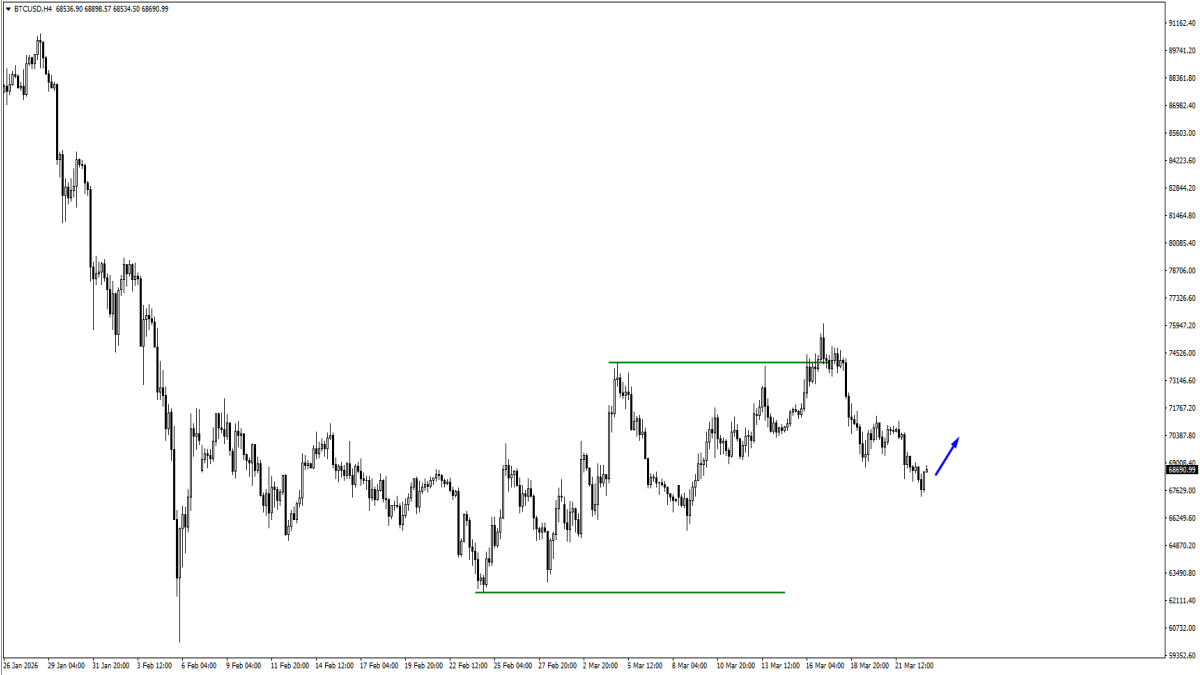
BTCUSD
Watch this week
Rebound focus toward 70550.
Rejection there would keep the structure fragile.
Strong acceptance would suggest broader risk appetite is stabilising.
Bottom Line
For this week, the key market theme is simple: the dot plot may still look orderly on the surface, but the logic underneath it is starting to crack.
The March 2026 FOMC was not a clear dovish pause. It was a pause carrying a more hawkish internal shift.
The dot plot still shows one cut, but the market is beginning to question whether that guidance can withstand higher inflation, war-driven energy risk, and a still-optimistic growth forecast. That tension is what matters most this week.
If the charts continue to confirm stronger oil, a firmer dollar, and weaker risk appetite, the market may conclude that the Fed’s latest roadmap is already losing credibility.
Why does this report say the Fed’s dot plot looks less credible now? Because the Fed is projecting higher inflation at 2.7% and stronger 2026 growth at 2.4%, while still leaving room for a rate cut. Under normal macro logic, firmer growth and firmer inflation usually support holding rates steady or staying tighter for longer, not easing.
Why is oil such an important driver for markets this week? Oil is the clearest link between geopolitics and inflation. If the Iran conflict keeps supply risk elevated, especially around the Strait of Hormuz, higher oil prices can push inflation expectations up again. That would make it harder for the Fed to justify cutting rates and could pressure equities while supporting the US dollar.
Why are USDX, gold and equities being watched together? They help reveal how markets are interpreting the same macro story. A stronger USDX suggests tighter financial conditions or reduced rate-cut expectations, gold reflects both safe-haven demand and dollar pressure, and equities show whether investors are becoming less comfortable with the growth and policy outlook.
South Korea’s Producer Price Index rose by 0.6% month on month in February.
The 0.6% monthly rise in South Korea’s producer prices for February is a clear signal of persistent inflation. This unexpectedly strong data suggests that cost pressures are building for manufacturers before they even reach consumers. We should anticipate the Bank of Korea (BOK) will have to delay any potential interest rate cuts that were being priced in for the second half of the year.
Implications For Consumer Inflation
This PPI reading is especially concerning when viewed alongside recent global trends, as Brent crude futures have been trading consistently above $95 a barrel. Recent trade data also showed import costs for raw materials grew by over 4% last month. This combination of external and internal pressures makes a near-term rise in the consumer price index highly likely.
For currency traders, this strengthens the case for a stronger Korean won. As the BOK is now more likely to hold its policy rate steady, the interest rate differential with nations signaling rate cuts could widen. We should consider long KRW positions against the US dollar, possibly through call options or futures contracts.
For equities, the outlook becomes more cautious, as sustained high interest rates act as a drag on corporate earnings and valuations. This environment is particularly challenging for the growth-oriented tech sector, which is a large component of the KOSPI 200 index. We could see value in buying put options on the index to hedge against a potential downturn.
This situation is a sharp reversal from the sentiment we saw throughout much of 2025. Back then, the market narrative was dominated by easing inflation and the expectation of BOK rate cuts beginning this spring. This new data forces a significant repricing of those expectations and suggests interest rate swaps are now under-valuing the potential for higher rates for longer.
South Korea’s Producer Price Index (PPI) rose by 2.4% year on year in February.
This was up from 1.9% year on year in the previous period.
Rising Factory Gate Inflation
This jump in South Korea’s producer prices to 2.4% is a clear signal of building inflationary pressure at the factory gate. It puts the Bank of Korea in a difficult position, making a hawkish stance more likely in their upcoming April meeting. We should anticipate the market pricing out any remaining expectations for a rate cut this year.
This PPI increase is largely driven by a recent 12% quarterly surge in global oil prices, which now average $92 a barrel. We’re already seeing this pass-through effect, as the latest consumer price index just came in at 3.1%, ticking above the central bank’s own forecast. This data makes it harder for policymakers to ignore the inflation threat.
For currency traders, this strengthens the case for a stronger Korean Won as higher interest rate expectations attract capital. We should consider positioning for a lower USD/KRW exchange rate, perhaps through buying KRW call options or selling USD/KRW futures. The won has been weak, depreciating nearly 3% against the dollar since January, creating a potential entry point for a reversal.
This is a significant shift from the sentiment we saw through most of 2025, when the Bank of Korea held rates steady amid what appeared to be cooling inflation. We remember the market had started to price in a dovish pivot toward the end of last year. This new data will force a major repricing of risk across asset classes.
Equity Market Risks Ahead
On the equity side, this development is a headwind for the KOSPI index, as higher potential borrowing costs could squeeze corporate profit margins. This is especially true for the semiconductor and manufacturing sectors that are sensitive to both financing costs and global demand. We see value in buying put options on the KOSPI 200 for downside protection or to speculate on a near-term correction.
Create your live VT Markets account and start trading now.
Start trading now – Click here to create your real VT Markets account
USD/JPY fell about 0.67% on Monday and traded near 158.06. The move followed a five-day delay of attacks on Iran and US comments about “very productive” talks with Tehran.
The pair had a bullish bias on Friday, but Monday’s drop shifted focus to support near 156.46, the March 5 swing low. The Relative Strength Index is falling and is close to the 50 neutral level.
Bearish Technical Setup
A daily close below the 20-day SMA at 157.91 would create a bearish engulfing pattern. That would put 157.50 in view, then 157.00, and the 100-day SMA at 156.16.
If 156.16 gives way, the next level noted is 153.99, the February 23 daily low. On the other side, a move back above 159.00 would open the way to 160.00.
We remember the struggle traders had back in 2025 when defending the 159.00 level was the primary focus for bears. That period’s temporary Yen strength, driven by geopolitical headlines, now looks like a minor pullback in a much larger trend. Today, those price levels serve as a distant floor rather than a ceiling.
The fundamental gap between the US and Japan has only widened since then. As of March 2026, recent US inflation data for February came in at a stubborn 3.4%, keeping the Federal Reserve from signaling any imminent rate cuts. This is happening while the Bank of Japan remains hesitant to aggressively tighten its own policy, maintaining a significant interest rate differential.
Options Positioning
For derivative traders, this environment screams of rising volatility as we approach new highs not seen in decades. Verbal intervention from Japanese finance officials has intensified now that we are trading north of 162.00, making long straddles or strangles an appealing strategy. These positions can profit from a sharp move in either direction, whether it’s a surge higher or a rapid drop caused by official action.
Looking back at the price action in 2025, we saw how every significant dip was eventually bought by those playing the longer-term trend. Traders might consider selling out-of-the-money puts with expirations in the next few weeks, targeting strike prices around the 160.00 psychological level. This strategy collects premium based on the belief that underlying dollar strength will provide a strong support zone on any pullbacks.
The primary risk remains a sudden, direct intervention by the Bank of Japan, an event we haven’t witnessed since late 2024. To manage this, purchasing cheap, short-term put options far below the current market price can act as a form of insurance. This allows for participation in the upside while providing a safety net against a sudden, sharp reversal.
Create your live VT Markets account and start trading now.
Start trading now – Click here to create your real VT Markets account
Gold recovered from a three-month low after falling nearly 3% to $4,098, near the 200-day SMA. Prices later moved towards about $4,370 after US President Donald Trump delayed strikes on Iran.
Sentiment improved after Trump described US-Iran talks as “very good and productive”, though Iranian media disputed this. Axios reported that Turkey, Egypt and Pakistan met US envoy Steve Witkoff, and that Iranian Foreign Minister Abbas Araghchi was also involved in separate discussions.
Market Reaction Across Assets
Oil dropped about 10% to a one-week low, while Wall Street opened higher. The US Dollar Index fell 0.18%, then rebounded from 98.88 to 99.32, still below its opening level.
US 10-year Treasury yields fell nearly 4.5 basis points to 4.34%. IEA Director Fatih Birol said the Middle East crisis has had a worse impact on energy prices than the two oil shocks of the 1970s combined, and the effects of the Russia-Ukraine war on gas markets.
Chicago Fed President Austan Goolsbee said rate cuts may come by end-2026 if inflation improves, while calling inflation a risk. Fed Governor Stephen Miran said it is too soon to judge the inflation effect, and supported cuts to support the labour market.
Last week the Fed, BoJ, BoE and ECB kept rates unchanged. Markets do not expect a Fed cut this year; ECB hike odds are near 64% for 30 April and 74% for June, with nearly 35 basis points priced.
Technically, resistance sits at $4,500, then the 100-day SMA at $4,586, and $4,736. Support is at $4,400, then $4,200, and the 200-day SMA at $4,071.
Options Strategy Considerations
We remember the sharp reversal in 2025 when tensions with Iran saw gold collapse to near its 200-day moving average before rebounding sharply on de-escalation news. This playbook shows that headline-driven moves create significant volatility, making long-term positions risky without protection. Currently, the CBOE Volatility Index (VIX) is hovering around a relatively low 14, suggesting the market may be underpricing the risk of a similar sudden event.
Given that experience, we should consider using options to trade the current environment. Buying put options on gold futures can serve as cheap insurance against a sudden risk-off plunge like the one we saw last year. A long straddle, buying both a call and a put, could also be a viable strategy to profit from a large price swing in either direction, regardless of the trigger.
The dovish tone from Fed officials back then, which pushed Treasury yields down, is a key parallel to today’s market. We see the 10-year Treasury yield currently sitting around 4.25%, and Fed funds futures are pricing in a 70% chance of at least two rate cuts by the end of this year. This underlying support for non-yielding assets like gold suggests any dip caused by a temporary de-escalation could be a buying opportunity.
We must also remember how crude oil fell by 10% during that episode, weighing on the US dollar. With WTI crude currently stable above $80 a barrel, any similar peace dividend could trigger a sharp sell-off, impacting energy stocks and dollar-denominated assets. This correlation means derivative plays on the energy sector or currency futures could be used to hedge gold positions.
Looking back, the formation of a hammer candlestick just above the 200-day SMA at $4,071 signaled a powerful reversal. Today, with gold trading much higher, we see major support near the 100-day SMA around $4,750. A sudden risk-off event could see a quick test of that level, while a break above the recent high of $4,850 would signal further strength.
Create your live VT Markets account and start trading now.
Start trading now – Click here to create your real VT Markets account