Start trading now – Click here to create your real VT Markets account
Back
Start trading now – Click here to create your real VT Markets account
Start trading now – Click here to create your real VT Markets account
Start trading now – Click here to create your real VT Markets account

Key Points
US natural gas futures eased to around $2.98 per MMBtu on Friday, trimming the prior session’s gains. Even with the dip, the market still holds onto a weekly gain of more than 4%, which tells you traders have not fully let go of the risk premium tied to the Middle East conflict and LNG supply concerns.
This is a two-speed market. US gas trades on domestic storage and weather, but global LNG stress can still lift sentiment through headline risk and global price signals. That mix often produces choppy sessions where price falls on policy headlines, then stabilises as supply fears return.
If the news flow stays tense and storage remains tight versus expectations, the weekly bid can persist even if daily pullbacks continue. If traders gain confidence that supply routes and LNG operations normalise, the market may give back part of the weekly gain as it refocuses on domestic fundamentals.
The Trump administration said it is considering measures to combat rising energy prices tied to the conflict. Traders read that as a near-term cap on runaway energy moves, especially if the US uses financial, logistical, or security levers to reduce shipping and insurance friction in key routes.
Even so, policy tools often work best on oil and shipping bottlenecks first. Natural gas can still hold firm if LNG supply looks constrained, because the market worries about replacement cargoes and regional shortages, even when US domestic gas cannot immediately fill the gap.
If Washington announces practical measures that reduce shipping risk quickly, gas may stay range-bound and struggle to extend gains. If measures land slowly, or markets doubt execution, the risk premium can linger.
The market keeps circling back to Qatar. Uncertainty around restoring full operations at QatarEnergy’s Ras Laffan plant, the world’s largest LNG export hub, has kept supply fears elevated, especially with the Strait of Hormuz closed. Reuters reporting points to a restart that may take at least two weeks, then at least another two weeks to reach full capacity once liquefaction restarts.
This matters because LNG is a timing game. Even a short shutdown can tighten prompt cargo availability, lift freight rates, and force buyers to compete for alternatives. The longer the outage lasts, the more it can ripple into European and Asian pricing, which can then feed back into global energy risk sentiment.
If Ras Laffan restarts along the early timeline and Hormuz reopens, LNG panic may cool and remove a layer of support under US gas. If the closure drags on and restarts slip, traders may keep pricing higher volatility and stronger support levels even if US supply remains ample.
Domestic fundamentals still matter most for US pricing. A bigger-than-expected storage withdrawal has supported prices, and warmer weather forecasts have also pointed to demand surprises in the near term. The EIA reported a 132 billion cubic feet (bcf) withdrawal for the week ending February 27, which exceeded analyst expectations in Reuters reporting.
The market now has to balance two forces that often fight each other. Storage draws tighten the near-term cushion, but warmer forecasts can reduce heating demand and soften the next set of withdrawals. That tension often compresses follow-through and increases the odds of mean-reverting price action.
If fresh EIA reports keep printing draws near the high end of expectations, gas can stay supported even with warmer spells. If the weather turns decisively mild and withdrawals shrink fast, the market may drift lower as it prices a looser end-of-season balance.
Natural gas (NG) is trading near 3.15, down roughly 0.76%, as prices continue to stabilise after the sharp sell-off that followed the spike to 5.70 earlier in the year.
The daily chart shows that the explosive rally in January has fully retraced, with the market now entering a prolonged consolidation phase near the 3.10–3.20 region.
Technically, the market is showing weak momentum. Price is hovering around the 10-day moving average (3.13) and slightly below the 20-day average (3.30), while the 30-day moving average (3.76) remains significantly higher and trending downward.
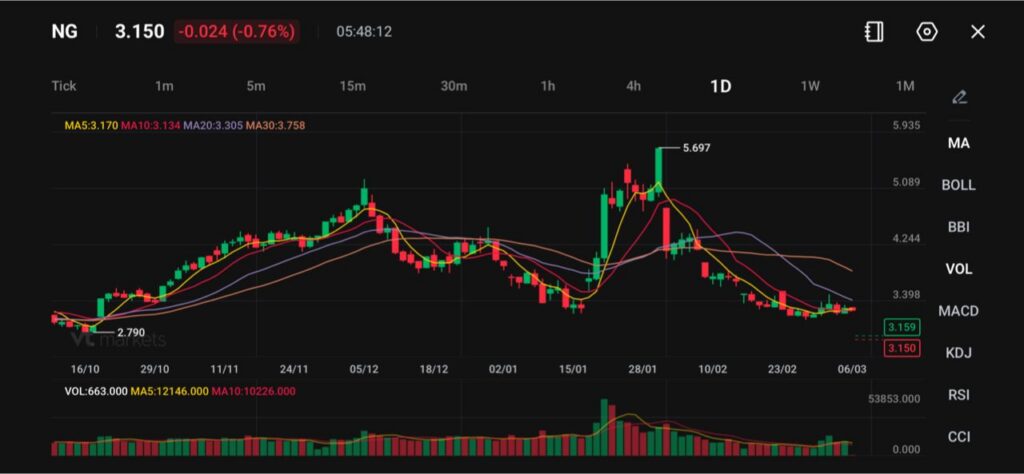
The 5-day moving average (3.17) is flattening, suggesting that bearish momentum may be fading but has not yet transitioned into a clear bullish reversal.
Immediate support sits around 3.00–3.10, a zone where prices have begun to stabilise following the February decline. A break below this level could expose further downside toward the 2.80–2.90 region, which previously acted as a base earlier in the trend.
On the upside, the first resistance area appears near 3.30–3.40, followed by stronger resistance around 3.70–3.80, where the 30-day moving average currently resides.
Overall, natural gas appears to be range-bound in the near term, with the market attempting to build a base after the sharp correction from the January peak. A sustained move above 3.40 would be needed to signal a potential recovery, while failure to hold above 3.00 could invite renewed selling pressure.
Watch for any concrete announcement from the administration on energy price measures, because it can shift sentiment quickly. Then track updates on Hormuz shipping risk and Ras Laffan restart timing, because those decide whether LNG stress fades or deepens.
Finally, keep the next EIA storage print in focus after the 132 bcf withdrawal, because another upside surprise can change the week’s tone even if the front month keeps wobbling around $2.98 per MMBtu.
Learn more about trading Energies on VT Markets here.
Start trading now – Click here to create your real VT Markets account
Start trading now – Click here to create your real VT Markets account
Start trading now – Click here to create your real VT Markets account
Start trading now – Click here to create your real VT Markets account
Start trading now – Click here to create your real VT Markets account
Start trading now – Click here to create your real VT Markets account
Start trading now – Click here to create your real VT Markets account
Hello there 👋
Hello there 👋
Scan the QR code with your smartphone to start a chat with us, or click here.
Don’t have the Telegram App or Desktop installed? Use Web Telegram instead.


