Back

USDJPY Stays Elevated, Dollar Wins Haven Bid

Key Points

  • The yen trades around 157.5 per dollar on Friday, set for a third consecutive weekly decline as the dollar stays firm.
  • The US-Israeli offensive against Iran has entered its seventh day, lifting energy anxiety and adding pressure on Japan as an energy importer.
  • USDJPY sits near 157.486 (-0.060, -0.04%), with price above key averages: MA5 157.419, MA10 156.620, MA20 155.341, MA30 155.235.

The yen trades around 157.5 per dollar on Friday and remains on track for its third consecutive weekly decline. The driver is simple: traders keep reaching for the reserve currency as the Middle East conflict escalates, and that flow supports the dollar against most majors.

When fear rises, traders often cut exposure to carry trades and rotate into USD cash and short-dated USD assets. That can keep USDJPY elevated even if the pair looks stretched, because safety flows can overpower short-term valuation concerns.

If the conflict headlines keep landing and risk appetite stays shaky, USDJPY can hold near the high-150s and probe higher on spikes in dollar demand. If headlines cool and markets regain confidence, USDJPY may slip back toward recent support zones, but it will likely do so in choppy steps.

Oil Prices Add a Second Headwind for the Yen

The conflict has entered its seventh day, and Tehran has launched a fresh wave of missile and drone strikes across the Gulf. That keeps energy markets nervous and helps hold oil risk premiums in place.

That matters for the yen because Japan relies heavily on energy imports. Higher oil prices can worsen Japan’s trade balance and lift imported inflation. This mix can weaken the yen even when global markets also call it a safe haven, because the import bill becomes a direct drag.

If oil stays bid and shipping risk remains high, the yen can stay under pressure, and USDJPY can remain supported. If oil eases and the energy premium fades, the yen can steady, but the market will still weigh the policy gap between the Fed and the BoJ.

BoJ Signals Patience as War Risks Cloud the Outlook

Bank of Japan Governor Kazuo Ueda warned the conflict could affect Japan’s economy, which strengthens the case for patience on rates. When policymakers face external shocks tied to energy costs and global growth, they often avoid sudden tightening that could hit domestic demand.

This matters for USDJPY because traders price the rate gap. If the Fed stays restrictive while the BoJ stays cautious, the gap can keep supporting USDJPY on dips.

If energy-driven uncertainty persists, the BoJ can lean towards a longer hold, which can leave the yen sensitive to any fresh leg higher in US yields. If inflation in Japan proves sticky and growth holds up, the BoJ may sound firmer later, but traders will likely wait for clearer action before they price a stronger yen trend.

Japan Keeps Intervention on the Table

Japan’s Finance Minister Satsuki Katayama said this week that currency market intervention remains an option, adding that authorities are monitoring the decline “with a strong sense of urgency” and coordinating closely with the US.

That language tends to change trader behaviour. It can reduce appetite for one-way momentum trades because the market knows officials can act if moves become disorderly. It does not force USDJPY down on its own, but it can cap upside follow-through during thin liquidity.

If USDJPY jumps quickly through fresh highs, intervention risk rises, and volatility can increase. If the pair grinds higher more slowly, officials may rely on warnings first, which can still cause sharp pullbacks when positioning gets crowded.

Technical Analysis

The USDJPY pair is trading near 157.49, holding close to the upper range of its recent recovery as the dollar maintains moderate strength against the yen. The pair has rebounded steadily from the late-January lows near 152, gradually rebuilding bullish momentum after the sharp correction from the 159.45 peak earlier this year.

From a technical perspective, price is currently trading above the key short-term moving averages, with the 5-day moving average at 157.42 and the 10-day at 156.62, both trending upward.

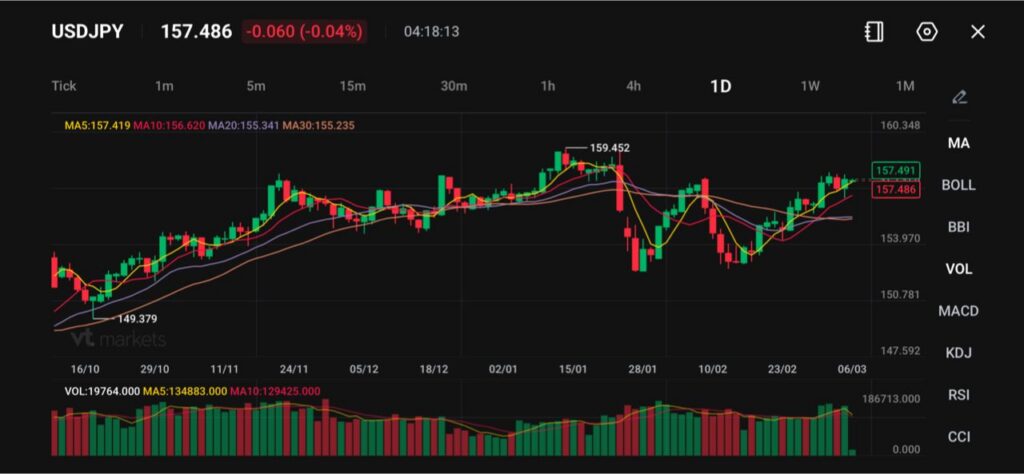
The 20-day (155.34) and 30-day (155.24) averages remain below the current price level, suggesting that the broader bullish structure is intact as the pair continues to form higher lows.

Immediate resistance is located around 158.50–159.45, where the previous rally topped out. A sustained move above this region could open the path toward the 160.00 psychological level.

On the downside, initial support is seen around 156.50–157.00, followed by stronger structural support near 155.00, which aligns closely with the 20-day and 30-day moving averages.

Overall, the technical outlook remains moderately bullish while USDJPY holds above the 155–156 support zone, though price may experience short-term consolidation as it approaches the upper boundary of its recent trading range.

What Traders Should Watch Next

  • Whether the conflict remains in escalation mode after day seven, because that drives both the dollar’s haven bid and oil risk.
  • Any shift in BoJ tone from Ueda as markets digest the economic hit from higher energy costs.
  • Intervention rhetoric from Katayama, especially if USDJPY accelerates rather than trends.
  • Price behaviour around 159.452 on the topside, and the moving-average zone around 156.620 to 155.341 on the downside.

Learn more about trading Forex Pairs on VT Markets here.

Frequently Asked Questions (FAQs)

  1. Why is USDJPY Weakening the Yen Despite Global Risk?
    In many crises, the yen strengthens as a safe-haven currency, but this time the dollar is attracting the bulk of defensive flows. Investors often move into the US Treasury markets and dollar liquidity during geopolitical stress. That dynamic keeps USDJPY near 157.5 per dollar even though global risk sentiment is fragile.
  2. How Do Rising Oil Prices Affect the Japanese Yen?
    Japan imports most of its energy. When oil prices rise sharply, the country spends more on imports, which can widen the trade deficit. A larger import bill tends to weaken the yen because more yen must be exchanged for foreign currency to pay for energy shipments.
  3. Why Does Monetary Policy Matter So Much for USDJPY?
    Currency markets often follow interest rate differentials. If US rates remain higher while the Bank of Japan keeps borrowing costs low, capital tends to move toward dollar assets. That gap can keep USDJPY elevated even if economic conditions in Japan remain stable.
  4. What does a “third consecutive weekly decline” for the Yen indicate?
    Three straight weeks of losses often signal sustained pressure rather than a single reaction to headlines. It suggests traders continue to favour the dollar and have not yet found a reason to rebuild large yen positions.
  5. Why Are Japanese Officials Talking About Currency Intervention?
    Authorities sometimes step in when exchange rate moves become rapid or disorderly. Finance Minister Satsuki Katayama said intervention remains an option and that officials are watching markets “with a strong sense of urgency”. Statements like this aim to slow speculation and remind traders that the government can act if volatility increases.

Start trading now – Click here to create your real VT Markets account

Ahead of NFP, the US dollar strengthens as soaring oil prices rise on Middle East conflict fears

The US Dollar firmed as crude oil rose to its highest level since July 2024, amid reports of possible disruption in the Strait of Hormuz and attacks on vessels. The US Dollar Index moved up to around 99.20 ahead of the US Nonfarm Payrolls release. US employment data showed 48.307K job cuts in February, down 55% from 108.435K in January, while initial jobless claims were 213K for the week ending 28 February, below the 215K estimate. EUR/USD traded near 1.1580 after ECB meeting accounts noted confidence on inflation but ongoing uncertainty, while markets priced a 75% chance of an ECB rate rise this year.

Market Snapshot

GBP/USD traded near 1.3330 and resumed a decline after a brief pause. AUD/USD fell to around 0.6990 as demand rose for perceived safe-haven assets. Gold traded at $5,066 and gave back earlier gains as the Dollar strengthened. The calendar included Germany factory orders, Eurozone employment change and GDP (Q4), US earnings, participation rate, Nonfarm Payrolls, retail sales, U6 rate and unemployment rate, plus Canada’s Ivey PMIs. Gold is commonly used as a store of value, a hedge against inflation, and protection against currency weakness. Central banks added 1,136 tonnes of gold worth about $70 billion in 2022, the largest annual purchase on record. A year ago, we saw a market dominated by a strong US Dollar, driven by geopolitical fears in the Middle East and a resilient American labor market. Oil prices were surging on fears of supply disruptions, pushing investors into the Greenback as the primary safe haven. This environment rewarded long-dollar positions and punished riskier currencies like the Australian Dollar. The narrative has shifted considerably over the last twelve months, as the US labor market is now showing signs of cooling. With the latest Nonfarm Payrolls report for February 2026 coming in at a modest 175,000 and the unemployment rate ticking up to 4.0%, the Federal Reserve has signaled a pivot towards potential rate cuts later this year. For derivative traders, this means the conviction behind long US Dollar call options has faded, and strategies like buying DXY puts could be used to position for further softening.

Trading Implications

The intense geopolitical risk premium in oil has also subsided since early 2025, with tensions in the Strait of Hormuz having de-escalated. Crude oil is now trading closer to $82 a barrel, driven more by OPEC+ supply management than by conflict, a significant change from the highs seen after July 2024. This suggests reduced volatility, making strategies like selling covered calls on oil futures attractive to generate income in what is now a more range-bound market. As the US Dollar has lost some of its appeal and with interest rate cuts on the horizon, Gold has reasserted its traditional safe-haven role. A year ago, we saw it struggle against the dollar even at $5,066; today it is finding support around $5,250 as it benefits from the lower-rate outlook. This environment makes buying Gold call options or futures contracts a compelling trade, especially as central banks globally continued to add to their reserves through the end of 2025, creating a steady source of demand. Looking at currency pairs, the dynamic for the Euro has changed from bets on ECB rate hikes to a focus on relative economic performance against the US. The AUD/USD, which fell sharply to 0.6990 amid the risk-off sentiment last year, has since recovered as fears receded and is now more sensitive to Chinese economic data. This suggests that the outright bearish positions of early 2025 are no longer viable, and traders may consider options strategies that profit from range-bound movements in EUR/USD or position for modest upside in the Aussie. Create your live VT Markets account and start trading now.

Start trading now – Click here to create your real VT Markets account

For the first time since mid-2024, WTI climbed beyond $80, after Thursday’s 6%-plus surge

WTI crude rose over 6% on Thursday and moved above $80 a barrel for the first time since June 2024. It is up about 19% since strikes in Iran began on Saturday, climbing from about $67 to just over $80. The surge followed reports that the Strait of Hormuz was closed after a joint US-Israeli operation. Iran’s IRGC said on Monday it would target vessels attempting to pass through, and tanker traffic fell to near zero.

Market Disruption And Supply Shock

At least five vessels were damaged and more than 150 ships were stranded outside the waterway. Maersk and Hapag-Lloyd halted transits, while drone strikes on QatarEnergy’s Ras Laffan and Mesaieed sites removed about one-fifth of global LNG export capacity. Iraq began shutting production as exports through the strait became constrained. OPEC+ agreed on Sunday to add 206,000 barrels per day in April, compared with a pre-crisis expectation of 137,000. Goldman Sachs said a temporary move to $100 per barrel could cut global growth by 0.4 percentage points. The US Nonfarm Payrolls report is due Friday, with a forecast near 60K. WTI traded at $79.78, above the rising 50-day and 200-day EMAs, with Stochastic overbought. Support sits near $74.50–$75.00, then $70.00–$71.00 and $67.00–$68.00; resistance is in the low-$80s, then the mid-$80s. We remember last year’s crisis, when the closure of the Strait of Hormuz sent WTI crude prices soaring 19% in just a few days. That event in 2025 showed how quickly geopolitical shocks can override fundamental supply and demand analysis. Traders should therefore remain highly sensitive to any new military posturing or diplomatic tensions in the Middle East.

Risk Management And Market Positioning

The extreme price volatility we saw in 2025, where the oil volatility index (OVX) likely spiked above 60, underscores the risk of holding unhedged futures positions. In the coming weeks, using options to define risk could be a prudent strategy, allowing for participation in upside moves while capping potential losses if a sudden reversal occurs. Buying calls or call spreads can offer exposure to another potential supply shock. The Strait of Hormuz remains a critical chokepoint, with roughly 21 million barrels of oil passing through it daily, representing over 20% of global petroleum liquids consumption. We should be monitoring tanker tracking data and naval reports from the region for any sign of disruption, as last year’s events proved this is the single largest catalyst for a sudden price spike. Any slowdown in traffic could immediately send prices higher, regardless of other market factors. Beyond immediate shocks, we must balance supply data with demand forecasts. OPEC+ has maintained its production discipline through early 2026, but the latest IMF World Economic Outlook projects global growth at a modest 2.9%, potentially capping long-term demand. Traders should weigh the cartel’s ability to constrain supply against the risk of a global economic slowdown. Looking at the charts, the price levels from the 2025 rally are now key psychological markers. The mid-$70s, which acted as a breakout point last year, have become a significant long-term support zone for the current uptrend. With WTI currently trading above both its 50-day and 200-day moving averages, the technical picture remains constructive for now. Finally, we must consider how energy prices influence wider economic policy, a lesson reinforced by last year’s inflation scare. With recent US Consumer Price Index data showing inflation still hovering around 3.1%, any new surge in oil prices could force central banks to delay expected rate cuts. This makes upcoming jobs and inflation reports critical, as they will shape the demand outlook for the rest of the year. Create your live VT Markets account and start trading now.

Start trading now – Click here to create your real VT Markets account

INGING’s Lynn Song says China set 2026 growth at 4.5–5.0%, accepting slower expansion while maintaining ambitions

China has set a 2026 GDP growth target of 4.5–5.0%, down from “around 5%” used for the past three years. The earlier wording was widely seen as implying 0.2–0.3 percentage points of flexibility around 5%. Fiscal and employment goals were kept broadly steady, alongside stable fiscal deficit and bond issuance targets. ING forecasts GDP growth of 4.6% year-on-year, which sits within the new official range.

National Target Reset

The government work report kept the aim of doubling per capita GDP by 2035 compared with 2020. Several provinces had already lowered their growth targets, which aligned with the national adjustment. Policy direction is expected to continue emphasising moving up the supply chain and improving technology self-reliance. A key uncertainty is whether domestic demand can be strengthened while confidence remains weak. The article states it was produced using an Artificial Intelligence tool and reviewed by an editor. China’s new GDP growth target of 4.5% to 5.0% signals a shift away from the more aggressive stimulus measures some traders were hoping for. This realistic target, coming after we saw official growth hit 5.2% in 2025, suggests upside for Chinese equity indices like the CSI 300 will be capped. Strategies that bet on a strong, stimulus-fueled rally should be reconsidered in favor of more cautious approaches.

Market Strategy Implications

The decision to avoid a major fiscal push means demand for industrial commodities will likely remain subdued. This is bearish for assets like iron ore and copper futures, which rely on large-scale infrastructure and property development. Given the ongoing weakness in China’s property sector, we believe selling call options on any commodity price rallies could be a prudent strategy. The biggest uncertainty remains domestic demand, as consumer confidence continues to be a drag on the economy. Recent data from the National Bureau of Statistics showed the consumer confidence index struggled to stay above the neutral 100-point mark through February. This tepid sentiment makes it difficult to expect a consumption-led recovery, which will weigh on consumer-facing stocks. For currency traders, this softer growth outlook could put gentle downward pressure on the Yuan. However, the People’s Bank of China will likely manage any depreciation carefully, as we observed throughout 2025, to avoid capital flight. This suggests a slow grind higher for USD/CNH, making it a market for patient traders rather than those seeking high volatility. The clearer but lower growth target may actually reduce overall market volatility by managing expectations. This environment favors strategies that profit from range-bound price action, such as selling strangles or straddles on equity index options. Big directional bets appear less favorable until we see a meaningful improvement in domestic confidence. Create your live VT Markets account and start trading now.

Start trading now – Click here to create your real VT Markets account

Venture Global has mostly traded below a descending trendline, repeatedly hitting this ceiling throughout its post-IPO history

Venture Global, Inc. has traded below a falling trendline since its IPO, with the line starting near the IPO high of about $24. The trendline has acted as resistance during past rebounds, and the share price is now testing it again after rising more than 9% today. A recent attempt to break above this trendline failed after an intraday move higher, followed by a close back below it. The current test also faces a nearby bearish daily candle just above the present price, which marks a recent rejection area. A breakout would require a daily close above both the trendline and the high of that bearish candle. If this does not happen and price is rejected again, a move back towards the $9–$10 range remains possible. We see that Venture Global is pushing against a major descending trendline that has defined its trading since the IPO high near $24. This line has stopped every major rally attempt so far. Today’s powerful surge brings us right back to this critical test of the long-term downtrend. This move isn’t happening in a vacuum, as recent data gives it fundamental support. The Energy Information Administration (EIA) confirmed in late February 2026 that U.S. LNG exports reached a new record, up 12% from the prior year. This underlying demand for LNG is likely fueling the buying pressure we are now seeing in the stock. For those looking at a bullish play, we believe buying April or May call options makes sense, but only after a confirmed daily close above that trendline and the recent rejection high. A break would structurally challenge the downtrend for the first time, and using options offers leverage on a potential sharp upward move. We must wait for the breakout to be validated by a closing price before committing. Conversely, if this level rejects the price again, it becomes an even stronger signal of weakness. We saw a similar failed breakout attempt back in late 2025 which quickly fizzled out and led to a retest of the lows. A failure here would prompt us to look at put options, targeting a move back towards the $9–$10 support zone. We should also be aware that implied volatility will be elevated as the stock resolves this battle at the trendline. This makes buying options more expensive, so traders might consider using spreads to lower the cost of entry. For example, a bull call spread could cap potential gains but would significantly reduce the upfront premium paid for the trade.

Start trading now – Click here to create your real VT Markets account

Notification of Server Upgrade – Mar 06 ,2026

Dear Client,

As part of our commitment to provide the most reliable service to our clients, there will be maintenance this weekend.

Notification of Server Upgrade

Please note that the following aspects might be affected during the maintenance:
1. The price quote and trading management will be temporarily disabled during the maintenance. You will not be able to open new positions, close open positions, or make any adjustments to the trades.
2. There might be a gap between the original price and the price after maintenance. The gaps between Pending Orders, Stop Loss, and Take Profit will be filled at the market price once the maintenance is completed. It is suggested that you manage the account properly.
3. Due to the Daylight Saving Time (DST) adjustment, the server time zone will change from GMT+2 to GMT+3 after the server reopens on 08 March at 14:00 (GMT+3).
4. During the maintenance period, VT Markets APP will not be available. It is recommended that you avoid using it during the maintenance.
5. During the maintenance period, VT Markets APP Copy Trading will not be available. It is recommended that you avoid this service during this period. All the other services on the VT APP remain normal.
6. During the maintenance hours, the Client portal will be unavailable, including managing trades, Deposit/Withdrawal and all the other functions will be limited.

The above data is for reference only. Please refer to the MT4/MT5 software for the specific maintenance completion and marketing opening time.

Thank you for your patience and understanding about this important initiative.

If you’d like more information, please don’t hesitate to contact [email protected]

After earnings, Broadcom remains central to AI semiconductors, beating forecasts and raising guidance, eyeing breakout

Broadcom Inc. reported results after the previous day’s close, beating EPS estimates by 0.93% and revenue by 0.28%. The share price rose by over 5% in early trading, then eased to about a 3% gain by mid-day. Price movement remains within a bull flag pattern that started with a sharp rally from the 4 February low pivot. Since that rise, the price has moved sideways to slightly lower, forming the flag section. A key level for a possible breakout is $338.43, which matches the declining trendline at the top of the flag. A daily close above $338.43 would indicate the consolidation may have ended and a new upward move may be starting. Support is centred on a “double floor” area beneath current prices. One layer is the 4 February low at $295.30, and another is the lower boundary of an upward channel that runs in parallel. A close below $295.30 would invalidate the bull flag setup. Current key levels are resistance at $338.43 and support at $295.30, with the trend described as near-term bullish with consolidation. The strong guidance fueled by AI demand is the key story for us right now. Broadcom is currently consolidating after a strong run, creating a classic bull flag pattern. This setup presents a clear opportunity for traders watching for the next major move. The critical level to watch is a daily close above $338.43. A decisive move through this resistance would be our signal to consider buying call options, likely with expirations in late April or May 2026 to capture the expected follow-through. We saw similar explosive moves in AI-related stocks back in late 2025 after consolidation periods, and recent data shows enterprise AI spending is projected to grow 35% quarter-over-quarter. Conversely, the “double floor” of support around $295.30 is our line in the sand. A break below this level would invalidate the bullish thesis, signaling a potential shift in the longer-term trend. This would be a trigger to look at buying put options, as a failure of such a strong pattern often leads to an accelerated move downwards. Given the volatility following the earnings announcement, implied volatility on AVGO options is likely elevated. This makes strategies like bull call spreads, where you buy a lower strike call and sell a higher strike one, attractive for the upside play as it lowers the cost of entry. We’ve seen options premiums on major tech names spike over 20% post-earnings this past year, making spread strategies a more capital-efficient approach. For those who believe a significant move is imminent but are unsure of the direction, the current tight consolidation is ideal for considering a long straddle. This involves buying both a call and a put option to profit from a large price swing beyond the premium paid. With the stock coiled between two such critical technical levels, the probability of a sharp, volatility-expanding move is increasing.

Start trading now – Click here to create your real VT Markets account

USD/CHF climbs 0.44%, rising above 0.7830 as SNB intervention talk limits franc strength recent recovery

USD/CHF rose 0.44% on Thursday to above 0.7830, extending a rebound from last week’s lows near 0.7700. Since early February it has ranged between a year-to-date low near 0.7600 and resistance around 0.7830. The Swiss National Bank issued an unsolicited statement on Monday, saying it was ready to act against fast Swiss Franc appreciation. Vice-President Antoine Martin repeated the message on Tuesday, linking safe-haven demand to the US-led conflict in Iran.

SnB Stance And Inflation Backdrop

Swiss February CPI data on Wednesday showed inflation near zero for a fifth straight month. The SNB policy rate is 0.00%, and markets expect foreign exchange intervention to be more likely than negative rates ahead of the 19 March decision. In the US, the Federal Reserve held rates at 3.50% to 3.75% in January, and minutes showed discussion of possible rises if inflation stays above target. February NFP consensus is about 60K after January’s 130K. USD/CHF was at 0.7826 on the daily chart, with the 50-day EMA near 0.78 and the 200-day EMA near 0.80. Support is around 0.7810 and 0.7760, with downside toward 0.7700, while resistance sits near 0.7860 and 0.7920. Looking back at the situation in early 2025, we recall the Swiss National Bank (SNB) was aggressively talking down the franc due to deflationary fears. The geopolitical tension from the US-Iran conflict was driving safe-haven flows into the franc, which the SNB was determined to counter. This created a floor for USD/CHF around the 0.7700 level.

Policy Divergence And Options Implications

The dynamic has since evolved, but the underlying theme remains. The SNB is still one of the most dovish central banks, and with Swiss inflation for February 2026 coming in at just 1.1%, they have no reason to change course. This contrasts sharply with the United States, where the Federal Reserve’s policy rate remains significantly higher despite some easing. This persistent policy divergence continues to favor the US dollar over the Swiss franc. The latest US Nonfarm Payrolls report showed a robust gain of 275,000 jobs, reinforcing the view of a resilient US economy. This fundamental backdrop suggests that any significant dips in USD/CHF are buying opportunities. Given this outlook, we see value in using options to express a bullish view on USD/CHF over the coming weeks. Buying call options with a strike price around 0.8300 offers a way to capture potential upside while strictly defining the maximum risk. This strategy is particularly effective if we see a sharp move higher driven by central bank commentary or strong US data. For a more conservative approach, we can implement a bull call spread. This could involve buying an April 0.8250 call and simultaneously selling an April 0.8400 call to finance the purchase. This trade profits from a gradual move higher in the pair and benefits from the low implied volatility that SNB intervention threats tend to create. The constant jawboning from the SNB has the effect of suppressing implied volatility in franc currency pairs. This makes buying options relatively inexpensive compared to historical levels. Traders should therefore favor strategies that are long premium, as the potential for a sudden policy-driven move offers an asymmetric reward profile. Create your live VT Markets account and start trading now.

Start trading now – Click here to create your real VT Markets account

DBS economist Radhika Rao reviews Fitch’s negative outlook on Indonesia’s BBB rating, echoing Moody’s action

Fitch Ratings changed Indonesia’s sovereign rating outlook to negative from stable while affirming the BBB rating, following a similar move by Moody’s. Fitch cited rising policy uncertainty and weakening consistency and credibility in the policy mix amid greater centralisation of policymaking authority. Fitch said an 8% growth target would need strong support through social welfare spending and fiscal-monetary easing. It warned that, without a matching rise in revenues, this could create risks to macro stability.

Fiscal Framework And Policy Credibility

Fitch also pointed to plans to revisit the fiscal framework via a review of the State Finance Law listed in the 2026 legislative priorities. It said this could weaken policy credibility and raise concerns about financing higher fiscal deficits. A negative outlook usually allows for possible further rating action within the next 18–24 months. The outlook change, alongside tensions in the Middle East, is expected to reduce the chance of a relief rally in onshore markets, keeping yields supported and the currency under pressure. Last year, we saw both Fitch and Moody’s cut Indonesia’s sovereign outlook to negative, citing policy uncertainty. Those concerns seem justified as the 10-year government bond yield has since climbed from around 6.7% to its current level of 7.4%. The Rupiah has also remained under pressure, weakening from 15,600 to over 16,100 against the dollar. For the coming weeks, this points towards maintaining positions that benefit from a weaker Rupiah. The ongoing legislative debates about the State Finance Law continue to fuel uncertainty, making USD/IDR non-deliverable forwards (NDFs) or call options a relevant strategy. This allows for profiting from further Rupiah depreciation while managing risk.

Rates And Volatility Positioning

Traders should also anticipate Indonesian government bond yields remaining elevated, if not pushing higher. With inflation ticking up towards 3.5%, Bank Indonesia is unlikely to ease monetary policy soon, supporting this view. This makes interest rate swaps, where one pays a fixed rate to receive a floating rate, an attractive hedge against rising financing costs. The persistent questions surrounding fiscal discipline and ambitious growth targets suggest higher implied volatility in both currency and rate markets. This environment makes options contracts potentially more valuable for hedging portfolios against sudden market swings. Traders might consider buying puts on bond futures to protect against a sharp rise in yields. Create your live VT Markets account and start trading now.

Start trading now – Click here to create your real VT Markets account

NZD falls amid rising US yields and escalating Middle East tensions, with NZD/USD nearing 200-day SMA, 0.5800

The New Zealand Dollar fell during Thursday’s North American session. NZD/USD traded at 0.588, down nearly 1%, while the US Dollar reached a two-day high as US Treasury yields rose and the Middle East conflict escalated. NZD/USD was slightly above the 200-day Simple Moving Average (SMA) at 0.5876. The pair has hovered near this level for the past two days.

Technical Levels And Key Support

A daily close below the 200-day SMA would point to a test of the 100-day SMA at 0.5817. If weakness continues, the next level is 0.5800, followed by the 19 January swing low of 0.5741. The Relative Strength Index (RSI) indicates bearish momentum. This keeps focus on whether NZD/USD ends the day below 0.5876. Looking back at our analysis from late 2025, we were watching the NZD/USD as it sank towards its 200-day Simple Moving Average. That technical break proved significant, as the pair did fall below the 0.5876 level and continued to drop toward 0.5800 over the following weeks. Traders who bought put options based on that daily close below the moving average were well-positioned for the subsequent decline. Now, in March 2026, we see a familiar fundamental pressure building, though the technical picture is different. The Reserve Bank of New Zealand is signaling a more dovish stance after recent data showed quarterly inflation has cooled to 2.9%, nearing the upper band of their target range. In contrast, the latest US Non-Farm Payrolls data showed a robust addition of 215,000 jobs, keeping the Federal Reserve from committing to rate cuts.

Strategy Considerations For Derivative Traders

This growing policy divergence suggests underlying weakness for the Kiwi dollar, mirroring the sentiment from late 2025. Derivative traders should consider building bearish positions, such as buying put options with strike prices around the 0.6050 level to capitalize on a potential downturn. This strategy offers a defined-risk approach to profit if the pair breaks below its current support levels in the coming weeks. Create your live VT Markets account and start trading now.

Start trading now – Click here to create your real VT Markets account

Back To Top
server

Hello there 👋

How can I help you?

Chat with our team instantly

Live Chat

Start a live conversation through...

  • Telegram
    hold On hold
  • Coming Soon...

Hello there 👋

How can I help you?

telegram

Scan the QR code with your smartphone to start a chat with us, or click here.

Don’t have the Telegram App or Desktop installed? Use Web Telegram instead.

QR code