Back

Can High-End Consumer Spending Hold Up in a Slower Economy?

Key Points

BRP sits in a unique position within the consumer discretionary sector. Its products are not essential, but they are aspirational, which makes the stock a useful signal of how confident consumers really are.

  • BRP is a premium discretionary brand, tied to leisure spending rather than necessity.
  • Higher interest rates are starting to pressure financing-driven demand.
  • The key question is whether higher-income consumers can sustain spending.

Consumer spending rarely weakens evenly. Instead, it fragments, with different income groups and categories adjusting at different speeds. This makes premium discretionary stocks particularly useful as indicators of underlying economic conditions.

Companies like BRP Inc. offer one view into this dynamic. Their products, including recreational vehicles and leisure equipment, are high-ticket purchases tied to lifestyle and confidence rather than necessity. Recent results, including quarterly revenue of C$2.46 billion, up 16% year on year, suggest that demand remains present, but the composition of that demand is shifting.

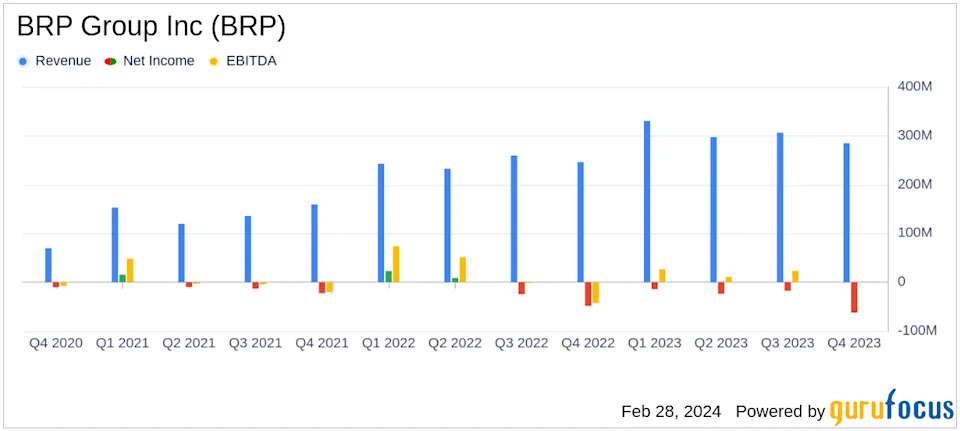
Source: Yahoo Finance

Rather than focusing on a single company, the more important question is broader. Can premium consumer spending as a whole remain resilient as financial conditions tighten?

Premium Spending is Not Uniform

The resilience of premium spending is often misunderstood. It does not mean that demand remains strong across all segments. It means that it behaves differently.

Higher-income consumers tend to be less sensitive to short-term economic pressure. Their spending is influenced more by long-term wealth and asset values than by immediate income constraints. This allows premium brands to hold up longer during slowdowns.

However, recent trends suggest that even this segment is beginning to show signs of adjustment. Companies like Diageo, a leader in premium spirits, have faced pressure as consumers become more selective, particularly in markets where discretionary budgets are tightening.

This creates a layered demand environment. Spending does not collapse, but it becomes more uneven, with some categories holding up better than others and growth becoming harder to sustain.

Interest Rates are Reshaping Discretionary Demand

Interest rates are one of the most important drivers of this shift. Higher borrowing costs reduce flexibility across the consumer base, particularly for high-ticket purchases that rely on financing.

In sectors such as recreational vehicles, the impact is direct. Higher monthly payments reduce affordability, lengthen purchase cycles, and lead to more cautious decision-making. In other areas, such as premium goods and lifestyle spending, the effect is more indirect but still meaningful.

Consumers respond by becoming more selective. Purchases are delayed, spending is prioritised, and discretionary budgets are reassessed. This does not eliminate demand, but it changes its timing and intensity.

For traders, this is where the signal becomes valuable. Rate-sensitive consumer stocks often move ahead of broader economic data, reflecting real-time shifts in behaviour.

As interest rate expectations evolve, traders often track these effects across a range of global equities. CFD Shares on the VT Markets platform provide access to companies exposed to these same macro forces.

From Pandemic Boom to Demand Normalisation

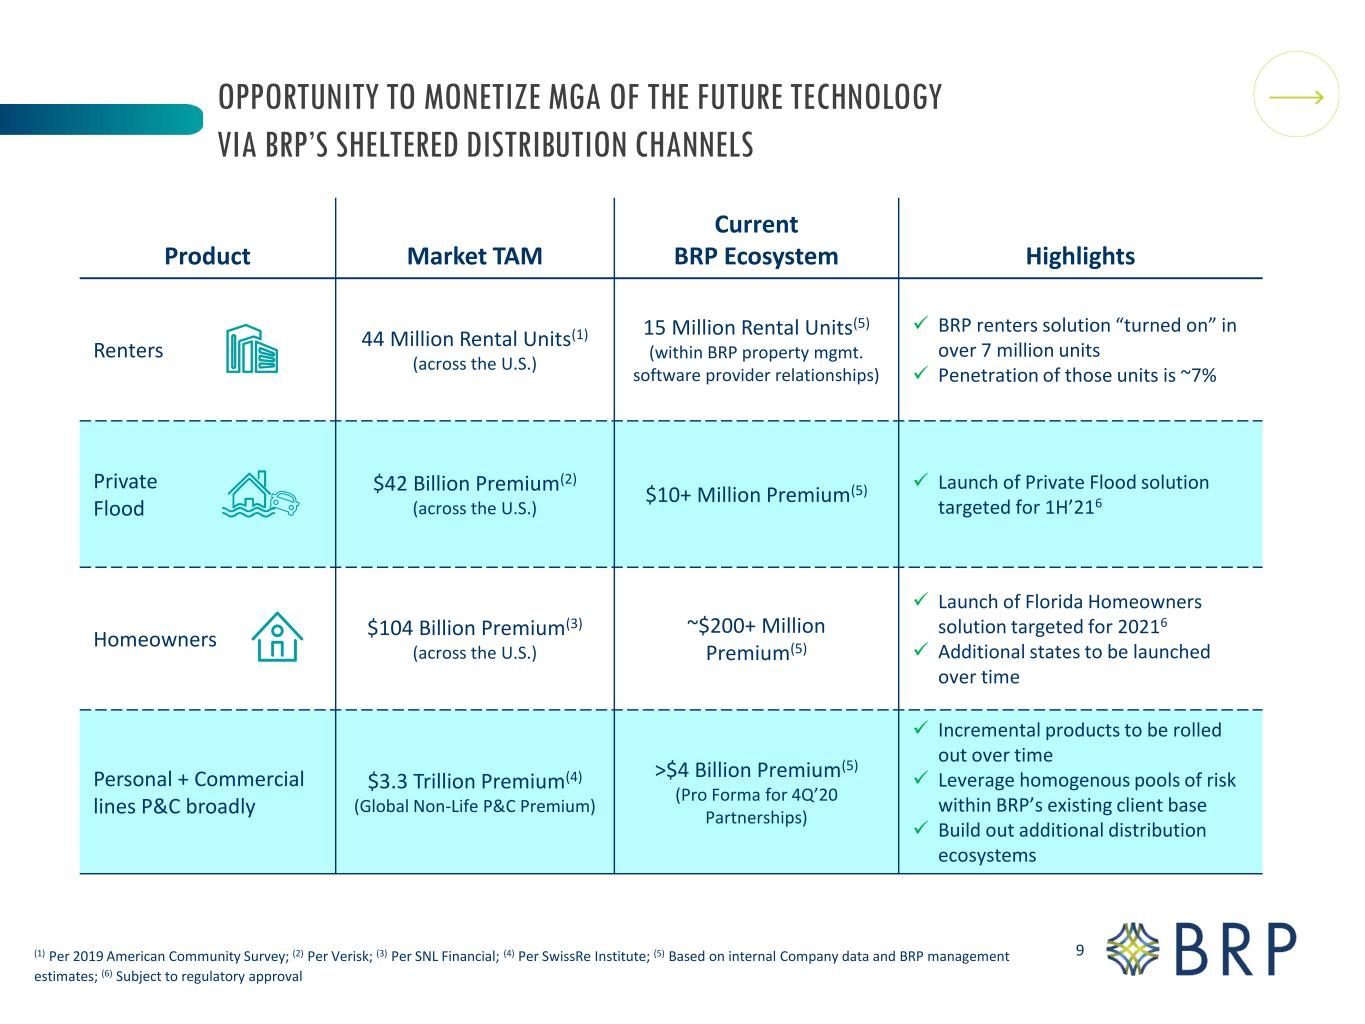
The current environment cannot be understood without considering the demand surge during the pandemic period. Between 2020 and 2022, consumers redirected spending toward goods, particularly those linked to outdoor and lifestyle activities.

Source: BRP

This created a powerful growth cycle across premium discretionary sectors. Companies benefited from elevated demand, strong pricing power, and accelerated customer acquisition.

That surge also pulled forward future demand. Many purchases that would have occurred later were brought forward, leaving a gap in subsequent periods.

Now, the market is adjusting. Growth is moderating, replacement cycles are extending, and new demand is entering at a slower pace. This is not necessarily a sign of weakness, but a transition toward more sustainable levels.

Similar patterns can be observed across sectors. From recreational products to premium consumer goods and even technology, many industries are now moving through a phase of recalibration following unusually strong growth, . Ttake Allbirds’ complete overhaul into AI this week.

Inventory, Pricing, and Margin Discipline

As demand normalises, the focus shifts to how companies manage the transition.

Inventory becomes a key indicator. When products take longer to sell, stock begins to build, creating pressure across the supply chain. This can eventually lead to discounting and margin compression if not managed carefully.

In the case of BRP, recent data suggests progress, with North American inventory declining by 17% year on year. This indicates that the company is working through excess supply while maintaining pricing discipline.

Source: U.S. Securities and Exchange Commission

The same principle applies across premium lifestyle sectors. Strong brands are better positioned to preserve margins, but they are not immune to pressure. The ability to manage inventory without aggressive discounting is often a key differentiator during this phase of the cycle.

Interest Rates Are a Key Pressure Point

Interest rates remain one of the most direct drivers of BRP’s performance. Because many purchases are financed, affordability is highly sensitive to changes in borrowing costs. Even modest increases in rates can significantly affect monthly payments, altering the total cost of ownership.

This creates a clear transmission mechanism into demand. As rates rise, financing becomes more expensive, approvals may tighten, and consumers become more cautious about committing to large purchases. These effects do not always appear immediately in revenue, but they can be observed in the operating environment.

Sales cycles tend to lengthen, dealer turnover slows, and inventory begins to build. Companies may respond with increased promotional activity or incentives to stimulate demand. In this way, BRP acts as a direct reflection of how monetary policy filters into real-world consumer decisions.

This is why rate-sensitive stocks like BRP are often watched alongside broader macro assets. Traders looking to position around interest rate shifts can also explore opportunities across global shares and indices through CFDs on the VT Markets app.

Wealth Effects and Diverging Consumers

One of the defining features of the current environment is divergence between consumer groups.

Higher-income consumers, who drive much of the demand for premium products, tend to remain more resilient. Their spending is influenced by asset values and long-term financial outlook rather than immediate income pressure.

At the same time, middle-income consumers face tighter conditions. Higher borrowing costs, reduced savings buffers, and rising living expenses all contribute to more cautious spending behaviour.

This creates a split dynamic within premium discretionary sectors. Demand may hold at the top end while weakening elsewhere, leading to changes in product mix and overall growth patterns.

For traders, this divergence helps explain why some premium stocks remain stable while others come under pressure. The underlying driver is not just income, but the distribution of financial resilience across the consumer base.

What Traders Should Watch

For traders, the key is to monitor how these figures evolve in relation to broader economic conditions. Unit sales trends provide a direct read on demand, while inventory levels offer early signals of slowing turnover. Pricing behaviour and promotional activity can indicate whether margins are under pressure, and interest rate trends remain central to understanding affordability. Consumer sentiment data adds an additional layer, helping to contextualise discretionary spending behaviour.

BRP often moves alongside consumer discretionary trends, and traders may track it in conjunction with broader retail and lifestyle sectors to gain a more complete picture of demand.

BRP often moves alongside consumer discretionary trends. Traders can explore opportunities across retail, lifestyle, and global consumer stocks through CFD Shares on VT Markets.

How Premium Lifestyle Stocks Fit Into a Broader Strategy

Premium discretionary stocks offer a targeted way to express views on consumer behaviour. They sit at the intersection of confidence, income, and financial conditions, making them particularly sensitive to changes in the economic environment.

This makes them useful in several ways. They can act as indicators of discretionary confidence, reflect the impact of interest rates on spending, and provide insight into how different consumer segments are adjusting to changing conditions.

They also offer a point of comparison with other sectors. While premium consumer stocks reflect spending behaviour, areas such as technology and AI often respond differently to the same macro drivers. Comparing these signals can help traders build a more complete view of the market.

Bottom Line

Premium lifestyle stocks are not immune to economic pressure, but they tend to adjust differently. Demand becomes more selective rather than disappearing, and resilience depends on both brand strength and the financial position of the consumer.

The current environment reflects a transition from exceptional demand to a more balanced phase. For traders, the key is understanding how this shift plays out across different sectors and consumer groups.

Create a live VT Markets account today to access our platform features, including market insights and educational content.

Trader Questions

What are premium lifestyle stocks?

Premium lifestyle stocks refer to companies that sell high-end discretionary products such as luxury goods, premium alcohol, and recreational equipment. Their performance is closely tied to consumer confidence and spending behaviour.

Why are premium brands affected by interest rates?

Higher interest rates increase borrowing costs and reduce disposable income, which can lead consumers to delay or reduce spending on non-essential purchases.

Do premium brands perform better in slow economies?

Premium brands often show more resilience because their customers tend to have higher incomes, but demand can still soften as economic pressure builds.

What stocks reflect discretionary spending trends?

Stocks in sectors such as luxury goods, premium alcohol, and lifestyle products, including companies like Diageo, often reflect broader consumer behaviour.

How can traders approach premium consumer stocks?

Traders often track a group of discretionary stocks rather than focusing on one company, using them to gauge broader trends in spending and economic conditions.

Start trading now – Click here to create your real VT Markets account

Middle East tensions push Rupiah to record low; USD/IDR nears 17,200, extending weekly gains in Asia

USD/IDR rose strongly in Friday’s Asian session and reached a record area of 17,185-17,190. The pair is set for strong weekly gains and remains biased higher.

The Indonesian rupiah weakened due to economic risks linked to the Middle East conflict. Indonesia is a net oil importer, so higher energy prices have raised import costs and subsidy bills.

Geopolitical Risks And Rupiah Pressure

Geopolitical tension also triggered capital outflows from Indonesia’s bond and equity markets into safe-haven assets, including the US dollar. This has supported the rise in USD/IDR over the past month.

The US Dollar Index (DXY) tried to extend its rebound from its lowest level since late February, amid uncertainty around the Strait of Hormuz. Separately, a 10-day truce between Israel and Lebanon lifted expectations of a potential US-Iran peace deal.

That backdrop supported risk appetite and, with lower expectations for a Federal Reserve rate rise, limited further US dollar strength. This may also cap USD/IDR upside in the near term.

We are seeing the USD/IDR exchange rate break through 17,180, a new all-time high that signals intense pressure on the Rupiah. For traders, this strong upward momentum suggests that buying USD/IDR call options could be a prudent move to capitalize on further expected weakness in the Rupiah. This situation feels very similar to the sharp depreciation we experienced in 2025 when the pair first crossed the 16,800 threshold.

Strategy Risks And Central Bank Watch

The primary driver is the high price of oil, which is a significant economic strain because Indonesia is a net importer. Data from last year showed our national oil and gas trade deficit exceeded $18 billion, making the Rupiah highly sensitive to sustained energy price shocks from geopolitical events. This fundamental weakness is a core reason to believe the current trend has room to run.

We are also witnessing significant capital flight from our domestic markets as global investors seek the safety of the US Dollar. The yield on Indonesia’s 10-year government bond has climbed above 7.8% this month, reflecting foreign investors selling off their holdings and converting the proceeds out of Rupiah. This outflow provides a steady stream of demand for US Dollars, pushing the exchange rate higher.

However, we must consider the factors that could limit this rally, including hopes for a de-escalation in the Middle East and the reduced likelihood of further US Federal Reserve rate hikes. This suggests that while going long on USD/IDR is the main strategy, traders might consider using bull call spreads. This would allow for profiting from a continued rise while capping potential losses if the rally suddenly stalls.

Finally, we have to anticipate potential intervention from Bank Indonesia (BI), which has historically stepped in to stabilize the currency. BI’s foreign exchange reserves have already declined by over $5 billion since the start of the year, a clear sign they are actively selling dollars to support the Rupiah. Any aggressive moves by the central bank could cause a sharp, albeit likely temporary, reversal in the USD/IDR pair.

Create your live VT Markets account and start trading now.

In Asia, EUR/USD hovers around 1.1777, awaiting US-Iran talks, needing 1.1825 for renewed gains

EUR/USD traded near 1.1777 in Asian trading on Friday and moved sideways after a two-week rise to about 1.1825. Markets were watching for news on a further round of US-Iran talks.

S&P 500 futures were flat in Asia after gaining 0.26% to 7,041 on Thursday. The US Dollar Index was slightly higher near 98.25, though it was on track for a second weekly fall.

Us Iran Talks In Focus

No timetable was given for the next talks, but President Donald Trump said Iran was ready to hand over its uranium enrichment. He also said the US was “very close to a deal” and warned military action could resume if there is no deal.

In Europe, ECB policymaker François Villeroy de Galhau said talk of an April rate rise was premature. The ECB policy meeting is due on April 30.

Technically, the pair stayed above the 20-day EMA at 1.1673 after rebounding from the mid-1.15s. The 14-day RSI was near 62.

Support sits at 1.1673, with further support in the mid-1.15 area if it breaks. Resistance is at 1.1825, then 1.1929.

One Year Market Shift

We see that this time last year, the focus was on a potential bullish breakout for EUR/USD above 1.1825. At that point in April 2025, the pair was consolidating near 1.1777 after a strong rally. Today, the landscape has completely shifted, with the pair trading much lower at 1.1150, a drop of over 5% in the last twelve months.

The dovish ECB stance mentioned by Villeroy in 2025, where he pushed back on rate hike expectations, has fully materialized and intensified. We have since seen the ECB cut its deposit facility rate, most recently in February 2026 to 3.50%, as inflation remains stubbornly below target at 1.8%. This policy divergence with the US Federal Reserve continues to weigh heavily on the euro.

Geopolitical factors have also reversed, as the optimistic US-Iran talks from last year under the previous administration failed to produce a lasting deal. The focus has since shifted, and renewed tensions have contributed to a risk-off sentiment that benefits the US dollar. Consequently, the Dollar Index (DXY) has climbed from 98.25 last April to around 104.50 today, buoyed by persistent US inflation figures hovering at 3.2%.

Given the current environment, holding long positions seems risky, and the pair’s failure to rebound suggests selling into any strength. For options traders, this muted volatility and downward drift could make strategies like selling out-of-the-money call spreads attractive, capitalizing on the pair’s inability to break key resistance levels. This approach allows for premium collection while defining risk, a prudent strategy in this market.

Create your live VT Markets account and start trading now.

During Asian trading, USD/CAD hovers near 1.3700; rising oil prices lend support to Canada’s dollar

USD/CAD stayed muted for a fifth day and traded near 1.3700 in Asian hours on Friday. The pair edged lower as the Canadian Dollar firmed with a small rise in oil prices, as Canada is the largest crude exporter to the US.

WTI crude held near $90.00 per barrel at the time of writing. Prices were supported by supply concerns linked to market caution around US-Iran ceasefire talks.

Ceasefire Developments In The Middle East

CNN reported on Friday that the Lebanese army recorded multiple ceasefire violations by Israel after a truce began. Lebanon said intermittent shelling hit villages in southern Lebanon, and the army told citizens to delay returning to southern towns and villages.

US President Donald Trump said on Thursday he spoke with Lebanese President Joseph Aoun and Israeli Prime Minister Benjamin Netanyahu. He said Israel and Lebanon agreed to a 10-day ceasefire that began at 5 PM ET.

Falls in USD/CAD were limited as the US Dollar Index (DXY) found support from higher safe-haven demand. Markets were cautious ahead of a US-Iran meeting due this weekend.

Washington and Tehran are expected to resume talks over the weekend. Trump said he was optimistic a permanent ceasefire could be reached before it expires next week.

Trading Implications For Usdcad

With USD/CAD currently trading around 1.3650, the market feels familiar. The Canadian dollar is finding support from West Texas Intermediate crude oil prices, which have remained firm above $85 per barrel throughout April 2026. This strength in oil, driven by tight OPEC+ supply discipline and persistent global demand, is putting a cap on how high the currency pair can go.

This situation reminds us of the dynamic we saw back in 2025, when geopolitical tensions surrounding US-Iran talks and an Israel-Lebanon ceasefire pushed oil toward $90. Back then, the commodity’s strength was countered by a rush into the US Dollar as a safe haven. The lesson was that geopolitical risk in the Middle East creates a two-way pull on this pair, often leading to volatility rather than a clear trend.

For traders, this suggests that outright directional bets are risky in the coming weeks. Instead, options strategies that benefit from price swings, such as buying straddles or strangles, could be more effective. Implied volatility on USD/CAD options has already ticked up by 5% this month, indicating the market is pricing in the potential for a larger-than-usual move.

We must also factor in the persistent interest rate differential between the US Federal Reserve and the Bank of Canada. The Fed’s commitment to holding its policy rate has kept a roughly 50-basis-point premium over Canadian rates, which continues to attract capital to the US Dollar. This fundamental support is preventing any significant breakdown in the USD/CAD pair, despite strong oil prices.

Therefore, traders should be prepared for the pair to remain in its current range but with sharp, headline-driven spikes. Using options to hedge existing positions seems prudent, such as buying puts to protect long Canadian dollar exposure from a sudden flare-up in risk aversion. This allows participation in CAD strength from oil while defining the downside risk from a stronger US Dollar.

Create your live VT Markets account and start trading now.

China’s central bank fixed the dollar-yuan midpoint at 6.8622, above 6.8616 prior and 6.8206 forecast

The People’s Bank of China (PBoC) set the USD/CNY central rate on Friday at 6.8622. This compared with the previous day’s fix of 6.8616 and a Reuters estimate of 6.8206.

The PBoC’s main aims are to keep prices stable, including exchange rate stability, and support economic growth. It also works on financial reforms, such as opening and developing the financial market.

Pboc Governance And Leadership

The PBoC is owned by the state of the People’s Republic of China, so it is not an autonomous body. The Chinese Communist Party Committee Secretary, nominated by the Chairman of the State Council, has strong influence over management, and Pan Gongsheng holds both roles.

The PBoC uses tools such as the seven-day reverse repo rate, the Medium-term Lending Facility, foreign exchange actions, and the reserve requirement ratio. The Loan Prime Rate is China’s benchmark rate and affects loan, mortgage, and savings rates, as well as the Renminbi exchange rate.

China has 19 private banks, a small share of the system. The largest are WeBank and MYbank, and private-funded domestic lenders have been allowed since 2014.

Today’s fixing of the yuan at 6.8622, notably weaker than the market’s 6.8206 estimate, is a clear signal from the People’s Bank of China. This action shows an official preference for a managed, weaker currency to support the economy. We should interpret this as a green light for further gradual depreciation in the coming weeks.

Market Implications And Strategy

This official guidance is consistent with recent economic data, as we saw first-quarter 2026 GDP growth come in at 4.8%, just below the government’s 5% target. Furthermore, March export figures showed a surprising 1.5% year-over-year decline, reinforcing the view that authorities will use the exchange rate as a tool to boost competitiveness. Therefore, a weaker yuan is not just a market trend but an active policy choice.

Looking back to early 2025, we recall a similar pattern where the PBOC consistently set weaker fixes whenever the yuan strengthened toward the 6.80 level. That historical resistance established a policy floor, which eventually paved the way for the currency’s slow grind toward the 7.30 range we are trading in today. This precedent confirms the central bank’s priority is economic stability over currency strength.

Given the PBOC’s control, we anticipate continued low volatility even as the yuan weakens. Implied volatility for USD/CNH options has already compressed to a six-month low of 4.2%, making outright long positions on the dollar expensive to hold. For the next few weeks, the more prudent strategy would be to sell out-of-the-money yuan call options, capitalizing on the gradual and controlled pace of depreciation managed by the state.

Create your live VT Markets account and start trading now.

WTI hovers near $89 in Asian trade as Lebanon alleges Israel breached their ceasefire agreement

WTI, the US crude oil benchmark, traded near $89.00 during Asian hours on Friday. The price edged up after Lebanon’s army accused Israel of breaching a ceasefire.

US President Donald Trump said on Thursday that Israel and Lebanon had agreed to a 10-day ceasefire. Lebanon’s army reported on Friday that it recorded multiple alleged violations by Israel after the truce began at midnight local time on Friday.

Trump also said the US and Iran are likely to meet over the weekend for a second round of negotiations. No official date has been set for the talks.

Ceasefire Developments And Market Impact

Trump said on Thursday that a permanent ceasefire could be reached before the current arrangement expires next week. Expectations of a two-week ceasefire extension could put downward pressure on WTI.

Bloomberg reported that several European and Gulf Arab leaders think it could take six months to negotiate a US-Iran deal.

The tensions we saw developing last year between Israel and Lebanon continue to put a floor under oil prices. With West Texas Intermediate now trading near $95 a barrel, up significantly from last year, the market is pricing in a persistent geopolitical risk premium. Any renewed sign of conflict could easily push prices back towards the $100 mark in the coming weeks.

Options Positioning And Demand Watch

We have seen how the stalled US-Iran negotiations, which were a point of focus in 2025, have contributed to this uncertainty. War risk insurance premiums for oil tankers passing through the Strait of Hormuz have risen 12% in the last quarter alone, reflecting the tangible cost of this instability. The latest CFTC data also shows large speculators have increased their net-long positions in WTI, suggesting they are betting on higher prices.

However, derivative traders should watch demand signals closely for any sign of weakness. While the latest EIA report showed a surprise crude oil inventory draw of 2.1 million barrels, gasoline stocks unexpectedly built up, hinting that high prices may be starting to curb consumer demand. This creates a volatile environment where prices could quickly reverse on negative economic data.

Given this backdrop, traders should consider buying near-term call options to profit from a potential price spike caused by a flare-up in the Middle East. For those looking for a more risk-defined strategy, bull call spreads could capture upside while limiting the initial cost. This allows traders to position for a rise in prices without taking on unlimited risk if demand worries suddenly take over.

Looking back at historical conflicts in the region, such as the initial price shocks during the Gulf Wars, we can see that the market often overreacts to headlines before settling. This suggests that while there is an opportunity for sharp gains, traders must be ready for significant volatility. Using options to define risk is therefore a prudent approach in the current environment.

Create your live VT Markets account and start trading now.

During the Asian session, XAG/USD edges 0.50% higher, consolidating near 50% Fibonacci, under $79.00 mark

Silver (XAG/USD) is consolidating near the 50% Fibonacci retracement of the March decline and is trading just below $79.00 in the Asian session on Friday. It is up 0.50% on the day and is set for a fourth weekly gain in a row.

The price is holding above the 200-period EMA, supporting a positive near-term bias despite recent rejections near $81.00. The RSI is near 57, while the MACD has moved back into negative territory.

Key Technical Levels

Resistance is at $80.00, followed by the weekly swing high near $81.00. A break above that area could target the 61.8% retracement at $83.16.

Support sits at the 200-period EMA at $77.01, then the 38.2% retracement at $74.82. Further downside levels are the 23.6% retracement at $69.67 and the cycle low area near $61.33.

We are seeing silver find its footing just under the $79.00 mark, which is a key retracement level from the March 2025 downturn. While indicators like the price holding above the 200-period EMA suggest a constructive bias, failures near the $81.00 level call for a measured approach. The conflicting signals from the RSI and MACD suggest that while the mood is positive, the upward momentum is waning.

For derivatives traders, this suggests a strategy of cautious optimism over the next few weeks. One could consider selling cash-secured puts with a strike price below the strong support at $77.00 to collect premium, banking on the price holding that floor. Another approach would be to buy call options with a strike price above the $81.00 resistance, positioning for a potential breakout toward the $83.00 level.

April 2026 Perspective

Looking back from today in April 2026, that consolidation period proved to be a significant accumulation zone before the subsequent rally. We can now see that silver prices are trading near $95, having been propelled by fundamental factors that were just beginning to take shape. For instance, the US Inflation Reduction Act of 2025, passed in the latter half of that year, significantly boosted subsidies for green energy projects.

That policy shift directly impacted silver’s industrial demand, which has been a primary driver of its price. The Silver Institute’s latest report for Q1 2026 confirmed a 12% year-over-year increase in demand from the photovoltaic sector alone. This industrial consumption, combined with persistent inflation that saw the March 2026 CPI print come in at 3.8%, has bolstered silver’s dual appeal.

The lesson from that period in 2025 was that technical support levels were critical to watch. The successful defense of the 200-period EMA near $77.00 provided the base for the rally that followed. Traders who used derivatives to define their risk below that level while maintaining bullish exposure were well-rewarded as fundamental drivers took control through the end of 2025 and into this year.

Create your live VT Markets account and start trading now.

UOB’s Ho Woei Chen reviews China’s 1Q26 5.0% GDP rise, keeping 2026 growth at 4.7% amid headwinds

China’s real GDP rose 5.0% year-on-year in 1Q26, at the top of the official 4.5%–5.0% target range. The 2026 growth forecast is kept at 4.7%, with an assumption of 4.6%–4.8% year-on-year growth over the next three quarters.

External risks cited include supply disruption, high oil prices, Middle East conflict, and US trade probes that could affect exports. Domestic conditions include weak demand and confidence, while local government finances are described as limiting the scope for support.

Growth Momentum And Investment Signals

Month-on-month growth remained positive, with gains of 1.68% in January, 0.99% in February, and 0.52% in March, following three months of contraction. Plans to raise high-tech investment are mentioned alongside uncertainty around the broader investment outlook.

Headline CPI for 2026 is forecast at 1.3%, below the official 2% target. Policy tools referenced include regulated refined oil prices and possible subsidies to help manage inflation pressures.

With activity resilient and inflation contained, near-term rate cuts are seen as less likely. A 10-basis-point policy rate cut is still projected, but the timing is shifted to 3Q26 from 2Q26, with more emphasis on targeted easing and structural measures.

Given the strong start to 2026, we see a potential trap for those who are overly bullish. While the 5.0% Q1 GDP growth is positive, underlying data like the March Producer Price Index (PPI), which remains deflationary at -2.5%, points to persistent weak domestic demand. This suggests any rallies in broad market indices like the FTSE China A50 may be short-lived and worth hedging with put options for the medium term.

Market Implications For Rates And Risk

The delay of an expected rate cut from the second quarter to the third is a significant shift traders must factor in. This removes a key catalyst for the market in the coming weeks, likely capping the upside on equity indices. We remember how in 2025, markets pulled back when anticipated stimulus from the People’s Bank of China was more measured than hoped for.

Heightened geopolitical risks from the Middle East are directly impacting oil prices, with Brent crude recently hovering near $95 a barrel. This external pressure creates uncertainty and increases volatility, which can be seen in the rising Hang Seng Volatility Index (VHSI). We believe strategies that profit from price swings, such as straddles on the Hang Seng China Enterprises Index, are becoming more attractive.

For currency traders, the postponed rate cut should provide short-term support for the yuan. The USD/CNH pair has remained in a tight range around 7.28, and without immediate easing from the PBOC, a significant breakout to the upside seems unlikely. Therefore, options strategies based on the currency remaining range-bound could be prudent.

The government’s focus on targeted support for high-tech sectors while overall consumer confidence lags suggests a two-speed economy. This warrants a more granular approach instead of broad market bets. Derivative plays could focus on call options for specific technology-related ETFs while considering puts on consumer discretionary sectors that are more exposed to weak domestic spending.

Create your live VT Markets account and start trading now.

Gold edges towards $4,800 as traders weigh inflation and potential progress in United States-Iran weekend talks

Gold (XAU/USD) edged up to about $4,795 in early Asian trading on Friday. Trading was shaped by easing geopolitical concerns and ongoing inflation pressures.

A 10-day ceasefire between Lebanon and Israel began on Thursday, according to Reuters. Israeli Prime Minister Benjamin Netanyahu said he agreed to the truce to support talks towards a peace agreement with Lebanon.

Middle East Diplomacy In Focus

The next meeting between the US and Iran may take place over the weekend. US President Donald Trump said the two countries were seeking an extended truce before it expires next week, with markets watching for updates.

A possible blockade of the Strait of Hormuz remains a key risk. Disruption to energy supplies could push oil prices higher, add to inflation, and reduce the likelihood of interest-rate cuts.

Gold can rise during geopolitical uncertainty, but it pays no interest and can be less appealing when rates stay high. Support may come from central bank demand, with China’s PBoC extending its buying streak to 18 consecutive months through March 2026.

With gold near $4,795, the immediate focus is on the weekend talks between the US and Iran. A successful outcome, building on the Israel-Lebanon ceasefire, could trigger a sharp pullback in prices as geopolitical risk premium evaporates. We are in a fragile situation where headlines will drive short-term market moves.

Inflation Rates And Options Positioning

Persistent inflation, with the last US CPI reading for March 2026 coming in higher than expected at 3.8%, complicates the picture. This makes it difficult for the Federal Reserve to pivot from its restrictive stance, keeping the Fed Funds Rate around 5.5% and creating a headwind for non-yielding gold. The high interest rate environment punishes holding gold for long periods.

Given the binary risk of the peace talks, traders should consider using options to define their risk. We remember the volatility spike in late 2025, and buying put options could be a prudent way to hedge against a sudden peace-driven price drop. The market is pricing in significant movement, with the VIX holding firm above 20.

Conversely, any failure in negotiations could see a rapid move higher, especially with the Strait of Hormuz still a major concern. A breakdown in talks could easily send gold to test new highs above $5,000 as capital seeks safety. Using call option spreads allows for capturing this potential upside while limiting the cost of entry, which is high due to current volatility.

We should not ignore the strong underlying support from central banks, as noted by the World Gold Council’s Q1 2026 report. The People’s Bank of China has now bought gold for 18 straight months, a trend followed by several other emerging market banks. This consistent demand provides a strong floor and suggests any deep price corrections may be short-lived.

Create your live VT Markets account and start trading now.

New Zealand’s monthly electronic card retail sales growth slowed to 0.7%, down from 1.4% previously

New Zealand’s electronic card retail sales rose 0.7% month on month in March. This was down from a 1.4% increase in the previous period.

The latest figure shows slower growth in electronic card retail spending compared with the month before. No further breakdown or causes were provided in the text.

Consumer Slowdown Signals

We are seeing clear evidence of a consumer slowdown in New Zealand with this new data. The drop in month-on-month electronic card sales growth from 1.4% to 0.7% signals that higher interest rates are beginning to bite into household spending. This is a significant deceleration and suggests weakening domestic demand heading into the second quarter.

This softening trend will likely push the Reserve Bank of New Zealand into a more dovish stance. With the Official Cash Rate holding at 5.50% since mid-2025, this data weakens any remaining case for further rate hikes. Derivative markets should now increase pricing for a potential rate cut by the end of 2026, making interest rate swaps and futures that bet on lower rates look more attractive.

For currency traders, this development puts downward pressure on the New Zealand dollar. The NZD/USD, which has struggled to hold above 0.6150 in recent weeks, could now test support near the 0.6000 level. We see an opportunity in buying NZD put options as a way to position for this expected weakness against the US dollar.

This spending data doesn’t exist in a vacuum, as it follows last week’s ANZ business confidence survey which showed a decline in firms’ own activity outlook. Looking back, we saw a similar pattern emerge in late 2024 when early signs of consumer weakness preceded a broader economic slowdown. This historical parallel reinforces our view that the current trend is likely to persist.

Broader Context And Outlook

Create your live VT Markets account and start trading now.

Back To Top
server

Hello there 👋

How can I help you?

Chat with our team instantly

Live Chat

Start a live conversation through...

  • Telegram
    hold On hold
  • Coming Soon...

Hello there 👋

How can I help you?

telegram

Scan the QR code with your smartphone to start a chat with us, or click here.

Don’t have the Telegram App or Desktop installed? Use Web Telegram instead.

QR code