Week Ahead: Ethereum Gains Ground From Regulatory Tailwinds

Ethereum doesn’t appear to be waiting for the next bull market to start making moves. While Bitcoin continues to dominate the headlines and capture the spotlight in terms of price action, the real transformation is unfolding quietly in the regulatory corridors of Washington. Three significant pieces of crypto legislation are making their way through the US Congress. They may be technical and hard to digest, but collectively, they could reshape Ethereum’s role in the global financial system.

The GENIUS Act, the CLARITY Act, and the Anti-CBDC Act might not sound thrilling, but together they could place Ethereum at the heart of the next regulated crypto era. And here’s the critical point: Ethereum stands to benefit more than any other blockchain, including Bitcoin.

GENIUS Act: Not Just Clever Branding

Let’s begin with the GENIUS Act, which is all about tidying up the stablecoin ecosystem. It would mandate full reserve backing, comprehensive audits, and improved user protections. While that may seem like regulatory red tape, for Ethereum, it’s a welcome boost.

The vast majority of stablecoins, such as USDC, USDT, and PYUSD, are built on Ethereum’s ERC-20 framework. These tokens depend on Ethereum for issuance, transactions, and network support. With legal clarity, institutions can finally participate without fear of regulatory pitfalls. And when they do, they’ll almost certainly utilise Ethereum’s infrastructure.

Bitcoin, for all its strengths, lacks the smart contract capabilities to host stablecoins at scale.

CLARITY Act: Ethereum Steps Out Of The Shadows

The CLARITY Act is arguably the most significant of the three. This proposed legislation would officially designate ETH as a commodity, placing it under the jurisdiction of the Commodity Futures Trading Commission (CFTC), rather than the Securities and Exchange Commission (SEC).

This change matters. Ethereum’s legal status has remained uncertain, particularly following its transition to proof-of-stake. The SEC has long implied ETH could be classified as a security, causing unease among investors. The new law would erase that ambiguity, giving institutions the all-clear to get involved without fear of enforcement actions.

Bitcoin, for comparison, never faced this uncertainty. It has always been treated as a commodity. So while this act strengthens Bitcoin’s standing, it effectively liberates Ethereum from its regulatory limbo.

The Anti-CBDC Act: An Unexpected Win For Ethereum

The third bill, the Anti-CBDC Act, might seem unrelated at first glance. It essentially blocks the Federal Reserve from launching a central bank digital currency (CBDC), such as a digital dollar. But this is indirectly great news for Ethereum.

Why? Because it keeps the path open for private stablecoins to remain the dominant option for digital USD transactions. And since the bulk of these stablecoins reside on Ethereum, the network stands to gain further dominance.

Sure, networks like Solana, Tron, and Binance Smart Chain also support stablecoins. But Ethereum still offers the deepest liquidity, the most mature infrastructure, and the largest DeFi ecosystem by far.

Even when stablecoins bridge to other chains, their foundational layer and most significant liquidity pools tend to remain on Ethereum. Institutions also generally place greater trust in Ethereum’s decentralisation, longevity, and security. These are traits that become increasingly important in a regulated environment.

Ethereum’s Foundational Advantage

Markets are already beginning to take notice. ETH has outperformed BTC in several recent sessions, a trend that may continue as the regulatory momentum builds. That said, legislation alone doesn’t guarantee price gains. Traders will want to see actual adoption such as rising stablecoin volumes, new institutional products, or fresh innovation in decentralised finance.

And of course, these bills haven’t yet become law. Political delays, amendments, or resistance could disrupt the timeline.

Still, the groundwork is forming. Should the legislation pass, Ethereum would no longer be just a decentralised smart contract platform. It would become the regulatory backbone for US-based digital finance. It would process tokenised dollars, anchor compliant staking products, and support enterprise-grade DeFi.

This marks a sharp divergence from the traditional ETH-versus-BTC narrative. Bitcoin may remain the champion of digital gold, but Ethereum is fast becoming the infrastructure layer for everything else.

Strategically speaking, this positions ETH as an attractive candidate for medium-term accumulation. Traders focused on macro correlations should monitor stablecoin inflows, CFTC commentary, and total value locked in DeFi. If the regulatory doors swing wide open, the capital will flow in, and Ethereum will be waiting.

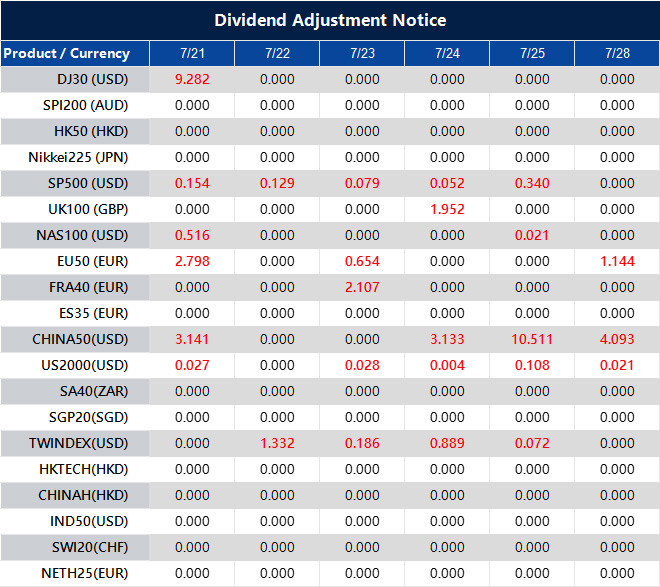
Market Movements Of The Week

The US Dollar Index (USDX) inched upwards from its 98.50 retracement zone. Resistance at 98.75 remains active, with targets around 99.85 and 100.15 emerging if momentum persists. The dollar’s strength now seems underpinned by structure, buoyed by soft eurozone PMIs and a resilient US economy. That said, a disappointing GDP or Core PCE print next week could halt this climb. Until then, the bias remains modestly bullish.

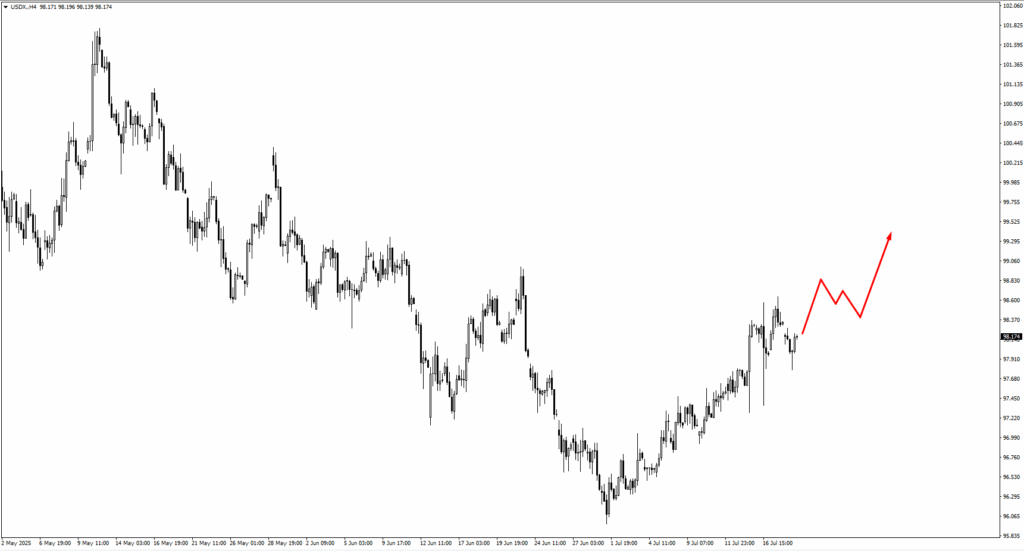
EURUSD reflected this narrative, softening toward the 1.1480 zone, a key area for bullish setups. With limited PMI optimism, euro strength looks shaky. If USD gains momentum into next week’s macro data, a clean break lower could expose the 1.14 region.

GBPUSD dropped below the 1.33645 swing low, now crawling towards the 1.3315 support. If the pair consolidates here, another leg down toward 1.3215 could follow. Traders should watch for bullish reversal patterns, but with Bailey due to speak and no major UK data releases, sterling might simply track broader dollar trends.

USDJPY edged toward 149.20, a crucial resistance point. Should this level break, bulls might aim for 149.95. However, the Bank of Japan’s upcoming policy statement will be decisive. A dovish stance could lift the pair, while any tightening hint may cause a sharp correction.

USDCHF retraced from 0.8050, yet another push toward 0.8115 remains possible. The pair appears to be waiting on a broader dollar breakout. Should USDX breach 99.85, CHF could weaken further.

AUDUSD and NZDUSD both slipped from their monitored zones, 0.6520 and 0.5985, respectively. For AUD, 0.6485 is the next key level to test. Should we see consolidation there, a deeper move lower could unfold. Likewise, NZDUSD is approaching 0.5930. These levels matter. Both currencies remain vulnerable to dollar strength and soft commodities, so risk-off sentiment or poor China data could drag them further.

USDCAD moved higher from 1.3715. If this rally continues, 1.3810 and 1.3840 are the next resistance levels to monitor for bearish setups. With CAD tethered to oil’s volatility, it’s worth watching crude as a cross-reference. A strong oil bounce could cap this pair, but weakness in energy might lift it further.

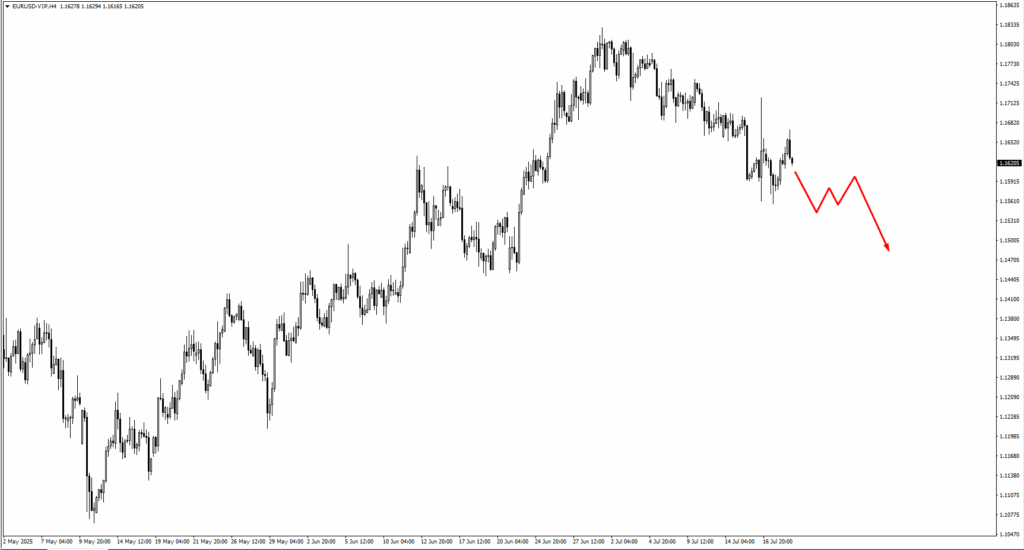
USOil pulled back, with 63.35 and 61.00 acting as the next key demand zones. If price stabilises there, bulls may step back in. But current sentiment feels tentative. Without a geopolitical spark or inventory draw, oil may drift or consolidate through the zones, rather than spike sharply.

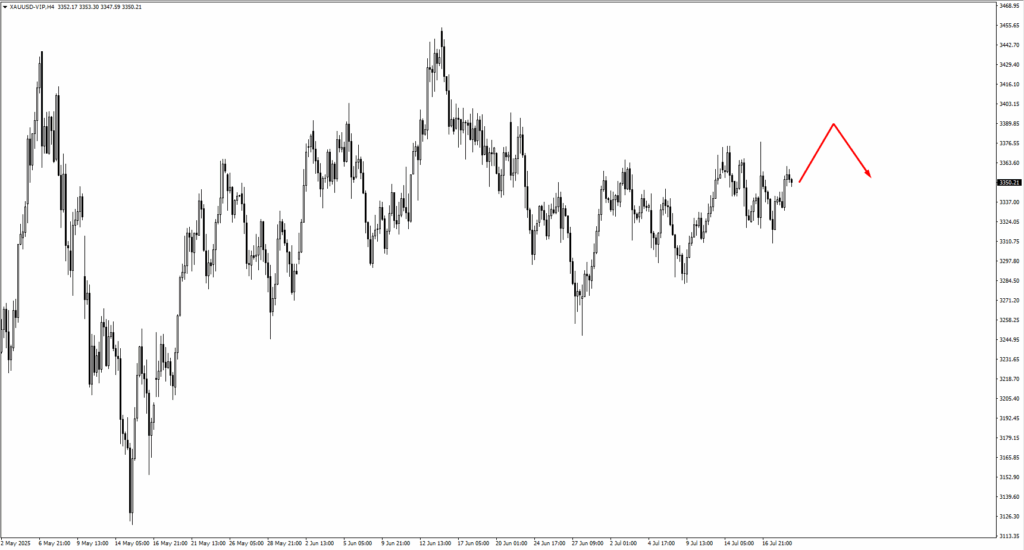
Gold tested the 3340 level and still appears to have upward momentum. If it pushes through to 3380 and 3410, sellers may re-enter. Monitor for signs of exhaustion at these levels, as momentum is still closely tied to real interest rates and the dollar.

The S&P 500 reached a new high, approaching the 6400 mark. If bullish momentum continues, 6630 is the next target. However, with earnings season beginning and the Fed on the horizon, traders may shift to a more defensive posture above 6400 unless supported by breakout volume.

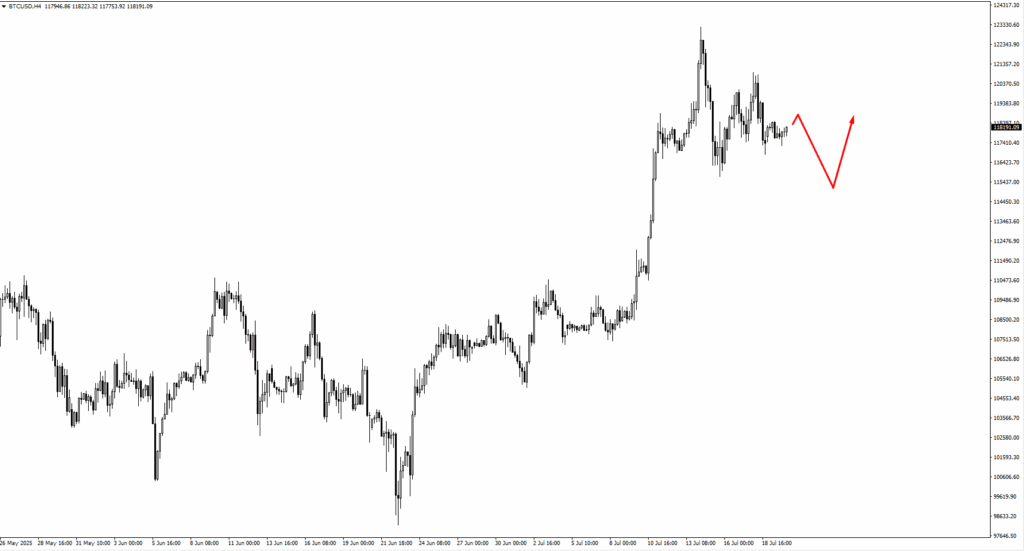
Bitcoin couldn’t hold above the 120,350 mark, failing to close strong. The pullback brings 113,345 and 111,000 into focus for potential bullish setups. If those levels show strength, short-term buyers may look for re-entry. However, ETH’s recent rejection at 6,773 and signs of outperformance are beginning to shift attention across the majors.

Natural gas continues to hold traders’ interest. If it consolidates near 3.26, bulls may eye a run at the 3.615 high. Seasonality and weather volatility remain key catalysts, so traders should stay nimble. A clean breakout above 3.615 would change the structure entirely, but only if volume confirms it.

Key Events Of The Week

On Tuesday, 22 July, all eyes will be on Bank of England Governor Andrew Bailey. With GBPUSD under pressure and drifting near 1.3315, any dovish tilt in tone could increase downside risk. No rate change is expected, but the rhetoric will be closely analysed.

Thursday, 24 July, is packed with data. RBA Governor Michele Bullock will speak while AUDUSD hovers near 0.6520. With no formal rate decision, traders will dissect every word. A cautious tone could drive AUD toward 0.6485, while hawkish comments might give it a brief lift.

Shortly after, Germany’s flash PMIs arrive. Manufacturing is forecast at 49.4, just above last month’s 49.0, with services at 50.0. These are marginal improvements, so surprises may impact the euro sharply. Weakness here could push EURUSD toward 1.1480.

The UK’s own PMI data follows closely. Manufacturing is expected at 48.1, up from 47.7, and services at 52.9, a tick above the previous 52.8. This leaves sterling in a tight spot. A miss, especially on the services side, could push GBPUSD through 1.3315 and test support at 1.3215. Traders should be watching for bullish patterns at those levels if consolidation appears.

The ECB’s main refinancing rate decision lands later in the day. No surprises are expected here—the rate is forecast to hold steady at 2.15%, unchanged from last month. But the press conference that follows could offer the bigger takeaway. Markets are anticipating one final rate cut in September to wrap up the easing cycle. Any comment that supports or challenges that outlook could inject some movement into EUR crosses.

Finally, US flash PMIs round out the session. Manufacturing is projected to dip slightly to 52.7 from 52.9, while services are expected to rise to 53.0 from 52.9. The data won’t change Fed policy on its own, but with the FOMC press conference and Core PCE around the corner next week, it could shift sentiment. If the numbers beat expectations, it may help the dollar extend gains, particularly if USDX breaks out above the 99.85 level.

Looking ahead, next week could bring heavier macro winds: US Advance GDP (30 July), CAD Overnight Rate, FOMC Press Conference, Core PCE Price Index, Japan’s Monetary Policy Statement, and US Non-Farm Employment Change (1 August). For now, though, all eyes are on Thursday, a day dense with data, tone shifts, and short-term trading opportunity.

Create your live VT Markets account and start trading now.

One-year inflation expectations fall to 2.5% as firms stay cautiously optimistic despite profit declines

The latest ECB survey shows that inflation expectations for the next year have fallen to 2.5%, down from 2.9%. Expectations for inflation in three and five years remain steady at 3.0%. Many companies report that trade tensions are affecting their operations, especially those exporting to the US. While 23% of businesses are optimistic about the upcoming quarter, they also note a decrease in profits.

Market Reactions To ECB Position

These developments are not expected to change the ECB’s current stance, as they are still gathering more data. The market anticipates one last interest rate cut by the end of the year. According to the survey highlighted by Dellamotta, we should prepare for a more cautious European Central Bank. The drop in one-year inflation expectations is a notable sign of this. However, a recent flash estimate from Eurostat shows that headline inflation increased to 2.5% in June, creating mixed signals for policymakers. This situation favors yield curve steepener trades, which are based on the differences between short-term and long-term interest rates. While the market has largely accounted for a high chance of another rate cut, falling profits could push the central bank to act more aggressively than expected. Historically, central banks tend to make deeper cuts than initially planned when an easing cycle starts to tackle a slowing economy.

Currency Strategies In Light Of ECB Moves

With the central bank’s plans to gather more information over the summer, we anticipate lower immediate volatility. This suggests that selling short-dated options to collect premium could be a smart move, as major policy changes are unlikely until September. However, we should be ready for increased volatility as important inflation reports and policy meetings approach. The strain on corporate profits and the clear reference to trade tensions with the US should influence our currency derivative strategies. These factors combined with the possibility of ECB rate cuts happening faster than those from the Federal Reserve suggest a bearish outlook for the Euro. We might consider buying puts on the EUR/USD or creating other bearish strategies to benefit from a potential decline towards the 1.05 level seen earlier this year. Create your live VT Markets account and start trading now.

here to set up a live account on VT Markets now

GC futures prices stayed the same, with short-term trading strategies targeting key levels and market structure.

Gold futures are currently at $3,373.5, marking a consolidation phase today. This level is impressive, reflecting a 37% increase over the past year. The intraday range is between $3,351 and $3,378.3, with a notable 50-week high of $3,509.9. According to tradeCompass, key levels to watch are bullish above $3,354.2 after a re-cross and bearish below $3,387.5 after a failure. Today’s market indicates that traders should be cautious near the upper intraday levels. Bearish opportunities could arise if prices reach $3,387–$3,388 and then retreat. The tradeCompass strategy suggests activating bearish trades if prices dip below $3,387.5. For these trades, partial profit targets range from $3,382.7 to an extended target of $3,328.4.

Technical Analysis Insights

For a bullish trade, prices need to drop below $3,354.2 and then rise above it again. Partial profit targets for this strategy would be between $3,359.8 and $3,386.7. Using tools such as Volume Profile, tradeCompass simplifies identifying potential turning points and improves entry and exit strategies. This helps traders understand market conditions and make better decisions. Risk management is crucial. Limit yourself to one trade in each direction per session and adjust your stops after achieving partial profit targets. TradeCompass acts as a supportive decision tool, helping traders navigate key levels without making forecasts or offering financial advice. Given this analysis, we should view gold’s recent sideways movement as a consolidation rather than weakness. The market is taking a breather, which means traders need to switch from trend-following to range-trading strategies. This pause offers opportunities for agile traders who concentrate on defined levels. The strong long-term bullish case is backed by solid demand fundamentals, particularly central bank purchases. The World Gold Council noted that central banks added over 1,000 tonnes to their reserves for two years straight in 2022 and 2023. This trend creates strong support levels that investors are likely to defend.

Options Trading Strategies

For options traders, the current consolidation phase suggests selling premium could be a smart choice. As gold stays within a steady range, implied volatility tends to decrease, making strategies like iron condors or selling strangles appealing. One possibility is to sell call options above the $3,387.5 resistance while selling put options below the $3,354.2 support to profit from the expected stability. Futures traders should set aside hopes of catching a strong rally and instead focus on reactions at key levels. We’ll be monitoring if the price approaches $3,387.5 and fails, providing an essential trigger for a short entry. Remember to take profits at set targets rather than hoping for a bigger drop. Historically, gold has often gone through long consolidation periods after substantial price increases, like the phase after the 2011 peak when the market moved sideways for months. This pattern frustrated breakout traders but rewarded those who took advantage of the range. We need to prepare for a similar situation now, using the identified levels as our guide for the coming weeks. While the bearish strategy seems more pressing, we can’t overlook potential bullish setups. If sellers push the price below $3,354.2 but buyers quickly regain that level, it signals strong rejection of lower prices. This would be our signal to open a long position, employing a disciplined approach to take partial profits as the price rises back through the range. Create your live VT Markets account and start trading now.

here to set up a live account on VT Markets now

Swiss sight deposits increased to CHF 475.3 billion as banks steer clear of negative rates.

As of July 18, the Swiss National Bank (SNB) reported total sight deposits of CHF 475.3 billion, up from CHF 464.1 billion. Domestic sight deposits increased to CHF 444.8 billion from CHF 434.9 billion. This growth in sight deposits is due to financial institutions looking for safety from negative interest rates. After the recent rate cut, the Swiss Average Rate Overnight (SARON) dropped to between -0.03% and -0.04%. As a result, keeping reserves with the SNB has become a more appealing choice.

Market Reactions to Rate Cut

The increase in sight deposits directly reflects financial institutions reacting to the central bank’s recent rate cut. This indicates that there is extra cash in the system and confirms that the policy is successfully pushing short-term rates into negative territory. This liquidity will likely influence the market in the coming weeks. For traders involved in interest rate derivatives, this information supports the idea that Swiss rates will stay low. SARON futures are already indicating a negative rate environment for the rest of the year, with some traders even considering a further cut by December. We think that strategies benefiting from steady or falling short-term rates, like selling Swiss franc interest rate futures, are well-positioned. This monetary policy approach may put pressure on the Swiss Franc. Historically, periods of rate cuts tend to weaken the franc. For example, after the rate cut in June 2024, the EUR/CHF exchange rate rose from 0.95 to over 0.98. Therefore, using options to bet on a higher USD/CHF or EUR/CHF exchange rate could be a good idea.

Impact on Swiss Equities

The low-interest-rate environment is likely to support Swiss equities. Lower borrowing costs can enhance company earnings and make stocks more appealing than cash, which is now earning negative returns. The Swiss Market Index is already up nearly 6% since the last policy easing. We believe selling out-of-the-money put options on the index is a smart way to collect premium. Create your live VT Markets account and start trading now.

here to set up a live account on VT Markets now

Gold’s upward trend continues as inflation data affects interest rate expectations and market dynamics

Gold has remained steady after US inflation data came in lower than expected. Investors are taking defensive positions because of possible tariff issues, even though tariff deadlines may be delayed. With real yields decreasing due to potential easing by the Fed, gold is likely to trend upwards. However, if interest rates take a unexpectedly hawkish turn, we might see some short-term dips.

Technical Analysis

In the daily chart, gold bounced back from an important upward trendline. Buyers are aiming for a rally towards the 3438 resistance level, while sellers are looking for a break below the trendline to reach near 3120. The 4-hour chart shows minor resistance around 3377, with sellers expecting a dip below the main trendline and buyers targeting a rise to 3438. On the 1-hour chart, a minor upward trendline supports positive momentum. Buyers will likely defend this trendline in hopes of breaking through minor resistance, while sellers will aim to push prices below this line, looking for a major trendline breakout. Coming up are important events like Fed Chair Powell’s speech, US Jobless Claims, and the flash US PMIs, which could impact gold prices.

Recent Data and Strategies

The recent US Consumer Price Index data, which was lower than expected at 3.3% annually, signals cautious optimism. Derivative traders might consider buying call spreads to bet on price increases while limiting downside risk. Current market pricing indicates over a 65% chance of an interest rate cut by September, reinforcing this bullish outlook. Concerns about tariffs also support the view of gold’s potential rise. During the 2018-2019 trade disputes, gold increased over 20% amid rising global uncertainty, which sets a precedent for the current situation. Selling out-of-the-money put options may be a good way to collect premiums since these geopolitical issues should provide price support. From our viewpoint, the major upward trendline is crucial for any strategy. A bull put spread with the short strike below this trendline is a solid way to earn income while maintaining a bullish stance. If the price falls below that critical level, it signals us to exit bullish trades and consider buying puts to target a drop towards the 3120 support area. The upcoming remarks from Powell and the latest jobless claims could lead to short-term price fluctuations. With initial claims recently reaching a 10-month high, any evidence of further labor market weakness could push prices through the minor 3377 resistance. Traders might buy short-dated call options to take advantage of a possible breakout with minimal capital at risk. Create your live VT Markets account and start trading now.

here to set up a live account on VT Markets now

Dividend Adjustment Notice – Jul 21 ,2025

Dear Client,

Please note that the dividends of the following products will be adjusted accordingly. Index dividends will be executed separately through a balance statement directly to your trading account, and the comment will be in the following format “Div & Product Name & Net Volume”.

Please refer to the table below for more details:

Dividend Adjustment Notice

The above data is for reference only, please refer to the MT4/MT5 software for specific data.

If you’d like more information, please don’t hesitate to contact [email protected].

The Chinese central bank keeps lending rates steady, focusing on fiscal support while carefully observing economic conditions.

China’s central bank has decided to keep the 1-year loan prime rate (LPR) at 3.00% and the 5-year rate at 3.50%. This choice comes after a slightly better-than-expected GDP performance in the second quarter, indicating that the Chinese economy is stable even amid trade tensions. With a temporary truce between the U.S. and China, there is less pressure for China to make further easing moves unless absolutely necessary. There is also a growing belief that fiscal support is needed to boost domestic demand, rather than just relying on lowering interest rates.

Economic Slowdown and Tariff Impact

Concerns remain about a slowing economy and the possible effects of U.S. tariffs on Chinese exports, which could impact fiscal policies. Any rate cuts by the People’s Bank of China (PBOC) would likely be in response to disinflation, indicating that future decisions on rates will require careful thought. Since the loan prime rates are unchanged, we believe the market will trade within a stable range with low volatility. This suggests that strategies involving selling short-term options related to the Chinese yuan could be beneficial. For example, the one-month implied volatility for the offshore yuan (USD/CNH) has recently hit multi-year lows, supporting the idea of stability in the near term. We expect that the market focus will shift from monetary policy to possible fiscal measures to support the economy. Traders should pay closer attention to government spending announcements rather than central bank communications. Recent data shows that industrial production growth slowed to 5.6% in May, missing forecasts, making it more likely for the government to support the manufacturing sector.

Persistent Threat of Disinflation

The main reason for a future rate cut is the ongoing threat of disinflation, which signals weakened domestic demand. China’s Consumer Price Index (CPI) increased by only 0.3% in May compared to a year earlier, showing that deflationary pressures are still present. We are preparing for possible increased volatility around upcoming inflation data releases, as a weak report might require a policy change. Historically, during the easing cycle in the 2015 economic slowdown, rate cuts led to a weaker yuan and a temporary rise in domestic stocks. Therefore, we are cautiously considering long-term bearish strategies on the currency using options that would profit from a future rate cut. However, any strength in the equity market may be limited if global trade conditions, especially with the United States, do not improve significantly. Create your live VT Markets account and start trading now.

here to set up a live account on VT Markets now

European indices showed little movement as Stellantis reported losses, while S&P futures boosted market sentiment.

European indices showed little change at the week’s start. The Eurostoxx, Germany’s DAX, France’s CAC 40, and the UK’s FTSE each gained 0.1%. In contrast, Spain’s IBEX dropped by 0.1%, and Italy’s FTSE MIB slipped by 0.6%. Stellantis reported a net loss of €2.3 billion in the first half of the year, mainly due to tariffs. Meanwhile, S&P 500 futures rose by 0.2%, which points to a steady market mood. Attention is now on the upcoming US-EU trade talks before the August 1 deadline. Tech stocks are poised for earnings reports from Google/Alphabet and Tesla later this week.

Market Opportunities

In the cautious atmosphere Low describes, we view the current calm as a chance for investment. The Euro Stoxx 50 Volatility Index (VSTOXX) is nearing a three-month low around 14, making options more affordable. This is a prime time to buy protection or prepare for a big market shift before it happens. The August 1 deadline for US-EU trade talks brings potential risks that the market might not fully account for. In the past, trade deadlines, especially during 2018-2019, caused sharp spikes in volatility, regardless of the outcomes. We recommend that traders consider buying straddles on the Germany 40 index to profit from a significant move once a decision about steel and aluminum tariffs is reached. The carmaker’s loss also signals important opportunities in certain sectors. Recent data from the European Automobile Manufacturers’ Association (ACEA) shows a 2.6% drop in new car registrations in the EU during the first half of the year, highlighting ongoing weaknesses. As a result, we are looking to buy put options on the STOXX Europe 600 Automobiles & Parts index to guard against further tariff-related impacts.

Impact of US Tech Earnings

While European economic factors are crucial, we shouldn’t overlook US tech earnings, as they often influence global growth stocks. A strong earnings report from a company like Alphabet could boost the entire tech sector, including European firms like SAP and ASML. For this reason, we find good value in short-dated call options on European technology ETFs to benefit from any positive effects coming from the US. Create your live VT Markets account and start trading now.

here to set up a live account on VT Markets now

Traders evaluate the impact of Japan’s election on yen fluctuations amid cautious sentiment affecting currency trends

The USD/JPY has dropped by 0.6%, nearing 148.00, as traders react to Japan’s election results. The ruling coalition’s expected loss brings political uncertainty, which affects the yen. Usually, political instability can strengthen the yen at first. However, the overall trend will depend on the Bank of Japan’s future rate decisions. Talks between Japan and the US about trade may complicate the central bank’s plans to raise rates, posing challenges for the yen. This situation indicates that any potential gains for the yen could be limited. The currency’s future direction remains unpredictable as the political and economic situation evolves.

USD/JPY Technical Analysis

Current charts show that the recent decline in USD/JPY is not severe. Sellers have dipped below the 100-hour moving average, changing the positive trend that began in July. The 200-hour moving average is now acting as a support level. If this support holds, buyers might start to emerge. On the other hand, if it breaks below, the pressure to decline could increase, potentially reaching 147.00. The combination of technical factors and market sentiment will continue to shape the yen’s path in the near future. We view the recent election outcomes as a sign of political weakness, which can temporarily boost the currency. Prime Minister Fumio Kishida’s cabinet approval ratings are near record lows, with some polls at less than 25%, making governance challenging. This instability makes the yen a short-term safe haven amid domestic uncertainty. However, the main trend will follow the central bank’s decisions, influenced by economic data. As of April 2024, Japan’s core inflation has stayed above the bank’s 2% target for 25 months, placing continuous pressure on policymakers to consider more rate hikes. This economic reality is likely to outweigh short-term political chatter in the coming weeks. Historically, periods of political upheaval, like the frequent changes in prime ministers from 2006 to 2012, often saw an initial strengthening of the yen before it succumbed to global economic trends. We expect a similar brief pattern this time, where political issues give way to the stronger influence of interest rate differences. Therefore, any currency strength should be seen as a chance to sell.

Yen Trading Strategy

From a trading standpoint, it’s important to monitor the 200-hour moving average as a key support level. If this line breaks, we should consider buying put options on the USD/JPY pair. This strategy could take advantage of a possible short-term drop to the 147.00 level mentioned earlier. The clash between political news and economic fundamentals is likely to increase volatility. Recently, implied volatility for one-month USD/JPY options has gone up, indicating that the market expects larger price swings. This environment suggests that strategies like option straddles may work well for traders who anticipate a significant move but are uncertain about its direction. Create your live VT Markets account and start trading now.

here to set up a live account on VT Markets now

An uneventful day shows minor economic indicators, with price actions likely remaining stable or unchanged

Today, the economic calendar is light, featuring minor reports like the Canadian Producer Price Index and the US Leading Economic Index. The Bank of Canada will also release its Business Outlook Survey, but this is unlikely to affect the central bank or the markets. Market movements may stay steady or continue based on last week’s reports. US inflation fell short of expectations, while activity data was stronger than anticipated. Predictions for Federal Reserve interest rates have shifted, now anticipating about 47 basis points of easing by the end of the year. A rate cut at the next Federal Reserve meeting is not expected.

Market Direction Uncertain

With fewer reports today, the market seems influenced by last week’s mixed data. The May Consumer Price Index showed a moderate increase of 3.3% year-over-year, but a strong labor market adds to the uncertainty. This situation indicates that traders should prepare for a significant movement once a clearer trend develops. As economic signals conflict, it makes sense to position for a breakout in either direction. The CBOE Volatility Index (VIX) is low at around 12, making options relatively cheap. Buying straddles or strangles on major indices like the S&P 500 could be a smart way to prepare for a future increase in volatility, no matter which way it goes. The market anticipates about two interest rate cuts by the end of the year, but this is not certain. Minneapolis Fed President Kashkari recently suggested that just one cut later in the year is more likely. This gap in expectations creates opportunities for trades that could profit if the market adjusts to a more hawkish Fed stance.

Strategic Investments

Historically, when the Federal Reserve keeps rates steady in the face of mixed data—like in 2019—trading tends to be choppy and range-bound before a major policy change. This suggests that making big directional bets now is risky. Instead, we should focus on strategies that benefit from either consistent ranges or a sharp breakout. The 10-year Treasury yield, around 4.25%, is a key indicator reflecting this economic uncertainty. We’re considering options on interest rate futures to hedge against or speculate on significant movements in yields. For instance, implementing iron condors on Treasury futures may yield profits if yields stay within a certain range in the coming weeks. At this moment, the path of least resistance seems to imply continued upward momentum, pushing the S&P 500 to new highs above 5,400. To take advantage of this trend while managing risk, we are looking into buying call spreads. This strategy allows us to join in on potential gains while limiting losses if the positive sentiment changes suddenly. Create your live VT Markets account and start trading now.

here to set up a live account on VT Markets now

Back To Top
Chatbots