Sterling stays below 1.3500 against the dollar, hovering near four-week lows amid expectations of a BoE rate cut
GBP/USD steadied after three straight days of losses this week. It traded in a narrow range near a four-week low during Thursday’s Asian session. The pair was just below 1.3500 and still looked vulnerable to further downside.
Sterling weakened as markets raised the odds of a Bank of England rate cut at the March meeting. This came after a soft UK jobs report and a fall in UK consumer inflation to its lowest level in almost a year.
During Asian trading, EUR/JPY rises toward 182.80, extending gains as yen support may limit further upside
EUR/JPY rose for a second session and traded near 182.80 during Asian hours on Thursday. Upside may be capped as the Japanese yen finds support from expectations of further Bank of Japan (BoJ) tightening.
Reuters reported that markets price in nearly an 80% chance of a BoJ rate hike in April 2026. Policymakers are expected to review new data before taking any further steps.
Japan Data And Yen Support
Japan’s core machinery orders rose 19.1% month on month to ¥1,052.5 billion in December 2025. This followed an 11% drop in November and beat forecasts for a 4.5% rise. The jump was linked to large, one-off orders from refineries and nuclear fuel producers. Private-sector orders rose 16.8% year on year in December, after a 6.4% fall in November. This also beat forecasts for a 3.9% gain. The Financial Times reported that ECB President Christine Lagarde may step down before October 2027. It did not give a timeline. Focus now shifts to Japan’s national CPI on Friday, along with early PMI data for Germany and the Eurozone. The BoJ targets inflation of around 2%. It used QQE from 2013, added negative rates and yield curve control in 2016, and raised rates in March 2024.Key Risks And Trading Outlook
EUR/JPY is moving higher, but the rally looks fragile, so caution is warranted. The market strongly expects the BoJ to raise rates in April, with close to an 80% probability priced in. That expectation could act as a firm cap on the pair in the weeks ahead. The case for a stronger yen is growing. Japan’s national core CPI for January 2026 held at 2.4%, staying above the BoJ’s target. While the surge in December 2025 machinery orders was seen as a one-off, it still supports the view that the economy can handle tighter policy. Friday’s national CPI report will be key for confirming (or challenging) this trend. On the other side, the euro faces headwinds from political uncertainty around the ECB presidency. Leadership doubts can weigh on a currency even when economic data is stable. The latest Eurozone Composite PMI for January 2026 was 48.5, which still signals contraction and makes the euro’s strength look less convincing. For derivatives traders, this backdrop points to higher volatility into the April BoJ meeting. One-month implied volatility for EUR/JPY has already risen to a six-month high of 9.5%, suggesting the market is preparing for a larger move. In this environment, buying puts to hedge against a downside pullback, or using straddles to trade a volatility rise, may be sensible. A similar setup played out in 2025. When expectations for a BoJ shift peaked, the yen strengthened quickly and EUR/JPY dropped sharply. The current upswing feels like the type of run-up that has come before past corrections. Create your live VT Markets account and start trading now.During Asian trading, USD/JPY approaches 155.00 as hawkish Fed minutes boost the dollar against the yen
USD/JPY rose slightly to near 155.00 in early Asian trade on Thursday. The move came as the US Dollar strengthened after hawkish signals in the Federal Reserve’s meeting minutes. Traders are now waiting for Japan’s National CPI report on Friday for the next cue.
The Fed has cut its benchmark rate by a total of 0.75 percentage points across moves in September, October, and December. This brought the target range to 3.5%–3.75%. Minutes from the January meeting showed officials were divided on what comes next, with several saying rate hikes could still be on the table.
Japan Political And Fiscal Backdrop
In Japan, Prime Minister Sanae Takaichi’s recent election win has lifted expectations for looser fiscal policy. This includes talk of a two-year suspension of the food sales tax. The IMF has warned Japan against such tax cuts, arguing they could undermine fiscal stability. Markets currently see the next Bank of Japan rate hike as most likely in April. Some also see March as possible if wage growth and inflation stay strong. Expectations for more BoJ tightening by April or July are generally supportive for the Yen and could weigh on USD/JPY. The Yen is driven by Japan’s economic data, BoJ policy, the US–Japan bond yield gap, and overall risk sentiment. Direct BoJ intervention is rare. Meanwhile, the BoJ’s ultra-loose policy from 2013 to 2024 helped weaken the Yen, until the central bank began a gradual shift in 2024. Earlier in 2025, USD/JPY pushed toward 155.00 due to hawkish Fed signals and a more cautious BoJ. Now, on February 19, 2026, the pair trades much lower near 148.50 as central bank policy paths have moved away from last year’s expectations. This change reflects the steady, but clear, policy tightening Japan has delivered over the past 12 months.Policy Divergence And Trading Implications
As expected, the Federal Reserve cut rates into the 3.50%–3.75% range late last year. But US inflation has remained stubborn. The latest Core PCE reading is still above 3%, which has kept the Fed on hold since December 2025. This has helped prevent a larger drop in the US Dollar and has kept it relatively firm against other currencies. In contrast, the Bank of Japan followed through with the rate hikes expected in 2025. It lifted its policy rate to 0.25% through two separate increases. This was a major shift away from negative rates and has supported the Japanese Yen. Traders are now looking for the BoJ’s next signal, which will depend heavily on upcoming data. In the weeks ahead, one major event for traders is Japan’s annual “Shunto” spring wage talks. Early reports suggest large unions are seeking wage gains above 5%, a level not seen in decades. If the final wage deals are strong, the BoJ may feel pressure to tighten further to contain inflation, which would likely support the Yen. With that setup, derivatives traders may look to position for more Yen strength, which would mean a lower USD/JPY. One straightforward approach is buying USD/JPY put options expiring in April or May 2026 to target a possible post-Shunto rate hike. Put spreads—buying one put and selling another at a lower strike—may offer a lower-cost way to express the same view. Still, the US–Japan rate gap remains wide. The US 10-year Treasury yield is around 4.2%, while Japan’s 10-year yield is near 0.9%. This gap supports carry trades and can keep demand under USD/JPY. So while momentum may favor a lower USD/JPY, pullbacks could attract strong buyers. Create your live VT Markets account and start trading now.DXY steadies near 97.70 in Asian trading after rising to a one-week high, keeping upside potential
The US Dollar Index (DXY), which measures the US dollar against a basket of major currencies, traded in a narrow range during Thursday’s Asian session. This came after it climbed to a more than one-week high. It held near 97.70 and was little changed on the day.
Minutes from the January FOMC meeting showed officials were divided on whether, and when, to cut interest rates. Inflation remained the main concern. Some officials said cuts could be needed if inflation drops as expected. Others warned that cutting too soon could put the Federal Reserve’s 2% inflation goal at risk.
Fed Minutes Jobs Data And Geopolitical Risk
The minutes followed last week’s strong January Nonfarm Payrolls report. That report lowered expectations for faster policy easing and helped support the dollar. Reports that the US military could be ready to strike Iran as early as this weekend also kept geopolitical risk in focus. This supported demand for the dollar as a safe-haven. Markets still price in at least two Federal Reserve rate cuts in 2026 after softer US consumer inflation data last Friday. Traders stayed cautious despite a positive market mood. Attention now turns to Friday’s US Personal Consumption Expenditure (PCE) Price Index, which is likely to drive the next move. This same time last year, in early 2025, the US Dollar Index was also consolidating near 97.70 as the Federal Reserve remained deeply divided. Strong jobs data was balanced by expectations that at least two rate cuts were coming. That created a tense standoff for the Greenback. Geopolitical risks tied to Iran also helped support the dollar by keeping its safe-haven appeal in place. Today, conditions look very different. The dollar has strengthened, and the DXY now trades around 104.55. The Fed ended up holding rates steady through most of 2025 because inflation stayed persistent. That outcome went against the market’s earlier hopes for aggressive easing. The gap between those expectations and the Fed’s actual path has been a major reason for the dollar’s rise over the past year.Inflation Labor And Volatility Signals
Recent data still gives the Federal Reserve—and the dollar—a mixed outlook. The January 2026 Consumer Price Index (CPI) report, released last week, showed core inflation edging down to 3.1%. That is still well above the Fed’s 2% target. At the same time, the latest Nonfarm Payrolls report showed a solid gain of 195,000 jobs. That points to a resilient economy and makes the timing of any rate cuts this year harder to judge. For derivatives traders, stubborn inflation combined with steady growth suggests volatility in rate-sensitive assets may stay high. Options strategies, such as buying straddles on euro or yen futures, can help traders position for a large move without having to pick a direction. Implied volatility for these currency pairs has risen to a three-month high of 9.2%, highlighting current uncertainty. Looking ahead, the focus shifts to the upcoming PCE Price Index, the Fed’s preferred inflation measure. A stronger-than-expected reading could push back expected rate cuts. That could lift the DXY and pressure equity index futures. Traders should be prepared for choppy trading and stay flexible around key data releases in the weeks ahead. Create your live VT Markets account and start trading now.Geopolitical tensions keep WTI above $65 despite slipping in Asian trading after a 4.9% fall
WTI traded near $65.00 a barrel during Asian hours on Thursday, after dropping 4.9% in the previous session. Prices stayed supported by supply risks tied to US-Iran tensions and stalled Ukraine-Russia talks.
US-Iran negotiations remain unresolved. Tehran said there was a “general agreement” on the framework for a possible nuclear deal. US officials said Iran has not met US conditions. US President Donald Trump said military action is still possible, and reports suggest it could turn into a long campaign.
Geopolitical Risks Support Prices
Reuters reported that two days of peace talks in Geneva between Ukraine and Russia ended with no progress. Ukrainian President Volodymyr Zelenskiy said Russia is delaying US-led efforts to end the four-year war. Meanwhile, Russian forces kept striking energy infrastructure and continued advancing on the battlefield. In trade flows, India’s state-run Bharat Petroleum Corporation Limited bought Venezuelan crude for the first time. HPCL Mittal Energy Limited also bought Venezuelan cargoes for the first time in two years, Reuters reported, citing sources. The American Petroleum Institute said US weekly crude stocks fell by 0.609 million barrels last week. This partly offset the previous week’s 13.4 million-barrel increase, the largest build since January 2023. Earlier last year, WTI held near $65 a barrel mainly because of major supply risks. US-Iran tensions were high, and the war in Ukraine showed no clear path to ending. This helped put a floor under prices, even as inventory data moved around. Since then, the market has continued to price in a baseline level of geopolitical risk. In the second half of 2025, prices strengthened after OPEC+ signaled it would cut output more aggressively to defend the $70 level. That helped push WTI into a $75–$80 range for several months. Risks linked to Iran and Russia did not disappear, but attention shifted toward OPEC+ supply discipline. This showed up in lower global inventories in Q3 and Q4 reports last year.Demand Signals Challenge The Bull Case
Now, in February 2026, that story is being tested by new concerns about global demand. China’s latest manufacturing PMI came in at 49.2, below 50, which marks the line between growth and contraction. This raises worries about a slowdown in the world’s largest oil importer. It also raises the question of whether OPEC+ cuts can offset a real drop in consumption. This week’s Energy Information Administration (EIA) report supports a more cautious view. It showed a surprise crude inventory build of 4.2 million barrels, despite expectations for a small draw. This is the third straight weekly build, which suggests supply may be rising faster than demand in the near term. That is very different from the large drawdowns seen late last year. In the weeks ahead, the push and pull between weaker demand signals and geopolitical supply risks could drive higher volatility. Strategies that benefit from large price moves, such as buying straddles or strangles, may help capture that uncertainty. Selling short-dated call options with strikes above $80 could also generate income, if demand concerns limit rallies. Create your live VT Markets account and start trading now.During Asian trading, USD/CAD slips toward 1.3695 as rising crude prices boost the Canadian dollar
USD/CAD slipped to around 1.3695 in Asian trading on Thursday. Higher crude oil prices supported the Canadian dollar, as Canada is a major oil exporter. Oil prices climbed on ongoing tension between the US and Iran.
Canada’s CPI inflation eased to 2.3% year over year in January, down from 2.4% in December, according to Statistics Canada data released Tuesday. The figure missed the 2.4% market forecast, which increased expectations of another Bank of Canada rate cut.
Market Drivers In Focus
The US dollar found support from the January Federal Open Market Committee minutes. Several policymakers said rates may need to rise if inflation stays high. On Friday, markets will watch the preliminary US Q4 GDP reading, along with the PCE Price Index and S&P Global PMI data. These releases may drive near-term moves in USD/CAD. Looking back to early 2025, a key divergence began to form between the US and Canada. Softer Canadian inflation was already pointing to Bank of Canada (BoC) rate cuts, while the Federal Reserve kept a hawkish tone. This policy split has shaped trading for the past year. That view proved accurate. The BoC started cutting rates in mid-2025 and has lowered its policy rate to 3.75%. January 2026 inflation data showed CPI at 2.1%, supporting the case that the BoC still has room to ease. This has continued to weigh on the Canadian dollar.Policy Divergence And Trading Implications
In the US, inflation has been more persistent. The Federal Reserve has kept rates steady at a higher level, as core PCE inflation printed at 2.8% for January 2026, still above target. This has widened the rate gap between the US and Canada, making the US dollar more attractive. This gap has generally pushed USD/CAD higher over the past 12 months, lifting it from the 1.3700 area toward 1.3900. At the same time, strong oil prices have helped support the Canadian dollar, with WTI crude trading above $85 a barrel. These forces—higher US rates versus strong energy prices—are keeping the pair in a tight balance. In the coming weeks, selling volatility in USD/CAD could be a possible strategy. With strong but offsetting drivers, the pair may stay in a range. Traders could look at selling strangles, which means selling an out-of-the-money call and an out-of-the-money put to collect premium, and profiting if the pair does not move sharply. If oil volatility rises, buying options can offer defined risk for a directional view. If a trader expects a further jump in energy prices to strengthen the loonie, they could buy USD/CAD put options. If they expect the rate gap to outweigh oil, buying call options may fit that view. Create your live VT Markets account and start trading now.Australia’s part-time employment fell by 32.7K from a 10.4K increase, signalling a downturn in hiring trends
Australia’s part-time employment fell by 32.7K in January. The previous figure was 10.4K.
That’s a 43.1K swing from the prior month. It shows a shift from growth to a decline in part-time jobs.
Labor Market Warning Sign
January’s sharp drop in part-time employment is a clear warning sign for the Australian economy. This is not a small pullback. It is the largest monthly fall in part-time roles in more than a year and suggests businesses are becoming more cautious about hiring. This data also challenges the view that the labor market stayed resilient through most of 2025. This softer labor market will likely push the Reserve Bank of Australia (RBA) toward a more cautious, or dovish, stance. Inflation eased to 3.4% in the final quarter of 2025, and this employment report strengthens the case for the RBA to pause any plans for further rate hikes. Derivative markets may now price in a lower peak for the cash rate in this cycle. For currency traders, this may increase downside pressure on the Australian dollar, especially against the US dollar. If the RBA turns more cautious while the US Federal Reserve stays focused on inflation, the interest rate gap becomes less supportive for the AUD. Traders may look at put options on AUD/USD futures to hedge against a move back toward 0.6400, a level last tested in late 2024. In rates markets, a rally in government bond futures could push yields lower. The Australian 3-year government bond futures (YT) are worth watching because they respond quickly to changes in cash rate expectations. If markets start to rule out future rate hikes, these contracts could rise in the next few sessions.ASX 200 Options Outlook
The outlook for the ASX 200 is more mixed, which can create opportunities for options traders. A weaker economy can hurt corporate earnings, but lower interest rates for longer can support equity valuations. This push-and-pull may lift volatility, making strategies like buying straddles on the XJO index attractive for traders expecting a large move in either direction. Create your live VT Markets account and start trading now.Australia’s participation rate hit 66.7%, falling short of the 66.8% forecast in January’s labour market report
Australia’s participation rate was 66.7% in January. This was slightly below the market expectation of 66.8%.
A participation rate that misses expectations by a small margin can signal a cooling labour market. If the labour market is easing, wage growth may slow too. That, in turn, can reduce inflation pressure. For us, this lowers the chance of near-term interest rate hikes from the Reserve Bank of Australia.
Dovish Rba Positioning
Traders may want to position for a more dovish RBA through interest rate derivatives. The market has already moved in this direction. Pricing for the RBA cash rate now implies less than a 15% chance of a hike by mid-year, down from more than 30% last month. We see value in strategies that benefit if the RBA holds rates steady or begins to signal cuts. This shift in rate expectations also affects the Australian dollar, making it less attractive to hold. A softer labour market could pull AUD/USD, now around 0.6580, down toward key support levels. We think short AUD exposure via futures, or buying put options, is a reasonable approach in the weeks ahead. For equity index derivatives, the picture is less clear. Lower rate expectations can support the ASX 200. However, weaker labour data can also point to a broader slowdown, which could hurt earnings. With these forces pulling in different directions, we expect implied volatility to rise. That makes options strategies that benefit from larger moves more appealing. Looking back to 2025, a tight labour market pushed the RBA into multiple rate hikes to fight inflation. This January reading is one of the first clearer signs that those earlier policy moves may be working. It supports the view that the hiking cycle is over.Next Key Data Watch
Our focus now shifts to the next monthly CPI indicator release. If inflation also comes in soft, it would confirm the message from labour data and likely increase expectations for RBA rate cuts later this year. We will watch that release closely and adjust our positions as needed. Create your live VT Markets account and start trading now.Nasdaq Recovers As Technology Strength Bolsters Asian Markets
Asian equities moved higher following a firm rebound in US technology shares, while encouraging US economic figures provided additional support to Wall Street.
The Nasdaq 100 advanced by 0.8%, with the S&P 500 adding 0.6%, helping to steady market sentiment after recent swings linked to concerns over artificial intelligence-driven earnings disruption.
The MSCI Asia Pacific Index posted gains for a second consecutive session. Markets in Australia and Japan rose, and South Korea’s main index reached a fresh record high.
Activity across parts of the region was subdued, however, as mainland China, Hong Kong and Taiwan remained closed for the Lunar New Year holiday.
The recovery in US technology stocks suggests investors are revisiting earlier anxieties surrounding AI-related profit pressures. Some institutional participants have started selectively rebuilding positions after the recent correction.
Firm US Data Underpin Risk Appetite
Confidence was further supported by solid US economic releases. Industrial production recorded its strongest rise in January, orders for business equipment in December exceeded expectations, and housing starts climbed to their highest level in five months.
Together, these indicators point to sustained growth momentum at the outset of 2026.
Nonetheless, bond markets signalled a degree of caution. A $16 billion auction of 20-year US Treasuries met with tepid demand, and Treasury prices weakened during the New York session. The dollar index rose 0.5% on Wednesday, although it edged lower against most Group-of-10 currencies during Asian trading hours.
Technical Analysis
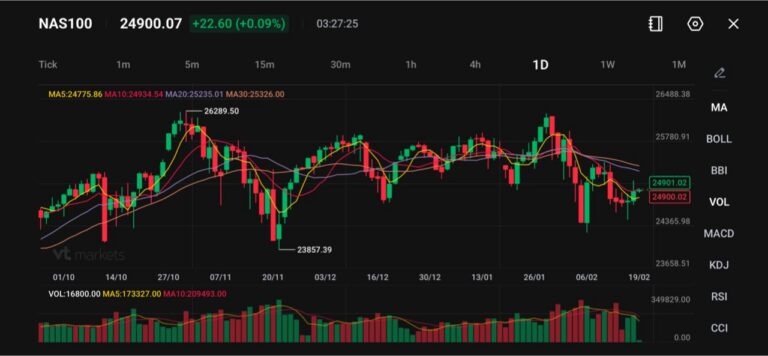
The NAS100 is trading near 24,900, holding modest gains but remaining confined within a broader consolidation range after failing to retake the late-January highs around 26,300.
Daily price action appears uneven, with a series of lower highs forming since the recent peak, indicating that upward momentum has moderated.
The index is currently positioned just beneath the 20-day moving average (25,235) and the 30-day moving average (25,326), while the shorter-term 5-day (24,776) and 10-day (24,934) averages are flattening.
This configuration points to a neutral-to-soft bias, as the market struggles to generate sustained upside continuation. Immediate resistance lies within the 25,200–25,300 range, where several moving averages converge. Near-term support is located around 24,350, followed by the November swing low region near 23,850.
A clear break above 25,300 would indicate a revival of bullish momentum and reopen the route towards 26,000 and higher. Conversely, an inability to reclaim that area may leave the index range-bound, with downside pressure building should 24,350 fail to hold.
Cautious Outlook
While resilient US economic data continue to underpin risk assets, rising yields and uneven bond demand suggest markets remain attentive to inflation and policy uncertainties. The next decisive move is likely to depend on whether economic strength can persist without triggering renewed inflationary pressures.
In January, Australia’s full-time employment eased to 50.5K from 54.8K in the previous month
Australia’s full-time employment rose by 50.5K in January. This was lower than the 54.8K increase in the previous period.
This means full-time job growth slowed compared with last month. No other figures were included in the release.


