Back

In February, South Korea’s foreign exchange reserves increased to 427.62B, up from 425.91B previously

South Korea’s foreign exchange reserves rose to $427.62bn in February. This was up from $425.91bn in the previous month. The month-on-month increase was $1.71bn. The figures refer to South Korea’s total FX reserves for February. We see that South Korea’s foreign exchange reserves rose to $427.62 billion in February, giving the central bank a larger cushion to manage currency fluctuations. This increase suggests a stable hand is available to support the Korean Won against any sharp, speculative moves. For traders, this signals that the Bank of Korea has ample firepower to prevent excessive currency weakness in the coming weeks. This reserve build-up is happening alongside very strong economic data. Recent reports for February 2026 showed South Korean exports jumped over 15% year-over-year, driven by a remarkable 45% surge in semiconductor sales. This fundamental strength from trade surpluses provides a solid backbone for the Won, suggesting the higher reserves are not just from borrowing but from real economic activity. Given this enhanced stability, we believe implied volatility in the USD/KRW options market may be too high. Selling options to collect premium could be an attractive strategy, as the central bank’s large reserve buffer is likely to dampen any extreme price swings. Looking back, this is a stark contrast to the volatile periods we experienced in mid-2025 when global rate uncertainty caused significant market turbulence. The external environment is also becoming more favorable for the Won. With the U.S. Federal Reserve widely expected to hold interest rates steady at its upcoming March meeting, a key source of strength for the U.S. dollar has been neutralized for now. This removes a major headwind for the Won and supports the case for a more range-bound or slightly stronger Korean currency. Therefore, traders might consider positioning for a stable-to-stronger Won over the next few weeks. This could involve using forward contracts to bet on a lower USD/KRW exchange rate or adjusting currency hedges to reflect reduced risk of Won depreciation. The combination of strong local fundamentals and a benign global monetary policy outlook makes aggressive bets against the Won seem particularly risky at this moment.

Start trading now – Click here to create your real VT Markets account

Oil Climbs as Strait of Hormuz Disruption Tightens Supply

Key Points

  • Brent crude rose $1.67, or 2.05%, to $83.07 per barrel, while U.S. West Texas Intermediate gained $1.94, or 2.60%, to $76.60.
  • Shipping through the Strait of Hormuz has nearly halted for the fifth day, with about 329 oil vessels stuck in the Gulf.
  • Iraq cut output by nearly 1.5 million barrels a day, while Qatar declared force majeure on gas exports, potentially disrupting energy supply for at least a month.

Oil prices pushed higher on Thursday as the widening conflict between the United States and Iran continued to disrupt flows through the Middle East. Brent crude rose $1.67, or 2.05%, to $83.07 per barrel by 0141 GMT, while U.S. West Texas Intermediate climbed $1.94, or 2.60%, to $76.60.

The move reflects growing anxiety in the energy market after shipping through the Strait of Hormuz, one of the world’s most critical energy corridors, slowed to a near halt.

The route normally carries close to one-fifth of global energy consumption, which makes even short disruptions highly sensitive for traders and governments.

Markets also reacted to the expansion of the U.S.–Iran war. On Wednesday, a U.S. strike hit an Iranian warship off Sri Lanka, and U.S. Senate Republicans voted against a bipartisan resolution that aimed to stop the air war and require Congress to authorise hostilities.

This political backing signals that the military campaign could continue in the near term.

If tensions persist, traders may continue to price a geopolitical premium into crude. However, the market still watches how long the disruption lasts. Short conflicts often lead to fast spikes that fade once shipping resumes.

Hormuz Blockage Creates Immediate Supply Bottleneck

Shipping through the Strait of Hormuz has ground to a near halt for the fifth day, creating a sudden bottleneck for energy exports. J.P. Morgan estimates that about 329 oil vessels are stuck in the Gulf, unable to safely move cargo through the narrow channel.

Security concerns remain high after Britain’s maritime trade operations agency reported a large explosion heard and seen by the master of a tanker anchored 30 nautical miles southeast of Kuwait’s Mubarak Al Kabeer. A small craft was later seen leaving the area, adding to fears that commercial vessels may become targets.

Even though Iran has avoided striking most major energy infrastructure so far, shipping risk remains elevated. Traders often respond to such risks by bidding up crude futures to secure supply, which partly explains the current rally.

If the blockage continues, refiners in Asia and Europe may face delayed shipments. That scenario could tighten physical markets and push prices further upward in the short term. If naval patrols reopen the route quickly, price pressure may ease.

Production Cuts Compound Supply Pressure

At the same time, production disruptions across the region have reduced the buffer normally available during geopolitical crises.

Iraq, the second-largest crude producer in OPEC, has cut output by nearly 1.5 million barrels a day due to storage shortages and the lack of a viable export route. With exports constrained, producers cannot move crude even if wells remain operational.

Meanwhile, Qatar declared force majeure on gas exports, with sources indicating that a return to normal production volumes may take at least a month. Qatar remains the largest liquefied natural gas producer in the Gulf, so any prolonged halt may tighten global gas markets as well.

These developments arrive at a time when energy inventories in several regions already sit near seasonal averages. Reduced output combined with blocked shipping could create short-term shortages in some markets, which would support oil prices if the situation drags on.

Technical Analysis

WTI crude oil (CL-OIL) is trading near $76.97, up around 1.17%, extending the strong upward momentum that has been building since the December low near $54.87. The daily chart shows a clear bullish trend, with price continuing to print higher highs and higher lows while accelerating into the upper range of the recent rally.

From a technical perspective, price is trading well above its key moving averages. The 5-day moving average (73.22) and 10-day (69.57) are rising sharply, while the 20-day (66.77) and 30-day (65.61) remain significantly below the current price level.

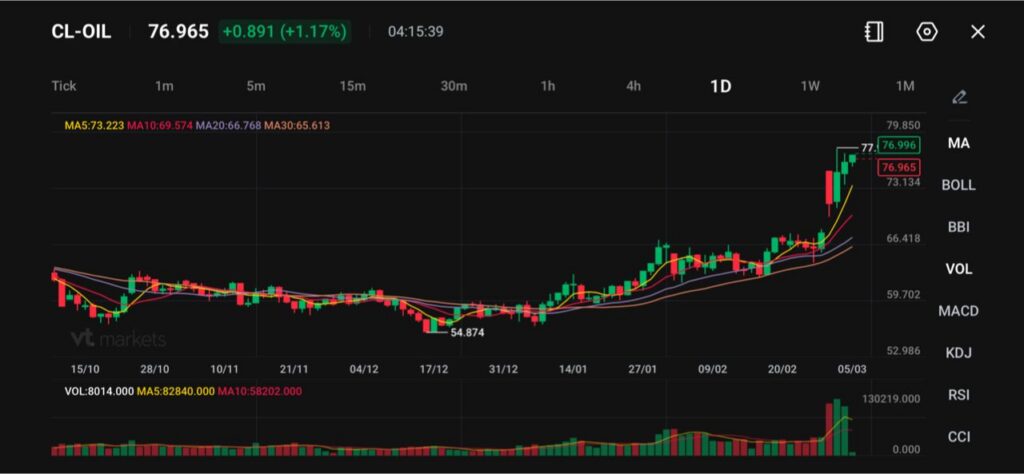
This widening spread between price and the longer-term averages reflects strong bullish momentum following the breakout above the $70 area.

Immediate resistance is seen around $77.50–$78.00, where the latest rally is approaching a short-term ceiling. A sustained break above this zone could open the path toward $79.80–$80.00, a key psychological and technical level.

On the downside, initial support is located near $73.00–$74.00, followed by stronger structural support around $70.00, where the short-term moving averages are clustered.

Overall, the trend remains constructive while prices hold above the $73–$74 region, though the sharp upward move may invite periods of consolidation before the next directional push.

Learn more about trading Energies on VT Markets here.

Frequently Asked Questions (FAQs)

  1. Why Did Oil Prices Rise Today?
    Oil rose because traders priced in supply risk from the U.S.–Iran war and the shipping slowdown through the Strait of Hormuz. Brent moved up $1.67, or 2.05%, to $83.07 per barrel, while WTI rose $1.94, or 2.60%, to $76.60. When a key export corridor slows, markets often pay more for near term supply.
  2. How Important is the Strait of Hormuz to Global Energy Supply?
    The Strait of Hormuz matters because it acts as a core pipeline for energy trade. It serves as a key conduit for nearly a fifth of global energy consumption. If shipping “nearly halts” for multiple days, buyers may face delays, and prices can rise fast as refiners compete for cargoes.
  3. What Does It Mean That Shipping Has Nearly Halted for the Fifth Day?
    It means fewer tankers can move oil and fuel out of the Gulf on schedule. J.P. Morgan estimates about 329 oil vessels are stuck in the Gulf, which suggests a growing queue of delayed shipments. If this lasts, spot prices and freight costs can rise, and volatility often increases.
  4. How Do Iraq’s Output Cuts Affect Oil Prices?
    Iraq cutting output reduces available supply in a market already dealing with logistics risk. Officials said Iraq cut output by nearly 1.5 million barrels a day due to limited storage and export routes. Less supply can tighten prompt crude balances and keep prices supported if demand stays steady.
  5. What Does Qatar Declaring Force Majeure Mean for Energy Markets?
    Force majeure means Qatar says it cannot meet some contract obligations due to circumstances outside its control. Qatar, the biggest LNG producer in the Gulf, declared force majeure on gas exports, and sources said normal production volumes may take at least a month to return. That can tighten LNG supply and sometimes lifts crude sentiment too, since fuel markets are linked.

Start trading now – Click here to create your real VT Markets account

Standard Chartered’s Hunter Chan and Shuang Ding anticipate resilient China data despite weak official PMI sentiment signals

Standard Chartered’s Hunter Chan and Shuang Ding expect China’s January–February activity data to remain resilient despite weaker official PMIs. They forecast solid industrial output, a rebound in retail sales, and robust trade growth, while fixed asset investment stabilises and real estate investment keeps contracting. China’s official manufacturing PMI fell to 49 in February, down from 49.3 in January, reaching a five-month low. The decline was linked in part to disruption from the Lunar New Year holiday period.

Hard Data To Stay Resilient

Industrial production growth is expected to stay steady at 4.9% year on year in January–February, with the production PMI averaging above 50. Retail sales growth is expected to rebound to 3.4% year on year, supported by holiday spending. Fixed asset investment is expected to stop contracting as infrastructure funding is replenished at the start of the year. Trade growth is expected to stay robust due to lower tariffs and steady global demand for AI-related materials and products. Inflation is expected to rise modestly, while M2 growth remains elevated and credit momentum eases. The article was produced using an AI tool and reviewed by an editor. The recent official manufacturing PMI data for February, coming in at a soft 49.5, is creating a familiar sense of unease. This mirrors the situation we saw in early 2025 when the PMI also dropped to 49, sparking concerns that were later offset by surprisingly strong hard data. We should therefore be cautious about overreacting to sentiment indicators alone before the full activity reports are released. Looking back to the January-February period of 2025, industrial production grew a solid 4.9% even as the PMI figures looked weak. With copper prices currently pulling back slightly to around $9,500 per tonne on the latest PMI news, a similar pattern this year could present an opportunity. Traders might consider call options on industrial commodities, anticipating that underlying factory output, especially for AI-related products, will again outperform the sentiment.

Trading Implications For Volatility

We also saw retail sales rebound to 3.4% growth in early 2025, boosted by the Lunar New Year holiday. This year, holiday travel and spending data showed a 5.3% year-on-year increase, a solid figure that nonetheless fell short of some of the more optimistic forecasts, thus failing to lift market spirit. This environment could be favorable for selling cash-secured puts on major China-focused ETFs, capitalizing on high fear while betting that consumer activity is fundamentally stable. The disconnect between sentiment and reality that we observed last year, particularly with fixed asset investment stabilizing while real estate remained weak, often leads to higher implied volatility. The Cboe VIX Index has seen a slight uptick to 14.5, reflecting this uncertainty. This suggests that selling volatility through strategies like short strangles on broad indices could be profitable if, like in 2025, the actual economic data once again calms an overly nervous market in the coming weeks. Create your live VT Markets account and start trading now.

Start trading now – Click here to create your real VT Markets account

Fed’s March 2026 Beige Book reports uneven expansion, persistent price pressures, and five districts flat or declining

The Federal Reserve’s March 2026 Beige Book, using information gathered through 23 February, reported mixed economic conditions across districts. Seven of the 12 districts recorded slight to moderate growth, while the number reporting flat or declining activity rose from four to five. Most districts expected slight to moderate growth over the coming months. Prices increased moderately overall, with eight districts reporting moderate price growth and four reporting slight or modest increases.

Wages And Cost Pressures

Wages rose at a modest or moderate pace in most districts, linked to competition for workers. The report noted ongoing cost pressures alongside uneven growth. The Federal Reserve aims for price stability and full employment, mainly by changing interest rates. It may raise rates when inflation is above its 2% target, and lower rates when inflation is below 2% or unemployment is too high. The Fed holds eight policy meetings each year through the Federal Open Market Committee. The FOMC includes 12 officials: seven Board of Governors members, the New York Fed president, and four of the remaining 11 regional bank presidents on rotating one-year terms. Quantitative Easing increases credit by expanding bond purchases and was used during the 2008 crisis. Quantitative Tightening ends bond buying and allows holdings to mature without reinvestment.

Market Implications And Positioning

The latest Beige Book shows a tricky situation with slowing growth in some areas but persistent price pressures everywhere else. The latest Consumer Price Index (CPI) report for January 2026 showed a year-over-year increase of 3.4%, stubbornly above the Fed’s 2% target. This suggests we should reconsider bets on near-term Federal Reserve rate cuts, as policymakers will likely remain cautious. Competition for workers is keeping wages firm, a point reinforced by the recent February jobs report which added a solid 210,000 jobs. With wage growth still hovering around 4.1% annually, the “higher for longer” interest rate story gains strength. This environment should continue to support the US Dollar, making long dollar positions through options or futures attractive. The divide between growing and stalling districts creates uncertainty for equity markets, which typically dislike mixed signals. We saw similar uncertainty create volatility spikes back in late 2025. Traders might consider buying put options on major indices as a hedge or look at strategies that profit from rising volatility, like purchasing VIX call options. Given this data, we believe the Fed will stay on hold at its next meeting, waiting for more conclusive evidence of a slowdown. The market’s optimism for rate cuts later this year might be premature, creating opportunities in interest rate futures. We will be closely watching upcoming inflation and employment data to confirm this stance. Create your live VT Markets account and start trading now.

Start trading now – Click here to create your real VT Markets account

Despite strong US jobs and services data, the dollar softened as US-Iran conflict dampened market sentiment

The US Dollar eased on Wednesday after a two-day rise pushed the US Dollar Index (DXY) near 100.00, before it fell towards 98.80. February ADP Employment Change was 63K versus 50K expected, and January was revised to 11K from 22K. February ISM Services PMI came in at 56.1, compared with 53.5 expected and 53.8 previously. Market attention also centred on escalating attacks involving the United States, Israel and Iran.

Major Currency Moves

EUR/USD traded near 1.1640 as Eurozone January PPI rose 0.7% month-on-month, versus 0.2% expected and -0.3% previously. GBP/USD hovered around 1.3370, while rates pricing for a Bank of England cut shifted from 74% to 25% following higher oil prices. USD/JPY traded near 157.00 and AUD/USD around 0.7070 ahead of Australia’s January Trade Balance. Gold traded at $5,149, while oil held near 74.10 after a $77 peak, following Iranian forces seizing the Straight of Hormuz, affecting Asia’s oil trade. Next data includes Australian Trade Balance, Eurozone Retail Sales, US Challenger Job Cuts, Initial Jobless Claims, and US productivity and labour costs. Friday brings Germany Factory Orders, Eurozone employment and GDP, plus US NFP, Retail Sales, and the Unemployment rate. Central banks added 1,136 tonnes of gold worth about $70 billion in 2022, the highest annual purchase on record. Gold often moves inversely to the US Dollar, US Treasuries, and risk assets. The date today is 2026-03-05T02:51:22.689Z.

Looking Back One Year

We remember this time last year when the US-Iran conflict showed that strong US economic data, like the ADP and ISM reports, can become irrelevant. Market sentiment was driven entirely by geopolitical fears, pushing the US Dollar down even with positive numbers. This serves as a key reminder that headline risk can instantly override fundamentals. The seizure of the Strait of Hormuz in 2025 sent oil prices spiking to $77, which we now know was the peak of the crisis. While tensions have eased, WTI crude is currently trading around a volatile $85 per barrel as of March 2026, reflecting a persistent risk premium in global supply chains. This elevated base price continues to influence inflation expectations for all major economies. Gold’s role as a safe haven was clear when it hit $5,149 an ounce during the peak of last year’s turmoil. Today, it has settled near $4,800, with much of that price floor supported by continued central bank buying, which saw a net increase of over 950 tonnes in 2025. This shows that institutional players are still hedging against underlying instability. A year ago, the Dollar Index (DXY) fell to 98.80 as the US was a direct party to the conflict. Now, with a fragile peace in place, the DXY is trading much stronger around 104.50, driven by the Federal Reserve’s focus on inflation, which clocked in at a stubborn 3.1% year-over-year for February 2026. This pivot means that interest rate expectations are firmly back in the driver’s seat for the dollar. Consequently, we see interest rate differentials dominating currency pairs once again. The USD/JPY has pushed up to the 162.00 region, far from the 157.00 level seen during the dollar’s weakness in March 2025. Similarly, with the oil shock abated, GBP/USD has fallen to around 1.2550 as the Bank of England’s focus returns to sluggish domestic growth. Create your live VT Markets account and start trading now.

Start trading now – Click here to create your real VT Markets account

As safe-haven demand wanes, the Dollar Index drops 0.18%, ending near 98.90 after five-week peak retreat

The US Dollar Index (DXY) fell about 0.18% on Wednesday to near 98.90, after reaching 99.68 on Tuesday. It rose nearly 2% across Monday and Tuesday, then eased as demand cooled. DXY has rebounded from the late-January low near 95.56. Two strong daily gains early in the week pushed it above the 200-day EMA for the first time since late November.

Geopolitical Tensions And Shipping Risks

Fighting between the US, Israel and Iran reached its fifth day on Wednesday, with casualties rising. Iran’s Revolutionary Guard said the Strait of Hormuz was closed to shipping. Oil prices climbed to their highest levels since mid-2025, adding inflation concerns. This affects expectations for Federal Reserve policy. US data were mixed: ADP jobs were 63K in February versus a 50K consensus. ISM services PMI rose to 56.1 versus a 53.5 forecast, while prices paid eased to 63 from 66.6. Focus now shifts to Thursday’s jobless claims and productivity, and Friday’s Nonfarm Payrolls. Consensus expects 59K jobs versus January’s 130K.

Technical Levels And Market Focus

On the daily chart, DXY spot was 98.82. Support sits near 97.95, then 97.60 and 96.90; resistance is around 98.70–98.75, then 99.05. We are looking at a very different picture today, March 5th, 2026, than what we saw this time last year. We remember how the US Dollar Index surged toward 99.70 in early March 2025 following the conflict in the Gulf, which sent oil prices soaring. That safe-haven bid was intense but cooled quickly, showing how geopolitical shocks can create volatile, two-way action. The backdrop today is less explosive, which changes how we should approach volatility. While tensions in the South China Sea keep a floor under the dollar, we aren’t seeing the kind of panic that closed the Strait of Hormuz in 2025. Crude oil is trading near a stable $81 per barrel, a stark contrast to the spike above $110 we saw last year that fueled major inflation fears. This stability is reflected in the economic data, giving the Federal Reserve a much clearer path. We just saw a strong 275,000 jobs added in the last Nonfarm Payrolls report, far healthier than the weak 59,000 consensus estimate that worried the market in March 2025. With the latest CPI data showing inflation moderating to 2.8%, the Fed is not being forced into a corner by a sudden price surge. Given this lower geopolitical temperature, implied volatility on dollar options is considerably lower than it was during the 2025 crisis. This makes it cheaper to establish positions to hedge against unexpected moves or to speculate on a breakout. With the DXY currently hovering around 103.80, buying calls with a 105 strike or puts below the 102 support level presents a cost-effective strategy. The market’s focus has shifted from geopolitical bombshells to economic data points. With CME Group’s FedWatch Tool showing a 92% probability that the Fed will hold rates steady at its next meeting, upcoming jobless claims and NFP reports will be the primary drivers of short-term dollar direction. This suggests that trading short-dated options around these data releases could be more effective than positioning for a larger, shock-driven event like we saw last year. Create your live VT Markets account and start trading now.

Start trading now – Click here to create your real VT Markets account

Notification of Trading Adjustment – Mar 05 ,2026

Dear Client,

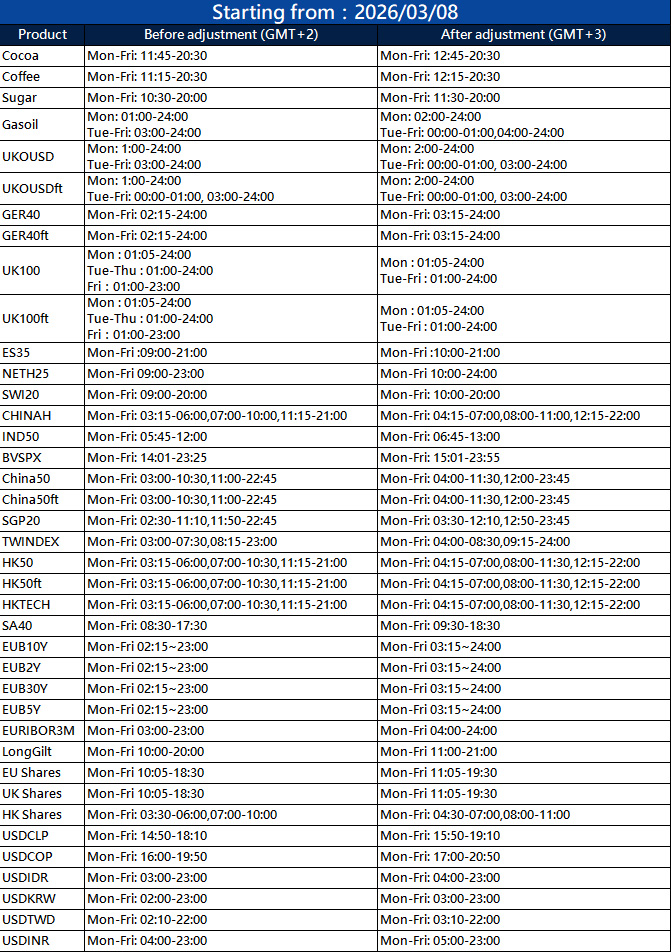
The trading hours of some MT4/MT5 products will change due to the upcoming Daylight-Saving Time change in US.

Please refer to the table below outlining the affected instruments:

Notification of Trading Adjustment

System time will be adjusted from winter time GMT+2 to daylight saving time GMT+3.

The above information is provided for reference only; please refer to the MT4/MT5 software for specific data.

If you’d like more information, please don’t hesitate to contact [email protected]

Fintech in Mexico: Economic stability and expansion in 2026

  • The fintech ecosystem in Mexico continues to mature, reflected in 131 new jobs

Mexico is entering an economic landscape that reflects both strengths and challenges. Macroeconomic stability remains moderate, with GDP growth projections between 1.2% and 1.5%, low formal unemployment, and an exchange rate of less than 18 pesos per dollar. However, inflation has shown a slight acceleration, reaching 3.77% in the first half of January, which calls for greater vigilance in monetary policies.

Fintech sector dynamics

Mexico’s fintech ecosystem continues to mature, focusing on digital payments, crypto assets, and innovative Defi solutions that respond to the demand for financial inclusion. In 2025, 131 new ventures were registered, contributing to growing revenues and an expanding market, in which regulation and technology adoption play a key role. This growth positions Mexico as a regional hub, attracting investment and specialized talent in a predictable but cautious economic environment.

Money Expo Mexico 2026

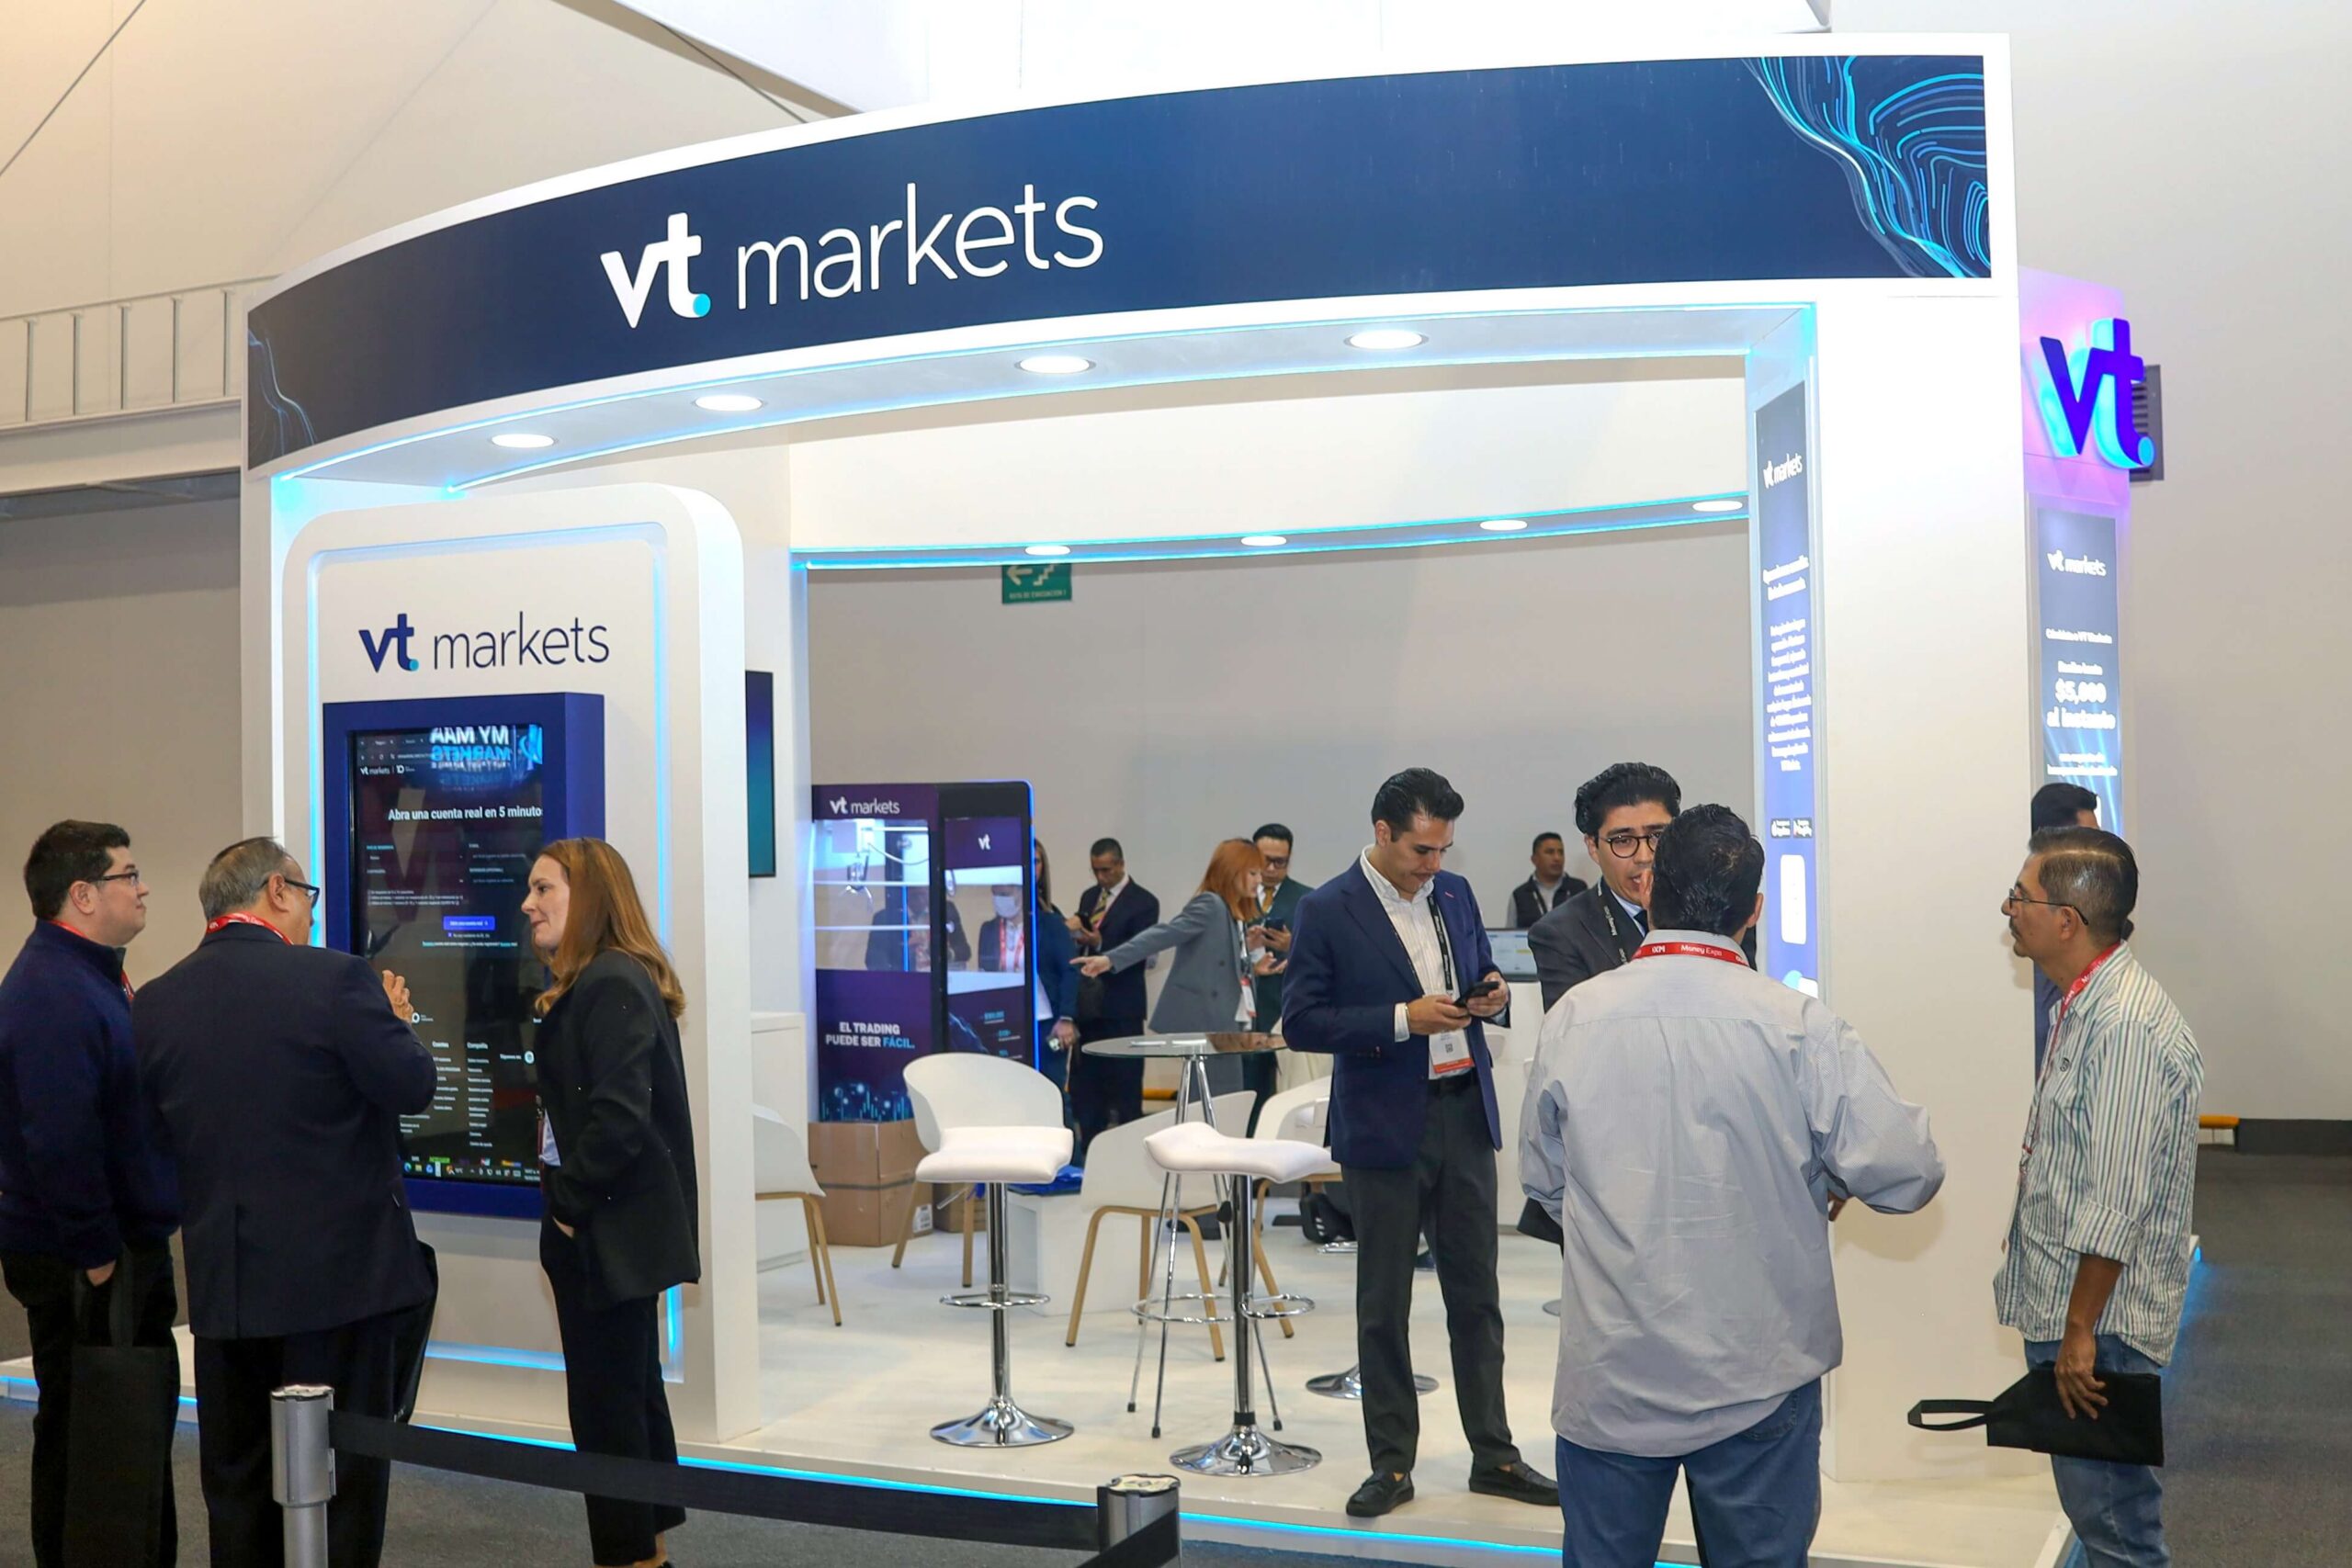
This event is celebrating its fourth edition on February 18 and 19 at the Banamex Center, establishing itself as the most important financial event for trading, investment, fintech, and blockchain in the country. In a context of regional fintech growth, it offers workshops, market analysis, and B2B opportunities for professionals and institutions.

VT Markets returns after participating in the inaugural edition in 2023, highlighting its commitment to the global financial community. This year, it intensified its presence with two activities led by Eduardo Romero, senior market analyst, on the first day, with a round table discussion entitled “Preparing for the future: what will really change the markets in 2026?”; and a presentation on the second day of the event, entitled “The new trading game: how professionals operate in highly uncertain markets.”

Since last year, with Donald Trump’s presidency, we’ve seen a series of aggressive trade measures that have increased market volatility and kept investors and traders on constant alert. High-profile issues like the political situation between Iran and the United States trigger market movements,says Eduardo Ramos, Senior Market Analyst at VT Market.

As an investor, navigating market uncertainty can be a constant challenge. Therefore, Eduardo Ramos, drawing on his expertise, emphasizes that “stability coexists with periods of uncertainty; the difference lies not in predicting the market, but in operating with a solid method for reading and analyzing data.”

This participation underscores the collaboration with industry professionals in a rising fintech hub such as Mexico.

They assess whether a March NASDAQ 100 peak is unlikely, citing pre-election years’ average patterns historically

A prior February 11 update said that in pre-election years the NASDAQ 100 typically bottoms on 5 February, peaks around 15 February, dips towards 21 February, then rises to a 18 March high before falling until October. It also set an Elliott Wave downside area of 24,200 ± 200. The index bottomed on 5 February, peaked on 11 February, then made another low on 17 February, followed by a secondary high on 25 February. It then fell to its lowest level since the November 2025 low after joint military operations in Iran, but later erased Monday’s losses. The 24,200 ± 200 target zone was met at the 24,315 low. Price is described as being at the same level as five months ago. The broader Elliott Wave count still points to about 26,600 for the red W-b, provided the index stays above warning levels. The text states daily moves can be noisy, with weekly giving structure and monthly setting the trend. The 26,600 area is calculated as 161.8% of the 2020-2021 rise: W-1 from 6,772 to 16,765 (9,993 points), W-2 at 10,440 on 13 October 2022, and W-3 target 10,440 + 9,992 × 1.618 = 26,608. Warning levels listed are 24,992, 24,795, 24,637, 24,497, and 24,315. As of today, March 5, 2026, we see the NASDAQ 100 has recovered strongly from the market’s reaction to the joint military operations in Iran. The index hit our target low of $24,315 and bounced, suggesting the immediate selling pressure is over. This price action reinforces the view that the market is setting up for one final rally. For the next few weeks, the primary strategy is to position for an upward move toward the $26,600 target. With the CBOE Volatility Index (VIX) retreating back under 16 after last week’s geopolitical spike, call options expiring in late March or mid-April have become more attractively priced. This short-term bullish outlook remains valid as long as the index holds above its recent lows. However, we must view this potential rally with caution, as it fits the historical pattern of a deceptive peak before a significant decline. We saw a similar setup in February 2020, when the market pushed to a new all-time high right before a sharp C-wave sell-off. These irregular B-waves are designed to draw in final buyers before the trend reverses. Therefore, as the index approaches the $26,600 level, traders should begin planning for the other side of the trade. The latest economic data showing core inflation remaining persistent at 3.6% could provide the fundamental reason for a market turn. Cautious traders might start buying longer-dated put options, for May or June, to prepare for a substantial drop. Strict risk management is essential, and the key warning levels must be respected. Any sustained break below the $24,992 and $24,795 supports would signal that the expected final rally is off the table. A move below Monday’s low of $24,315 would invalidate the entire bullish short-term structure.

Start trading now – Click here to create your real VT Markets account

Amid a broad US Dollar pullback, the New Zealand Dollar drove NZD/USD up 0.73% to 0.5940

NZD/USD rose about 0.73% on Wednesday to around 0.5940, with the New Zealand Dollar leading major currencies. The pair had dipped below the 50-day EMA earlier, with a low near 0.5860 close to the 200-day EMA, after January lows near 0.5710 and a February peak near 0.6090. The RBNZ kept the Official Cash Rate at 2.25% in February, and markets shifted expected timing for a first rise to December at the earliest. The RBA lifted its rate to 3.85% in February, and GBP/NZD fell 0.82% on the session. US data were mixed, with ADP jobs at 63K versus a 50K forecast. ISM services PMI rose to 56.1 versus 53.5, while the prices paid index eased to 63 from 66.6. Friday’s Nonfarm Payrolls are forecast at 59K for February versus 130K in January. Retail sales are expected to be flat after a 0.3% fall. NZD/USD was near 0.5940, with EMAs around 0.5920 (50-day) and 0.5880 (200-day). Support levels were cited at 0.5920, 0.5890 and 0.5880, with resistance at 0.5990, 0.6050 and 0.6100. Looking back a year ago, in early 2025, we saw the Reserve Bank of New Zealand holding its rate at a low 2.25% with no rush to hike. Today, the situation is vastly different, as that dovish stance has been completely reversed following a period of persistent inflation. The NZD/USD is now trading near 0.6250, a significant climb from the 0.5940 level seen at that time. The RBNZ has since raised the Official Cash Rate multiple times to its current level of 3.75% to fight inflation, which registered a stubborn 4.2% year-over-year in the last quarter of 2025. This contrasts sharply with the US Federal Reserve, which is widely expected to begin an easing cycle in the second half of this year. This growing rate differential continues to provide a strong tailwind for the Kiwi dollar. The US jobs market is no longer the headwind for the NZD/USD that it was in early 2025, when a meager 59,000 jobs were anticipated for February. The most recent report for February 2026 showed a healthier, but not inflationary, gain of 190,000 jobs. This solidifies the market’s view that the Fed has room to cut rates later this year as inflation continues to cool, further weighing on the US Dollar. For derivative traders, this environment suggests selling downside protection on the NZD/USD may be a viable strategy. Selling out-of-the-money put options with expirations in the next one to two months could allow traders to collect premium, capitalizing on the pair’s underlying strength. This view holds as long as the pair remains above its key technical support levels. However, we must remain mindful of external risks that were present a year ago and persist today. China’s economic recovery remains uneven, with the latest Caixin Manufacturing PMI barely in expansionary territory at 50.9, which could limit demand for New Zealand’s exports. While the Global Dairy Trade Price Index has stabilized around $3,600/MT, it is not providing a fresh catalyst for a major rally. From a positioning standpoint, the pair is trading comfortably above its 200-day moving average, which now acts as support near 0.6100. Traders might consider using this level as a reference point for structuring bullish trades, like call spreads, to target a retest of the year-to-date highs around 0.6310. Any break below that key moving average would require a swift reassessment of this positive outlook.

Start trading now – Click here to create your real VT Markets account

Back To Top
server

Hello there 👋

How can I help you?

Chat with our team instantly

Live Chat

Start a live conversation through...

  • Telegram
    hold On hold
  • Coming Soon...

Hello there 👋

How can I help you?

telegram

Scan the QR code with your smartphone to start a chat with us, or click here.

Don’t have the Telegram App or Desktop installed? Use Web Telegram instead.

QR code