EUR/USD holds below 1.1850 near its nine-day EMA as RSI at 53 signals mild upside consolidation
EUR/USD fell for a second session and traded near 1.1840 in early European trading on Tuesday. The 14-day RSI is 53. This is neutral, with a slight upside tilt.
On the daily chart, the pair is still above the rising 50-day EMA. The nine-day EMA is flat and sits above the current price. The nine-day EMA also remains above the 50-day EMA, which supports the near-term outlook.
BBH’s Elias Haddad says sterling lagged after weak Q4 UK GDP fuelled expectations of further BoE cuts
Sterling fell after weak UK Q4 GDP data increased expectations of more Bank of England rate cuts. Markets are pricing a 74% chance of a 25 bps cut to 3.50% at the 19 March meeting, and almost 50 bps of easing over the next 12 months.
This week’s UK labour and inflation data will be closely watched for policy clues and near-term GBP moves. The unemployment rate is expected to hold at 5.1% for a third month in December. Private sector regular pay is forecast to slow to 3.4% year on year, down from 3.7% in November and the lowest since November 2020.
Inflation Data In Focus
Headline CPI is expected to ease to 3.0% year on year from 3.4% in December, mainly due to lower utility prices. Core CPI is also seen at 3.0% from 3.2%. Services CPI is forecast at 4.3% from 4.5%, which would be the lowest since March 2022. UK January retail sales and February PMI data, both due on Friday, should provide a fresh read on current economic activity. The Pound is underperforming after weak UK growth data for Q4 2025 reinforced our view that the economy is slowing. Markets are now pricing an 80% probability of a Bank of England rate cut at the March 20 meeting. This is similar to early 2025, when weaker data drove higher expectations for policy easing. With key labour and inflation releases due next week, volatility is likely to increase. One-month implied volatility on GBP/USD options has already risen from 6.8% to 7.9% in February. This suggests traders are preparing for larger price swings. In this setting, option strategies may be more attractive than simple directional trades in the cash market.Strategy For A Weaker Pound
We think the more cautious way to position for a weaker pound is through derivatives. Buying GBP put options, or using bearish put spreads, can benefit from a decline while keeping risk defined. In the similar 2025 setup, this approach worked well for traders who positioned before the central bank confirmed a more dovish shift. Still, traders should watch for unexpectedly strong data, especially in the retail sales and PMI reports. February’s flash PMI showed a small surprise improvement in services. If positive surprises continue, markets could quickly scale back rate-cut expectations and the pound could rise sharply. Create your live VT Markets account and start trading now.The rupee opens flat near 90.80 against the dollar ahead of US-Iran talks and FOMC minutes
The Indian Rupee opened flat on Tuesday, near Monday’s low of about 90.80 per US Dollar. USD/INR stayed mostly steady. Importer demand supported the pair, but worries about possible Reserve Bank of India (RBI) intervention capped gains.
Foreign Institutional Investors (FIIs) were net sellers in February, cutting holdings by Rs. 2,345.69 crore. On Monday alone, FIIs sold shares worth Rs. 972.13 crore.
Markets looked ahead to a second round of US-Iran talks in Geneva. Oil prices were in focus, especially if the talks fail. Because India imports most of its oil, higher energy costs could weaken the Rupee.
The US Dollar traded in a narrow range after a long US weekend. This kept USD/INR range-bound as well. The US Dollar Index was flat near 97.15.
Focus also shifted to Federal Reserve rate expectations. CME FedWatch showed no rate cut priced in for March or April. US inflation cooled in January, with headline inflation at 2.4% year on year and core inflation at 2.5%.
Key US releases this week include the January FOMC minutes and the first estimate of Q4 GDP. In January, the Fed held rates at 3.50%–3.75% and signaled it needs clearer progress before cutting further.
USD/INR traded near 90.9035, slightly above the 20-day EMA at 90.8822. The 14-day RSI was 51.19. Key levels: 90.00 on the downside and 91.25 on the upside.
USD/INR is showing a familiar sideways pattern, similar to the consolidation seen around this time last year. The pair is stuck between steady dollar demand from importers and the market’s memory of past RBI intervention. As a result, the trading range is tight, and near-term directional trades carry more risk.
Looking back, the weak foreign investor sentiment seen in early 2025 became a full-year trend. FIIs pulled nearly ₹1.8 lakh crore out of Indian equities in 2025. In 2026 so far, there has been a small net inflow of about ₹12,000 crore. Still, traders should stay cautious because this recovery remains fragile. A return to heavy outflows could quickly weaken the rupee.
Oil remains a key risk for the rupee. After last year’s US-Iran talks failed to produce a lasting deal, Brent crude stayed high and averaged about $94 per barrel in Q4 2025. Geopolitical tensions need close monitoring, because any jump in energy prices would likely add direct pressure on the rupee.
One major change from early 2025 is the outlook for US monetary policy. Last year, markets expected the Fed to stay on hold. Now, expectations point to at least two rate cuts in 2026, with the first possibly in June. This more dovish outlook could limit overall dollar strength and offer some support to the rupee.
It is also important to remember that the RBI defended the 92.00 level aggressively through mid-2025, using foreign exchange reserves to limit volatility. Reserves are currently strong at about $640 billion. This gives the RBI room to intervene again if the rupee weakens too quickly. That makes shorting the rupee risky beyond key psychological levels.
With these forces offsetting each other, derivatives traders may prefer strategies that benefit from range-bound trading and low volatility. Selling out-of-the-money strangles on USD/INR could fit this setup over the next few weeks. The strategy works best if the pair stays inside a clear, stable channel.
Dividend Adjustment Notice – Feb 17 ,2026
Dear Client,
Please note that the dividends of the following products will be adjusted accordingly. Index dividends will be executed separately through a balance statement directly to your trading account, and the comment will be in the following format “Div & Product Name & Net Volume”.
Please refer to the table below for more details:
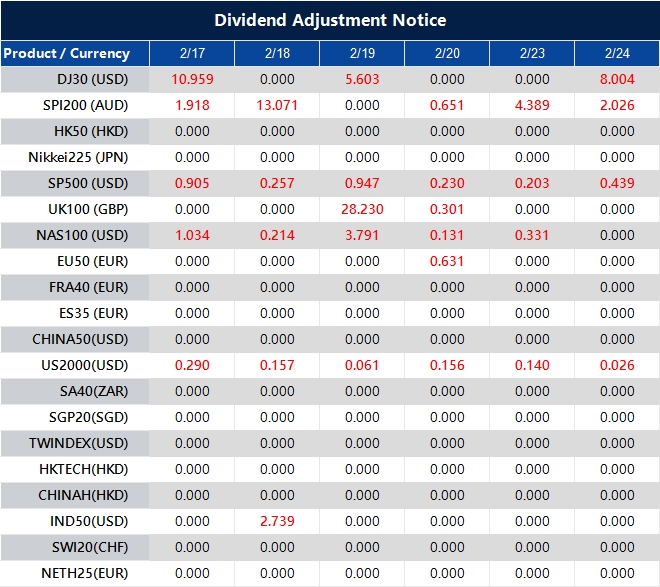
The above data is for reference only, please refer to the MT4/MT5 software for specific data.
If you’d like more information, please don’t hesitate to contact [email protected].
Compiled data shows gold prices in Pakistan declined today, with losses recorded as market figures indicate a fall.
Gold prices in Pakistan fell on Tuesday, according to FXStreet data. Gold traded at PKR 44,566.92 per gram, down from PKR 44,925.66 on Monday.
Gold also eased to PKR 519,826.10 per tola from PKR 524,004.20 the day before. Other listed rates were PKR 445,674.60 for 10 grams and PKR 1,386,221.00 per troy ounce.
Local Pricing Reference
FXStreet converts global gold prices into Pakistani rupees using USD/PKR and local units. Prices are updated daily at the time of publication and are for reference only, as local rates may differ. Central banks are the biggest holders of gold. They bought 1,136 tonnes worth about $70 billion in 2022, the largest yearly total since records began, according to the World Gold Council. Gold often moves in the opposite direction of the US Dollar and US Treasury yields. It can also move differently from riskier assets. Prices can react to geopolitics, recession worries, interest rates, and changes in the US Dollar because gold is priced in dollars (XAU/USD). Gold’s role as a safe-haven is growing as global uncertainty stays high. Ongoing concerns about a broad slowdown in early 2026 are pushing investors to reassess risk across portfolios. This backdrop keeps gold in focus for the weeks ahead.Key Market Drivers
A key support is strong buying by central banks. After record purchases in recent years, central banks added more than 1,050 tonnes to reserves in 2025. This steady official demand provides a firm base for the market. The US Federal Reserve has also signaled a clear pause in rate hikes. Because gold does not pay interest, it often performs better when rates level off or fall, since the cost of holding it drops. In the past, the end of a Fed hiking cycle has often been followed by strong gains in gold. This shift has also pressured the US Dollar, which has weakened from its late-2025 highs. Gold and the dollar often move in opposite directions. When the dollar falls, gold becomes cheaper for buyers using other currencies, which can lift demand. For derivatives traders, implied volatility in gold options may be too low compared with the chance of a large move. Long-dated call options or bull call spreads can offer a capital-efficient way to target upside while keeping risk defined if prices move sideways. This setup looks similar to prior post-tightening periods, when money moved out of slowing risk assets and into safe havens. With major equity indices showing signs of fatigue near highs, gold may be an attractive alternative in the weeks ahead. Create your live VT Markets account and start trading now.Traders keep NZD/USD near 0.6030 and below 0.6050, expecting the RBNZ to hold rates unchanged
NZD/USD traded near 0.6030 in Asian trading on Tuesday and remained below 0.6050. The New Zealand dollar stayed weak after the Food Price Index rose 2.5% month-on-month in January, the largest increase in four years.
Annual food inflation rose to 4.6% from 4.0% in December, with increases across all subgroups. Focus then shifted to the Reserve Bank of New Zealand meeting on Wednesday, where the cash rate is expected to stay at 2.25%.
Central Bank Policy Divergence
Some market pricing still points to possible rate hikes later in the year, including September and October. The pair also came under pressure from a stronger US dollar, which rose for a second straight session. Support for the US dollar eased after softer US CPI data for January increased expectations of Federal Reserve rate cuts later this year. Traders are watching the Fed meeting minutes, Q4 GDP, and the core PCE Price Index for more direction. US nonfarm payrolls in January posted the strongest gain in more than a year, and the unemployment rate fell unexpectedly. The PCE Price Index remained closer to 3% than the Fed’s 2% target, showing uneven disinflation since mid-2025. NZD/USD is now holding above 0.6180, a clear change from this time last year when it struggled below 0.6050. This shift reflects changing views on how New Zealand and US monetary policy may diverge. Market conditions today also differ sharply from the cautious tone of early 2025.Trading Strategy Considerations
In February 2025, the Reserve Bank of New Zealand held its cash rate at 2.25%, while traders prepared for possible hikes later that year. Now, with the official cash rate at 2.75%, the discussion has shifted to when the first rate cut may happen. New Zealand’s annual food inflation has cooled to 3.1% as of January 2026, down from 4.6% a year earlier. On the US side, the dollar’s outlook has also shifted, even if the core issue remains. In early 2025, the greenback stayed firm even as markets expected Fed cuts. Those cuts have since lowered the Fed Funds Rate to 4.0%. Still, with the latest PCE index at 2.7% and recent job reports showing a mild slowdown, the Fed’s next steps remain uncertain. For traders, this backdrop suggests paying more attention to relative policy moves than to outright direction. Options may be a good way to trade possible volatility, as both central banks are now leaning dovish. NZD/USD put options could help hedge against the RBNZ cutting rates faster than the Fed. Call options could benefit if US inflation stays stubborn and delays further Fed easing. Create your live VT Markets account and start trading now.FXStreet data shows India’s gold price fell compared with the previous session.
Gold prices fell in India on Tuesday, based on data compiled by FXStreet. Gold was priced at INR 14,474.46 per gram, down from INR 14,585.95 on Monday.
Gold dropped to INR 168,827.70 per tola from INR 170,127.60 a day earlier. Other listed prices were INR 144,745.00 for 10 grams and INR 450,213.40 per troy ounce.
India Gold Price Reference
FXStreet calculates India gold prices by converting international prices using USD/INR and local units. Prices are updated daily at the time of publication and are for reference only, as local rates may vary. Central banks hold the most gold and use it to manage reserves. They added 1,136 tonnes worth about $70 billion in 2022, according to the World Gold Council. This was the highest annual total since records began. Gold often moves in the opposite direction of the US Dollar and US Treasuries. It can also move against risk assets. Gold may rise when interest rates fall and weaken when borrowing costs rise. The recent dip in gold prices shows the impact of a stronger US dollar. The Dollar Index (DXY) has stayed firm, rising more than 2% since the start of 2026. This tends to pressure assets priced in dollars. Traders should watch this link closely.Trading Implications And Market Drivers
The stronger dollar is being driven by expectations that the US Federal Reserve will keep interest rates higher for longer than expected. Economic data from January 2026 showed inflation is still persistent. This has pushed back market expectations for rate cuts. Since gold does not pay interest, it can look less attractive when bonds and other yield-paying assets offer better returns. At the same time, gold still has strong support as a safe-haven asset. Ongoing geopolitical tensions are helping to hold prices up and are limiting the sell-off. If these conflicts intensify, investors could move quickly into safe assets, which could cause gold to jump. Central bank buying also continues to support the market. In 2025, central banks bought more than 800 tonnes of gold, and World Gold Council data suggests this demand is continuing into the first quarter of 2026. Steady buying like this can help absorb selling pressure. For derivatives traders, these mixed forces point to higher volatility in the weeks ahead. Strategies such as buying straddles or strangles may be appealing, since they can profit from a large move in either direction. On the other hand, higher implied volatility may also make selling options to collect premium attractive for traders who expect prices to stay range-bound. The latest pullback may also give longer-term traders a chance to take bullish positions at a lower cost. One approach is to buy long-dated call options. This can provide upside exposure if there is a geopolitical shock or a change in Fed policy, while limiting the amount of capital at risk upfront. Create your live VT Markets account and start trading now.Japan’s tertiary industry index fell 0.5% month on month in December, missing expectations for a 0.2% decline
Japan’s Tertiary Industry Index fell 0.5% month on month in December. This was worse than the expected 0.2% decline.
The index measures output in the services sector. The data shows a weaker monthly result than forecast.
Market Reaction And Growth Outlook
The December 2025 report on Japan’s services sector was a negative surprise for markets. It suggests domestic growth was already slowing by the end of last year. This adds to the view that Japan’s economy may struggle to gain momentum in the first quarter of 2026. This weakness makes it unlikely the Bank of Japan will tighten monetary policy soon. Inflation data from January 2026 already slipped to 1.9%, back below the central bank’s target. As a result, the yen may weaken further against the U.S. dollar, possibly retesting the 158 level seen in late 2025. In derivatives, this supports buying USD/JPY call options or taking long positions in futures. A weaker yen is also often supportive for Japanese stocks because it lifts the overseas earnings of large exporters. One approach is to buy call options on the Nikkei 225 index, as the currency boost may outweigh worries about slower domestic growth. Ongoing easy policy can also support Japanese Government Bonds (JGBs). Going long JGB futures may be attractive, since yields could stay low or fall if the economy continues to soften. The downside surprise also raises uncertainty, so buying options to gain exposure to higher market volatility can be a sensible hedge.Trade Positioning And Hedging
Create your live VT Markets account and start trading now.In Malaysia, gold prices stabilise after rising, with data indicating continued steadiness in current trading
Gold prices in Malaysia rose on Tuesday, according to FXStreet data. Gold was priced at -0.03 MYR per gram, the same as -0.03 MYR on Monday.
Gold was listed at -0.37 MYR per tola, unchanged from -0.37 MYR the day before. Other listed prices were 6,211.36 MYR for 10 grams and 19,319.43 MYR per troy ounce.
Fxstreet Pricing Methodology
FXStreet converts global gold prices into Malaysian Ringgit using USD/MYR and standard unit measures. Prices are updated daily at the time of publication and are for reference only, as local rates may differ slightly. Central banks hold the most gold. The World Gold Council says central banks bought 1,136 tonnes in 2022, worth about $70 billion. This was the biggest yearly purchase on record. China, India, and Turkey increased their reserves. Gold often moves in the opposite direction of the US Dollar and US Treasury yields. It can also move against risk assets like stocks. Key drivers include geopolitical risk, recession worries, interest rates, and changes in the US Dollar. Gold is priced in dollars (XAU/USD). Gold is widely seen as a safe-haven asset, especially in uncertain times. Central banks have continued the strong buying trend seen in 2025, building on record purchases from earlier years. This steady demand from official buyers—more than 1,037 tonnes added in 2023 alone—helps support prices.Fed Rates And Dollar Focus
Markets are now focused on what the Federal Reserve will do next, after the cautious rate cuts that began late last year. Because gold does not pay interest, it tends to look more attractive when investors expect rates to fall. In 2024 and 2025, persistent inflation kept rates higher for longer, which weighed on gold. The US Dollar also matters because gold is priced in dollars. The Dollar Index spent much of 2025 stuck in the 104–105 range, but it is now showing signs of weakening. A softer dollar makes gold cheaper in other currencies and can help push gold prices higher. Geopolitical tensions are still high and continue to drive uncertainty, which often supports gold. This suggests volatility may stay elevated, which is important for options traders. In 2025, spikes in the VIX were often linked to money flowing into gold-backed assets. For derivative traders, this may support strategies that benefit from a potential rise in price or bigger price swings. Buying call options is one way to gain from a possible price increase tied to falling rates and a weaker dollar. Volatility-based strategies may also work, since they can capture moves in either direction. Create your live VT Markets account and start trading now.Ahead of the FOMC minutes, gold slips again as the dollar rises and risk appetite improves
Gold fell for a second straight day on Tuesday. It dropped to a one-week low near $4,858, then moved back toward $4,900 in early European trading. Traders are waiting for clearer signals on when the US Federal Reserve will start cutting rates.
The main focus is on the FOMC Minutes due Wednesday and the US Personal Consumption Expenditure (PCE) Price Index due Friday. These reports could shift demand for the US dollar and, as a result, move gold prices.


