Gold Bounces Back, But Trade War Exhaustion Limits Gains

Gold prices nudged higher on Thursday, supported by a slight dip in the US dollar and Treasury yields. However, gains were restrained as markets showed signs of fatigue towards President Trump’s increasingly aggressive trade measures.

Spot gold climbed 0.3% to $3,322.46, while US gold futures rose to $3,331, marking a cautious recovery from the week’s low of $3,282.74. Despite the swirl of geopolitical developments, momentum remained modest, reflecting a cautious investor mood.

Louder Tariff Rhetoric, But Diminishing Impact

President Donald Trump escalated his global trade offensive, announcing fresh 50% tariffs on US copper imports and new duties on goods from Brazil, set to take effect on 1 August. A further seven countries were added to the list on Thursday, expanding the tariff target group to 21 nations, including South Korea and Japan.

Yet financial markets barely reacted. Analysts pointed to a growing sense of ‘tariff fatigue’, where traders have become desensitised to the near-constant barrage of protectionist announcements.

Technical Analysis

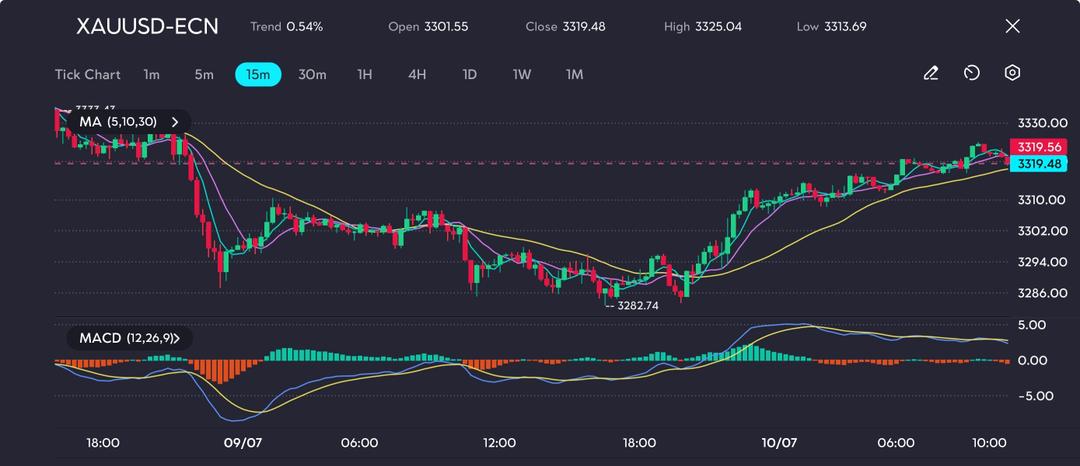
Gold has mounted a modest rebound, ending the day at 3,319.48, an intraday gain of 0.54%. Price action indicates a steady recovery from the day’s low of 3,282.74, with bullish pressure gradually building, evidenced by a series of higher lows and highs. The 5-, 10-, and 30-period moving averages have now formed a bullish crossover structure, signalling short-term upward potential.

Gold recovers above 3315, but resistance looms near 3330, as seen on the VT Markets app.

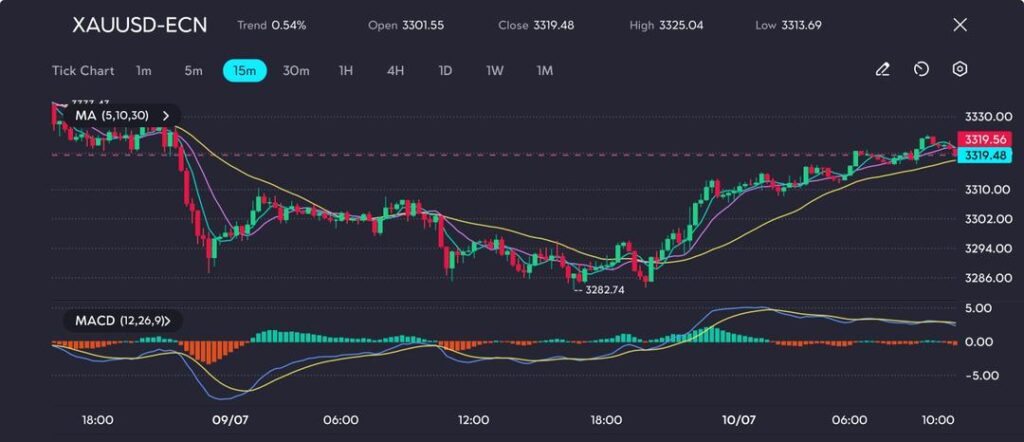
The MACD has moved above the neutral line and remains in positive territory. However, flattening histogram bars hint at slowing momentum as the price nears a potential resistance zone between 3,325 and 3,330, a region that previously acted as support before turning into resistance.

FOMC Minutes Provide Little Inspiration

The minutes from Wednesday’s Federal Reserve meeting offered few surprises. Only ‘a couple’ of members showed support for a rate cut as early as July, while the majority preferred to hold steady for now, citing inflation concerns linked to trade tariffs. The next Federal Open Market Committee (FOMC) meeting is scheduled for 29–30 July and could present the next significant trigger for gold.

Until then, gold prices are likely to remain range-bound, driven more by technical indicators and near-term softness in the dollar than by fresh concern over the escalating trade front.

Create your live VT Markets account and start trading now.


WTI crude oil trading increases as Red Sea attacks shift focus from inventory supply reports

WTI Crude Oil prices are rising due to attacks in the Red Sea. This increase occurred even though the US Energy Information Administration reported a jump in stockpiles by 7.07 million barrels, while analysts expected a drop of 2 million barrels. OPEC and its allies are set to boost production by 548,000 barrels per day starting in August. From April to July, OPEC+ increased production by 1.37 million barrels per day. Even with more oil coming to market, geopolitical tensions have kept prices from dropping significantly.

Houthi Attacks Affect the Market

Houthi rebels have attacked ships in the Red Sea, raising oil risk premiums. WTI Crude Oil is trading around $67.54, with notable support and resistance levels. The market indicators are mixed: the Relative Strength Index (RSI) is slightly above neutral, while the Commodity Channel Index (CCI) is slightly negative. These elements, along with rising inventories and increased OPEC+ output, create a complicated situation for crude oil prices. WTI oil is known for its high quality due to low gravity and sulfur content. Prices depend on factors like supply, demand, and geopolitical events. Despite stockpiles rising beyond expectations, prices have increased, suggesting emotional drivers are at play in the market. The EIA’s report of over 7 million barrels in stockpile growth—much higher than the anticipated decrease—may confuse traders relying solely on basic data. This pattern is familiar: when market sentiment shifts, inventory levels can be overlooked. OPEC+’s choice to raise output by another 548,000 barrels a day from August adds to the increasing supply. From April to July, their total output already grew by 1.37 million barrels daily. Normally, such an increase would lower prices, but that hasn’t happened, mainly due to non-numerical factors.

Geopolitical Tensions and Oil Prices

The rising tensions in the Red Sea have become a crucial factor. As the Houthi group attacks commercial vessels near Yemen, shipping routes are in jeopardy. This situation drives up insurance costs and delays transit times. Traders are pricing in these risks, which helps keep prices higher than they might otherwise be. Currently, WTI is around $67.54, a price that does not attract bargain hunters but is also not high enough to inspire confidence. It is trading closely between its technical support and resistance points. The technical indicators offer little guidance. The RSI sits just above neutral, while the CCI shows slight selling pressure but not enough for a strong market trend. This mixed picture requires careful consideration. While rising supply and growing inventories typically push prices down, ongoing conflict alters this expectation. One must recognize that market conditions are not driven by supply and demand alone; security issues are creating a protective buffer, preventing prices from falling. Instruments tracking oil prices—such as futures and options—may behave differently than usual in this environment. This situation does not favor a clear direction. Hedging strategies might need frequent adjustments, and short-term trades may be more profitable than long-term investments until shipping risks lessen. We should watch how shipping insurers assess new voyages and stay alert for updates from OPEC+ in the coming days. Any changes in sentiment or new maritime developments could significantly affect options premiums or implied volatility. With the RSI and CCI not aligned, relying solely on technical analysis could lead to mistakes. Market momentum is weak and uncertain. Expect more fluctuations than clear trends in the market ahead. In this environment, reactions often outweigh predictions. Create your live VT Markets account and start trading now.

here to set up a live account on VT Markets now

OPEC excludes five major media outlets from its oil conference in Vienna, raising concerns about transparency

OPEC has excluded five major news organizations—The Wall Street Journal, The New York Times, Financial Times, Reuters, and Bloomberg—from its oil industry conference in Vienna. This move mirrors past exclusions and raises concerns about transparency in global energy markets. OPEC hasn’t shared the reasons for these exclusions. OPEC Secretary General Haitham Al-Ghais has previously defended such decisions, emphasizing that “This is our house.”

OPEC’s Media Strategy

This decision comes as OPEC works to manage oil production and stabilize prices amid global economic uncertainty. It reflects OPEC’s strategy to maintain control over oil markets despite external pressures. By excluding these well-known publications from its Vienna conference, OPEC is tightening its grip on information. This move aims to control how its production strategies and market actions are reported, limiting narratives that could challenge its objectives. The absence of these journalists changes the oversight dynamics and increases speculation for those outside looking in. Without real-time statements or informal insights from delegates, interpretations of OPEC’s messaging and policy changes could become more uncertain, especially for those relying on press briefings. Now that the conference is more restricted, market participants must depend more on official statements and second-hand reports. Simply taking the official line at face value is less effective given the current ambiguity, which can be strategically used. As a result, people in the market might benefit by focusing on sentiment signals beyond just headlines—monitoring tanker movements, crude options pricing, and shifts in forward contracts for Brent and WTI instead of relying on sidelined media interpretations.

Navigating The Information Landscape

The conference blackout adds challenges to timing decisions based on policy cues. With major reporting institutions outside, the availability of trusted information slows, allowing for unchecked volatility in the hours following the meeting. Early signs of supply changes—formal or informal—will require close attention to physical flows and interest shifts in dated spreads. During these days, risk calibration will need to focus more on actual oil shipment volumes rather than centralized press releases. Al-Ghais’s firm position—stressing OPEC’s right to control media access—reveals who has the power to shape the message. While this approach narrows the information loop, it doesn’t eliminate all signals. It just raises the cost of access and emphasizes the need for careful triangulation. People in the industry should take the reduced visibility as a chance to sharpen their focus elsewhere: observe the behavior of refiners in Asia-Pacific or the pricing changes in Middle Eastern grades compared to North Sea benchmarks. OPEC’s continuous adjustments to production targets show it’s ready to react to external pressures, such as persistent inflation in Western economies or declining manufacturing demand in major importing countries. This suggests that supply intentions may change soon. Therefore, December and March indicators should be seen as soft pivots rather than fixed plans. Contract strategies should remain flexible, and duration risks should be evaluated regularly. While price stability is the stated goal, it comes with an acknowledgment of some disorder, which can occasionally benefit those who act quickly. Early indicators of market reactions, such as changes in backwardation or price dislocations, are likely to be the most reliable clues. Volatility traders should start adjusting their pricing more aggressively, especially since reduced media transparency could lead to sharper sentiment changes with any rumors of cuts or quota shifts. We are in a time when deciphering information is just as crucial as predicting future trends. Every official statement, or lack thereof, should be considered alongside visible data, such as tanker routes, refinery operations, and arbitrage opportunities. With fewer voices from within the organization, the burden of clarity falls heavier on those observing from the outside. Create your live VT Markets account and start trading now.

here to set up a live account on VT Markets now

Gold rises after a brief dip as President Trump announces upcoming tariffs.

Gold (XAU/USD) is rising as the US Dollar weakens after President Trump announced new tariffs. The tariffs include a 30% charge on imports from Iraq, Libya, and Algeria, and a 20% levy on imports from the Philippines. The upcoming FOMC Minutes are expected to clarify the Federal Reserve’s policy on interest rates. The Fed decided to keep rates steady in June, buoyed by strong job market data.

Strong Job Market

The latest Nonfarm Payrolls report shows that the job market remains strong, which is pushing up yields and strengthening the Dollar. Since gold usually moves in the opposite direction of the Dollar and interest rates, rising yields are reducing its appeal. Currently, there’s a 62.9% chance that the market expects a 25-basis-point rate cut in September. President Trump continues to criticize Fed Chair Jerome Powell, urging him to resign for not addressing rate cuts. Trump’s tariff policies also propose a 50% tariff on Copper and a staggering 200% on certain pharmaceuticals. With notices about new tariffs being distributed globally, economic concerns are growing. Gold prices are around the 38.2% Fibonacci retracement level at $3,292. There’s resistance at several points including the 23.6% retracement at $3,372. The RSI indicates that bearish momentum could push prices down further if gold stays below key moving averages. Tariffs, which differ from taxes, are placed on imports to make local businesses more competitive. Economists are debating whether tariffs protect industries or risk escalating trade wars. To support the US economy, Trump plans to use tariff revenues to lower personal income taxes. He is focusing on countries like Mexico, China, and Canada, which account for 42% of US imports, to revise these tariffs. While gold’s recent strength may be due to reactions to foreign policy changes and a weaker dollar, the situation is more complex. The reasons for recent market changes extend beyond simple headlines. Trump’s tariff increases—especially affecting countries in North Africa and Southeast Asia—have quickly adjusted trade expectations. This isn’t just about changes in pricing but triggers a ripple effect impacting inflation, risk sentiment, and interest rate expectations.

Expectations for Rate Cuts and Market Reactions

The current 62.9% chance of a September rate cut isn’t set in stone; market projections can change rapidly with new economic data. For instance, last week’s Nonfarm Payrolls report was stronger than expected. Strong employment generally supports higher—or at least steady—interest rates. Typically, higher yields strengthen the Dollar and put pressure on gold, but this time the Dollar has weakened, likely in response to geopolitical trade tensions rather than job numbers. Although Powell has decided to keep rates unchanged for now, ongoing pressure from the administration, notably demands for his resignation, suggests a strain on the Fed’s independence. This tension complicates short-term decisions. When political discussions influence monetary policy, it creates uncertainty for traders. Technically, gold approaching the 38.2% Fibonacci retracement at $3,292 raises concerns for those holding long positions. Weak RSI readings imply that this upward move might be short-lived unless gold rises above its moving averages soon. Resistance at $3,372 might limit upward movement unless bond markets anticipate more aggressive monetary support. Different tariffs impact various sectors differently; a 200% tariff on pharmaceuticals is not the same as one on copper. The motives seem more political than economic. Even amid this turmoil, markets expect the Fed to react to trade-related weaknesses by easing policy, even if current data doesn’t clearly support such action. This tension between fiscal measures and monetary policy should be carefully analyzed. What’s crucial now is how rate futures respond to unfolding trade measures. If the market dismisses a rate cut in September, gold prices may fall. On the flip side, if inflation due to tariffs reduces consumer spending and GDP forecasts, bond yields might decline, benefiting precious metals. It’s essential to observe how markets anticipate the Fed’s response to the White House rather than how the Fed acts independently. The effects of balancing tariffs with domestic tax reductions are still speculative. Whether these measures maintain consumer purchasing power depends on their timing and scope. Markets may react differently than policymakers expect. Assets closely tied to macroeconomic factors—like gold or interest rate products—will reflect these market dynamics directly. It’s vital to monitor current positioning and how prices behave around key levels. Often, reactions tell a clearer story than predictions. Traders should remain vigilant for any significant divergence between yields and metals, as that gap typically doesn’t last long. Create your live VT Markets account and start trading now.

here to set up a live account on VT Markets now

Trump’s 50% tariff on Brazil leads to a over 2% drop in the value of the real

Brazil is dealing with major challenges after the United States recently introduced a 50% tariff. This decision has caused the Brazilian real to drop more than 2%. The US already has a trade surplus with Brazil, indicating that the tariff may be motivated by political reasons rather than economic ones. Since the tariff announcement, the real has continued to decline, adding to previous losses. Investment banks have raised concerns about vulnerabilities in emerging markets. J.P. Morgan pointed out that many emerging market currencies are overpriced, while UBS noted that the risks from tariffs are not fully reflected in emerging market stocks. The USD/BRL exchange rate shows how the tariff is affecting Brazil’s currency. The response to the tariff has been significant and clear. The real’s drop suggests traders quickly reassessed their investments. The sell-off indicates a general retreat from riskier assets in developing economies, even for those economies with stable fundamentals. J.P. Morgan’s observations about overpriced markets were important; they indicated that many investors had been overly confident chasing gains in emerging markets without taking enough precautions. Their report supports the idea that some investor positions had become too extreme, especially given the current low volatility. When currencies are extended, even a small announcement or change in sentiment can lead to substantial drops across the board. What’s more concerning is that the reasoning behind the tariff doesn’t match conventional trade imbalances. This raises risks that are difficult to measure—motivations that go beyond financial spreadsheets and can’t be easily predicted. When policies are influenced more by power than by data, it creates uncertainty, causing sudden shifts in market expectations. UBS’s Ramos rightly noted that stocks in these economies haven’t yet adjusted to the new pressures. This creates a mismatch we cannot overlook: stocks that relied on optimistic views about trade now face tougher scrutiny, yet not all valuations have caught up. This imbalance usually resolves quickly, either through swift adjustments in the stock market or pressure spilling over into other asset classes. We’ve already seen broader weakness beyond the BRL. Páez’s model, which tracks volatility in ten regional currencies, shows a noticeable increase over the last 36 hours. Historically, this indicates that investors are ramping up hedging activities rather than just reacting impulsively. This time, it’s not just about speed; it’s about the widespread impact. We are also monitoring how the BRL correlates with indices in Asia, not just in Latin America. If these connections tighten, even temporarily, it raises concerns about the global carry trade. In simpler terms, asset managers using leverage across different regions may find themselves in a situation where risks are converging, making any policy changes more impactful than usual. This is not just a matter of one country facing issues; it’s about strategies based on stability encountering unexpected disruptions. The options market is showing important signals too. We have seen a spike in one-month implied volatility for BRL calls, with a flattening skew indicating a preference for insurance over pure directional plays. This isn’t merely a reaction to currency values; it signals that participants are preparing for potential instability or disruptions in capital flows among major emerging markets. Increased activity in the options market often signals that it’s not retail investors but structured funds responding to specific mandates. Next, it’s crucial to observe how major commodity-linked currencies like the Canadian and Australian dollars perform. If they start to mimic the BRL’s movement, it will signal a broader concern about fiscal pressures beyond just trade issues. For now, timing is critical. Upcoming macro data on US industrial output and supply chain metrics could lead to another wave of market movements. Any indication of decreased US demand or slower inventory rebuilds can intensify the situation. As the next few sessions unfold, we may see further widening of pricing gaps between spot and forward markets, especially in BRL-related swap spreads. These changes may go unnoticed until they impact margin assumptions or lead to rebalancing in larger portfolios. Currently, fluctuations are not only affecting currency strategies but are also influencing fixed income positions. That’s our main area of focus now.

here to set up a live account on VT Markets now

QuantumScape’s share price has risen over 100% since June.

QuantumScape’s stock has jumped more than 100% since June 24 after the company announced it met its production targets earlier than expected. With the stock recently hitting an 11-month high of $8.79, this success is largely due to the new Cobra separator process used in their cell production. QuantumScape is a key player in the solid-state electric vehicle (EV) battery market. They are developing advanced battery technology for partners like Volkswagen. Recently, they achieved a 25-fold reduction in the time needed for ceramic heat treatment, cutting down on the space needed for production. CEO Dr. Siva Sivaram emphasized the improvements in production efficiency and equipment space, helping advance the commercialization of new battery technology. Although they don’t expect to generate revenue until 2026, predictions indicate a huge increase—up to $60 million by 2027. Historically, QuantumScape’s stock has been on a downward trend but has seen spikes with technological improvements. The current rally has pushed shares above important Simple Moving Averages. At $8.79, there’s potential for the stock to rise further toward its previous highs of $13.86. While the company doesn’t currently generate revenue, recent advancements indicate a promising future. The surge in QuantumScape’s shares comes from unexpected progress in battery production. Technical indicators suggest a notable shift in short-term momentum. The stock has moved decisively above key Simple Moving Averages, which often signals a buy for traders who follow trends. Prices above these levels may invite more traders, adding upward pressure. This rally isn’t new; QuantumScape has experienced spikes in the past due to research updates. However, many past rallies faded as investors reassessed both long-term potential and near-term commercialization. This time, the significant improvements, especially the dramatic cut in ceramic processing times, deserve careful consideration. These advancements impact cost and scalability, critical factors for battery commercialization. Sivaram was clear about improving manufacturing speed and reducing space needs. Reading between the lines, it seems the company is optimizing its costly production steps, positioning itself better as it prepares for a manufacturing increase. While commercial success is still a ways off, these enhancements indicate that QuantumScape is making real progress toward its goals. For short-term traders, volatility presents both risk and opportunity. Implied volatility has likely increased due to the recent stock price jump and news flow, affecting decisions on buying or selling options. High premiums offer chances to sell calls or puts if traders expect prices to stabilize. Meanwhile, momentum traders will note the recent break above resistance levels, especially since the target price could reach as high as $13.86— a level last seen in mid-2023. Reaching this price will depend on maintaining positive sentiment or finding another catalyst. With no current revenue and years until substantial earnings, price movements will respond more to milestones than to earnings surprises. For now, expectations center on improvements in efficiency and scaling up proof of concept. Predictions of $60 million by 2027 rely heavily on continued manufacturing enhancements and successful partnerships. While there’s no cash flow to analyze now, expectations are rooted in actual feasibility, not just theory. We view the current stock movement as part of a sentiment-driven cycle, rather than a response to new fundamental data. This means it’s wise to approach trading with clear timeframes and disciplined strategies—momentum can vanish as quickly as it builds. Monitoring call volume and share movement is essential right now; increases in open interest may signal new directional bets or hedges. Patience is crucial: this isn’t about expecting immediate gains or losses, but about adhering to trading rules that suit one’s exposure to volatility. We’ve seen these setups before, and they rarely progress in a straight line.

here to set up a live account on VT Markets now

The EU and US are quickly negotiating a car trade agreement to prevent upcoming tariffs.

The European Union is in talks with the U.S. about a trade deal to protect its auto industry from 25% tariffs that were imposed in April. They are looking at options such as import quotas, lower tariffs, and export credits. Export credits could assist EU carmakers like BMW and Mercedes-Benz by allowing them to balance their imports and exports from their U.S. operations. There might be progress soon, but some issues remain unresolved. The EU is focused on car concessions, which is essential for Brussels, while the U.S. is wary of quotas and prefers to boost domestic production. Both sides are thinking about reducing tariffs and aligning regulations to support their economies. In 2024, the EU sent nearly 758,000 cars to the U.S., worth €38.9 billion, highlighting the importance of this deal.

Trade Discussions And Their Ramifications

The EU’s push for trade talks shows their strong effort to counter the significant risk of high tariffs that threaten its auto exports. With tariffs at 25%, this isn’t just a typical trade disagreement—it’s a serious challenge for producers whose profit margins are already tight due to rising raw material costs and changing supply chains. The previous Merkel government set up the car sector’s reliance on U.S. access, and now Brussels is dealing with the fallout. The idea of export credits shows a strategic approach. If used properly, they could help manufacturers offset losses from import restrictions. If these suggestions evolve from discussions into actual policies, companies with factories in the U.S. could gain a competitive edge. Tavares, who has often warned about unfair trade conditions, might benefit from shifts that favor balanced trade between the two regions. What we are seeing is not just about reducing tariffs—it’s about rethinking how goods move between these two economies. The EU’s demand to protect vehicle exports is a crucial point, especially since nearly three-quarters of a million cars worth almost €39 billion were shipped to the U.S. last year. This is significant money, and the auto sector can’t quickly pivot away from the U.S. market. Washington’s reluctance to accept quotas suggests they want to focus on boosting domestic factory output rather than negotiating externally. This approach is understandable in an election year, but it complicates the pace of negotiations. Any belief that this will be resolved smoothly underestimates the political realities and economic priorities of both sides. U.S. leaders want to support local manufacturers—this includes reducing reliance on foreign competition and creating more high-value jobs, which makes it hard to agree to quotas.

Potential Path Forward

Widespread reduction of tariffs is likely the most viable way forward, especially if combined with regulatory alignment on technical standards. This includes areas like emissions standards or safety classifications. Even minor harmonization can lower compliance costs across borders, quickly improving profit margins. There’s nothing groundbreaking about this—just enough to give medium-sized suppliers some relief while larger companies adjust. In the upcoming weeks, we might see progress, especially as mid-year forecasts start to influence budget planning in government agencies and economic ministries. If you’re involved with European auto stocks or are affected by currency fluctuations related to this deal, these negotiations demand your careful attention. Policy changes will start as discussions before becoming formal announcements, so keep an eye out for developments before they are widely reported. We have seen similar situations before. When officials emphasize non-negotiable industrial outcomes, it’s usually not just talk. It often leads to compromises in other areas—like agricultural access or agreements in related sectors. Watch for those smaller concessions; they could trigger the next significant changes in trade-linked markets. Create your live VT Markets account and start trading now.

here to set up a live account on VT Markets now

Chris Beauchamp, chief market analyst at IG, highlights Dax and Nvidia’s impressive milestones despite tariff concerns.

The Dax index has set new record highs, even with worries about upcoming tariffs. This rise happens while the EU waits for a possible tariff announcement, as the markets seem to expect another delay until August. Reports indicate that further postponements could happen, but this strategy has its risks. Nvidia’s market value has exceeded $4 trillion, showcasing a strong comeback for big tech stocks. The company’s growth is driven by the AI trend, leading to a significant period of market excitement ahead of Nvidia’s next earnings report.

Currency Markets Amid Trade Concerns

The EUR/USD is trading just above 1.1700 and feels pressure due to market uncertainty tied to potential tariffs while investors wait for the FOMC Minutes. In contrast, GBP/USD sees daily gains around the 1.3600 level, though uncertainties in US trade policies challenge the US Dollar’s strength. Gold prices have climbed over $3,300 per troy ounce, supported by falling US yields and calls for lower interest rates. The upcoming minutes from the US Fed’s June meeting will shed light on expected rate cuts amidst ongoing trade tensions. New tariffs impacting Asian economies have higher-than-expected rates, although some nations might benefit from tariff discounts. Countries like Singapore, India, and the Philippines could see positive outcomes if negotiations work out well. Despite the concerns around tariffs, equity markets—especially in Europe—are pushing indices like the DAX to record highs. This reflects a strange gap between political noise and the market’s risk sentiment. Currently, investors seem to believe that trade disputes—especially those over tariffs—will linger into late summer without causing immediate disruptions. This is a directional sign but isn’t foolproof. For traders tracking short-term volatility or making strategies sensitive to news risks, caution is critical. A sudden imposition of tariffs—especially in sectors closely tied to Asian exports—could upset the current calm. Even with discussions of delays, the unpredictability in politics suggests that exposure going into August may need tighter controls or less risk, particularly in cross-border issues that could react unexpectedly.

Tech Stocks and Market Outlook

After an exhilarating surge, especially with Nvidia joining the rare $4 trillion valuation club, positions around tech-heavy benchmarks are becoming more speculative. This stock has become a symbol of optimism fueled by artificial intelligence. However, the upcoming earnings report could trigger volatility. Traders who are already invested in tech-heavy index derivatives or single-stock options should prepare for increased market fluctuations around that time. If the market meets expectations, momentum could continue, but the risk rises if sentiment turns negative for anything less than perfect results. In the currency market, the euro holding above 1.1700 shows its strength, but it still faces pressure from an unpredictable economic environment. The dollar isn’t seeing significant rush either; its shaky behavior reflects trade speculation and what the Fed minutes might reveal. Until there is more clarity on interest rate direction, EUR/USD and GBP/USD are likely to stay within similar ranges, with occasional sharp movements based on comments from Fed Chair Powell or unexpected remarks from other board members. The modest gains in sterlings may reflect dollar weakness rather than its inherent strength, so we shouldn’t mix the two. For trading in FX volatility, dollar crosses continue to show attractive setups—especially if expectations surrounding the Fed’s interest rate shift clearly after discussions about the balance sheet and rate normalisation. For commodities, gold staying above $3,300 aligns with the current expectations of easier monetary policy and low yields. Recent price movements in precious metals strongly connect with the reduction in real interest rates and serve as protection against inflation—which remains inconsistent—as well as rising trade tensions. Those invested in precious metal futures should closely monitor both inflation expectations and commentary from central banks. Gold often reacts to rate policy instead of leading it. The spread of tariffs affecting more of Asia, especially at higher rates than expected, adds complexity to the current economic environment. Markets might not accurately reflect the uneven trade impacts—especially where regions like India or Singapore could see protective measures implemented sooner. How negotiations play out will significantly affect those invested in emerging market instruments or capital flow-sensitive pairs. Overall, derivatives may show interesting price variations in the short term, particularly within the intersection of news headlines, domestic economic trends, and the current earnings cycle. Create your live VT Markets account and start trading now.

here to set up a live account on VT Markets now

Brazil’s coffee and orange juice supply to the US faces rising prices and challenges

Brazil is a major supplier of essential goods like coffee and orange juice to the United States. In 2023, it supplied about 35% of America’s unroasted coffee imports, mainly due to its large production of Arabica beans. However, factors like droughts and less fertilizer use have hurt Brazilian coffee production, leading to lower supply and rising prices in the U.S. Brazil is also significant for orange juice exports. From October 2023 to January 2024, 81% of U.S. orange juice imports came from Brazil, compared to 76% the year before. This increase happened because Florida faced reduced production due to citrus greening disease and extreme weather, making the U.S. more reliant on Brazil’s supply. The U.S. reliance on Brazilian coffee and orange juice highlights how trade policies and environmental issues can affect the availability and prices of everyday goods. Recent events show a notable drop in supply from Brazil, impacting more than just consumer products. Severe droughts have reduced Arabica bean yields and limited export capacity. Plus, the decline in fertilizer use indicates significant stress on production methods. If this continues, it may keep putting pressure on output for the rest of the year. It’s important to recognize how agricultural inputs connect to export volumes, especially when unfavorable weather patterns persist for these crops. Brazil has become a crucial backup for coffee and orange juice in North America, compensating for production challenges in other regions. Pest outbreaks in Florida and extreme weather have prevented U.S. producers from meeting their usual output. The nearly five-point increase in Brazil’s share of U.S. orange juice imports in just a year underscores this. This situation indicates that weather-related instability in Brazil, along with lower fertilizer use, could create erratic price changes. Low stockpiles and tight margins at the source increase the possibility of volatility, especially if short-term issues like droughts or strikes disrupt logistics or harvesting. We expect significant price fluctuations in the next quarter, particularly if export terminals face delays or picking seasons fall short of expectations. Traders should prepare for highly sensitive price movements, likely favoring increases. A missed shipping opportunity or a change in crop yield predictions could lead to price jumps for orange juice and Arabica coffee futures. If current discounts do not adjust to new supply trends, the differences between origin-based contracts and U.S. benchmarks might widen. Additionally, the dollar’s value compared to the Brazilian real could impact prices. If the real appreciates, import costs will increase, supporting higher prices for ICE or NYBOT contracts. On the other hand, a weaker real could temporarily ease imported inflation but may not fully reverse rising costs due to supply tightness. A key point to watch is how forward contracts may start to diverge from historical trends. For instance, if inventories remain low by mid-year, the market might factor in scarcity for later contracts. Those managing derivative positions should think about how long-term contracts may reflect risk premiums earlier than expected. Instead of keeping directional exposure, rotating short-dated contracts into layered options or staggered hedge positions could be more effective. We are also looking for signs of secondary effects as processors and distributors try to recover increasing costs. If price increases for retail beverages or cafe demand happen more quickly than anticipated, futures spikes could become self-reinforcing. This concern is based on recent supply chain data that indicates reduced buffer stocks at major U.S. ports. Overall, the situation is tight and reacts strongly to challenges in Brazil and consumption trends abroad. With skewed production numbers already seen in the first half of the year, further declines could impact the prices of future contracts. The timing of rainfall in southern Brazil will be crucial, and any ongoing issues with fertilizer access could limit the effects of seemingly improved forecasts. Tracking export license activities, vessel loading schedules, and global fertilizer trade flows may provide early warnings of further availability constraints. In our opinion, being responsive in positioning rather than relying solely on predictions could provide the best advantage in this stressed supply chain.

here to set up a live account on VT Markets now

The Euro falls against the Swiss Franc, hitting a multi-week low amid ECB worries

The Euro has weakened against the Swiss Franc, trading near a low point of 0.9318, following cautious comments from European Central Bank (ECB) officials.

Global Risks Impact

ECB Chief Economist Philip Lane has pointed out rising global risks, including trade barriers and restrictions on capital flows. Deputy Director-General Livio Stracca warns that climate-related issues could lower eurozone GDP by up to 5% over the next five years, similar to the effects of the COVID-19 crisis. These concerns make the ECB cautious, which may keep the Euro under pressure. Currently, the EUR/CHF pair is moving within a range between 0.9300 and 0.9430, a pattern that has persisted since April. If the pair breaks below the 0.9300 support level, it could signal a bearish trend. The pair is trading below the 20-day Simple Moving Average of 0.9365, making it a strong resistance level. Momentum indicators show weakness, with the Relative Strength Index (RSI) around 40, signaling declining buying interest. A drop below 0.9300 could increase downward pressure, while a recovery would need to push above 0.9365 to change the current trend. The Euro’s ongoing decline against the Swiss Franc reflects overall market sentiment shaped by the ECB’s cautious stance. Lane’s warnings about increasing trade barriers and limited capital mobility point to potential risks for the eurozone’s competitiveness and productivity, not just in the future but impacting current market dynamics. Stracca adds another concern, suggesting that climate-related issues could have significant medium-term economic effects, similar to those seen during the pandemic. He connects climate instability to real risks to both output and price stability. This makes it unlikely that the ECB will consider aggressive interest rate changes or balance sheet adjustments.

Trading Standpoint

From a trading perspective, the signals of caution are impacting price movements. The EUR/CHF’s long-standing range shows that traders are hesitant to move beyond established support and resistance levels. This month, the inability to maintain gains above 0.9365 highlights the challenges short-term buyers face. The recent rejection from the 20-day simple moving average just above 0.9360 was noticeable and coincided with declining momentum, evident from the RSI around 40. There have been limited attempts to stabilize near 0.9330, and with ongoing downward pressure, testing the support level near 0.9300 seems more likely now. If the pair breaks below 0.9300, there isn’t much support nearby, making further declines more probable. In such a case, sellers may not hesitate. Any upward corrections are likely to be minor unless market volatility increases or short-position traders become overcrowded. Conversely, if the pair manages to rise past 0.9365, it would prompt a reevaluation of market intentions, possibly hinting at a short-term reversal, but that’s not the current scenario. For those involved in trades or cross-market strategies, our focus remains on the lower range. This cautious approach, supported by the ECB’s stance and ongoing economic risks, suits range-trading strategies while the floor holds. It is crucial to maintain tight risk thresholds near 0.9300, as a breach could lead to broader price adjustments. Leverage should reflect the prevailing trend. In summary, resistance is strong, and support is weakening. Both technical indicators and policy perspectives suggest limited opportunities for Euro buyers unless a new macro narrative emerges. Currently, the trend leans downward, not upward. Create your live VT Markets account and start trading now.

here to set up a live account on VT Markets now

Back To Top
Chatbots