Dividend Adjustment Notice – Jul 01 ,2025

Dear Client,

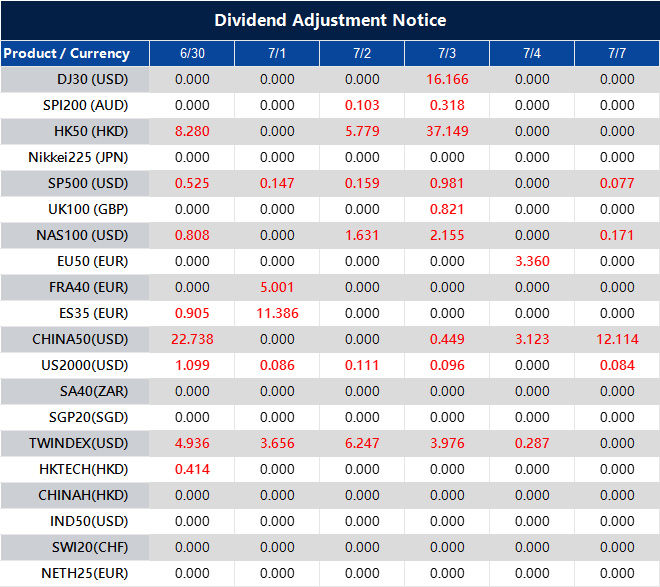
Please note that the dividends of the following products will be adjusted accordingly. Index dividends will be executed separately through a balance statement directly to your trading account, and the comment will be in the following format “Div & Product Name & Net Volume”.

Please refer to the table below for more details:

Dividend Adjustment Notice

The above data is for reference only, please refer to the MT4/MT5 software for specific data.

If you’d like more information, please don’t hesitate to contact [email protected].

S&P 500 Holds Firm Following Fresh Record Highs

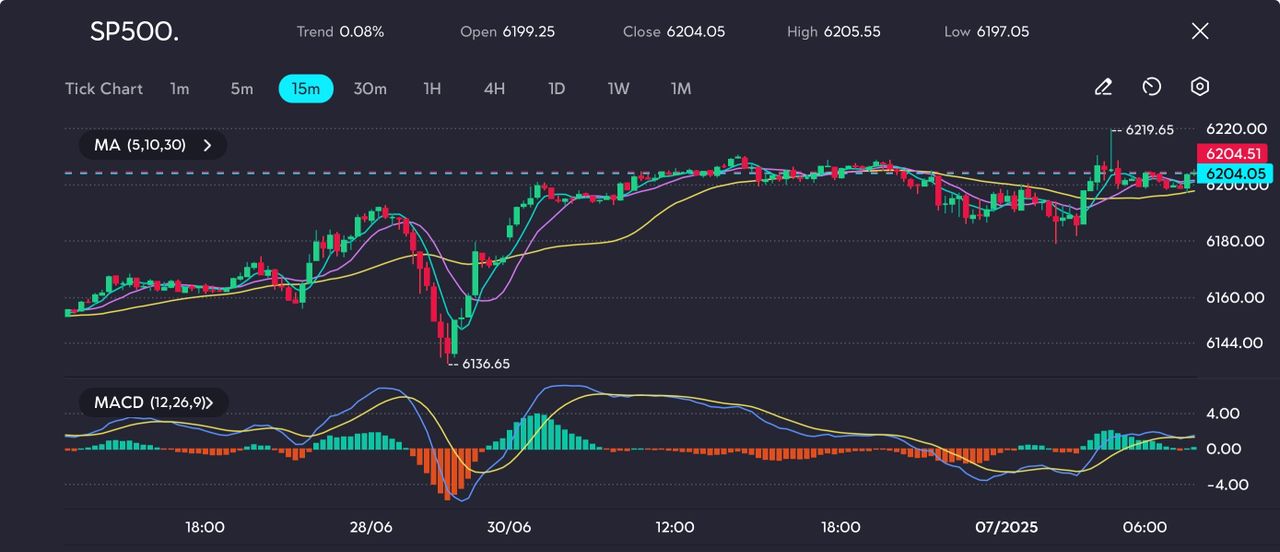
US equities began the new quarter on a confident note, with the S&P 500 rising 0.52% on Monday to close at 6,204.05 after reaching an intraday peak of 6,219.65. The Nasdaq added 0.47%, while the Dow Jones Industrial Average advanced by 0.63%, buoyed once again by robust gains in major technology names.

Microsoft and Meta Platforms were at the forefront of the rally, both setting fresh record highs and helping lift the Nasdaq to a strong quarterly close. Optimism was further fuelled by news that Canada would shelve its planned digital services tax, an announcement aimed at reducing tensions with the United States ahead of upcoming trade discussions.

Trade Developments And Fed Hopes Underpin Confidence

Investor sentiment was lifted by Canada’s decision to abandon its digital tax plan, which had been a sticking point in US-Canada relations. This move has smoothed diplomatic ties just ahead of President Trump’s 90-day tariff pause, with negotiations continuing between the US and several key trading partners, including Mexico, India, and Vietnam.

Meanwhile, US Treasury yields edged lower as economic indicators showed signs of softening. This decline, combined with cautious rhetoric from Federal Reserve officials, reinforced expectations of potential rate cuts later this year. Lower yields have provided additional support to equity valuations, particularly in interest-sensitive industries such as technology and real estate.

Technical Analysis

On the 15-minute chart, the S&P 500 remains well-supported above its 30-period moving average. The index rebounded firmly after touching 6,136.65 on Friday, and momentum indicators such as the MACD histogram have returned to positive territory. The MACD signal lines are also beginning to slope upward, suggesting the potential for further gains, albeit with moderate strength.

SP500 consolidates below resistance as bulls regroup, as seen on the VT Markets app.

With the S&P sitting near all-time highs, resistance remains at 6,220. A sustained break above this level could trigger fresh upside. However, profit-taking and headline risks may keep the index oscillating between 6,180 and 6,220 in the near term.

The bullish equity trend may continue if trade negotiations progress and U.S. macro data remains soft but stable. However, stronger-than-expected inflation or labour figures could temper rate cut expectations and weigh on stock momentum.

Create your live VT Markets account and start trading now.

Week Ahead: Rate Cuts Loom Large On Market Radar

The recent stock market rally is being fuelled less by corporate performance and more by shifting expectations around US interest rate policy. Traders are betting that Federal Reserve Chair Jerome Powell will soon be forced to step back. Figuratively for now, but perhaps literally too, as political pressure builds and the Fed navigates a narrow path between inflation control and fiscal constraints.

At the centre of this tension is a growing standoff between President Donald Trump and Powell. Although Powell’s term officially runs until May 2026, there are growing rumours that Trump could pre-emptively name a successor as early as this September or October.

While the US Supreme Court recently reaffirmed the Fed’s institutional independence, markets are watching closely. An early announcement could significantly undermine Powell’s authority and reorient investor focus toward the likely policy stance of a more politically aligned Fed Chair.

Trump’s agenda hinges on aggressive monetary easing. He argues that a 2–3 percentage point reduction in interest rates could save the US Treasury nearly $900 billion a year in debt servicing. With Treasury Secretary Scott Bessent extending cash management to 24 July to avoid breaching the debt ceiling, the argument is gaining ground. Annual interest payments are on course to exceed $950 billion, a record figure threatening to squeeze discretionary government spending.

Still, Powell remains guarded. In recent testimony, he maintained a data-driven stance, suggesting cuts could come ‘sooner rather than later’ if inflation continues to ease, but reiterating there is ‘no rush’ to act prematurely.

The Fed expects inflation to pick up in the latter half of 2025, partly due to renewed tariffs. Combined with a still-resilient labour market, this has encouraged a cautious tone.

Traders Prepare For A Trim

Markets, however, appear sceptical. According to the CME FedWatch Tool, there’s a 91.5% chance of a cut at the 17 September FOMC meeting, and expectations are building for a second cut before year-end. Although just 19.1% of traders expect action at the 30 July meeting, this divergence between Fed communication and market pricing is widening, driven in part by Trump’s growing influence.

Currency markets have already responded. Bloomberg’s Dollar Index has declined over 8% year-to-date, with losses accelerating as speculation mounts about Powell’s possible replacement. Should Trump appoint a dovish successor, the greenback could face further weakness, especially if economic data starts to falter.

Equities tell a different story. The S&P 500’s climb appears tied more to hopes of looser monetary policy than robust earnings. With M2 money supply inching higher and borrowing costs poised to fall, investors are piling into rate-sensitive assets, anticipating a liquidity-driven rally. Yet this optimism remains speculative and not grounded in confirmed policy moves.

Market Movements This Week

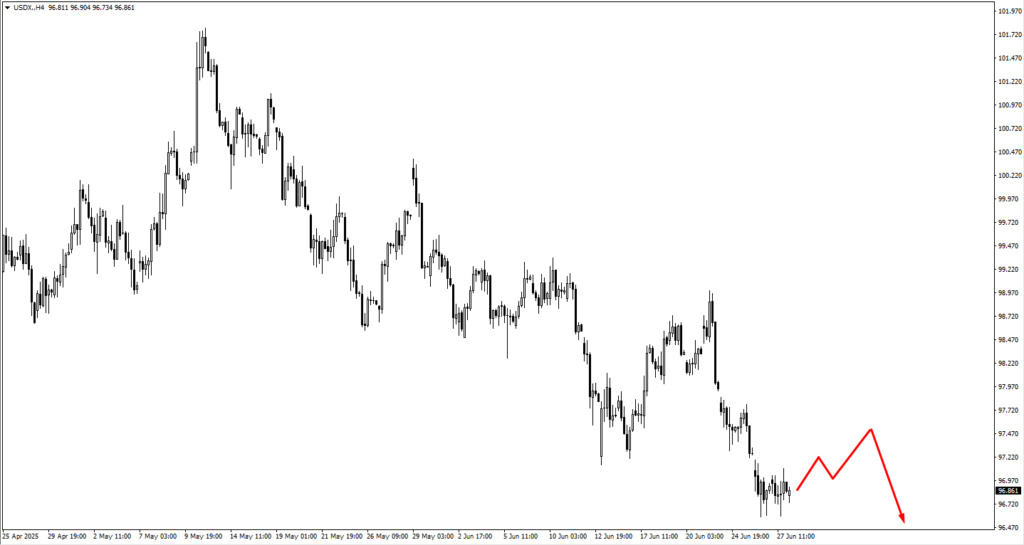
The US Dollar Index (USDX) is testing key support at 96.50. A rebound toward 97.70 could present short-term bearish trade opportunities. However, if the downtrend extends, 95.40 will be the next level to monitor. Political factors are now playing a greater role in the dollar’s direction than inflation data or Fed guidance.

EUR/USD is struggling to break above resistance at 1.1770. A pause or pullback here would be natural, but if price consolidates, the 1.1605 zone becomes critical for bullish continuation patterns. Traders appear hesitant to overcommit, likely waiting for confirmation that the ECB’s easing path is not outpacing the Fed’s.

GBP/USD faced resistance at 1.3790 this week. Price action suggests a potential pullback, and if the pair consolidates downward, 1.3605 could become a viable entry for medium-term bulls. With Bank of England commentary due next week, sterling may remain directionless until fresh forward guidance is provided.

USD/JPY remains mixed. A decline could see buyers re-enter around 143.10, while rallies toward 145.20 or 145.75 may trigger selling. With Japan having initiated its easing cycle earlier than most, the yen is increasingly traded on rate differentials rather than risk sentiment alone.

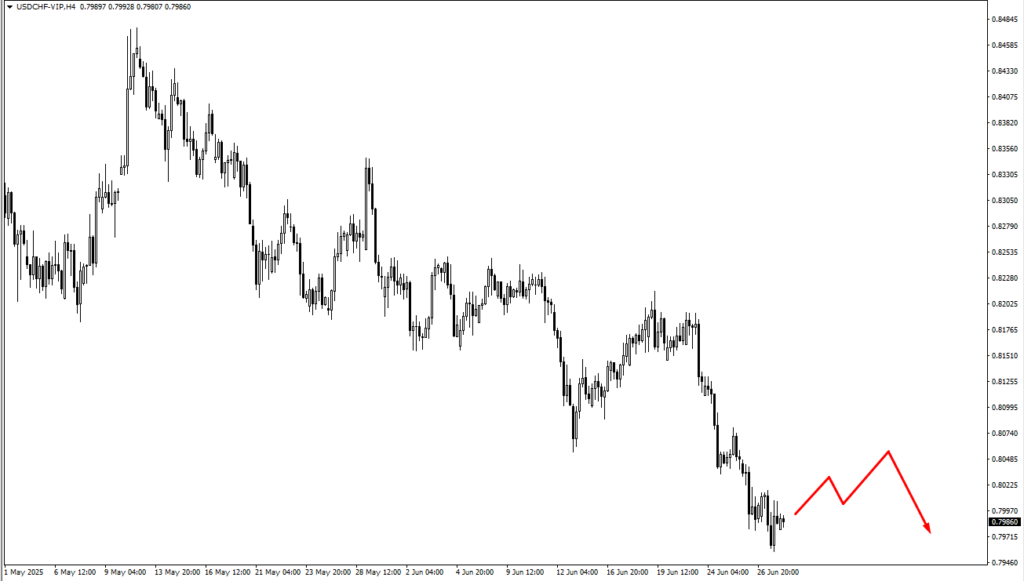
USD/CHF continues to struggle. Any bounce toward 0.8050 or 0.8110 is expected to face renewed selling pressure, assuming the dollar’s weakness and SNB’s slow pace of easing persist.

In the commodity-linked pairs, AUD/USD and NZD/USD are both setting up potential bullish trades if price consolidates near 0.6490 and 0.6455 for AUD, and 0.6005 or even as deep as 0.5730 for NZD. Sentiment remains tied to Chinese demand and broader commodity flows, but the FX reaction is more measured than enthusiastic.

USD/CAD made a run higher, breaching the 1.3754 swing high before pulling back. Sellers remain present but weak. Should price revisit 1.3810 and consolidate, that area may offer a bearish setup, particularly if oil prices stay elevated or Canadian employment data remains firm.

Turning to crude oil, the price has approached the upper range with resistance at 71.80 and 73.40. Consolidation near these levels could attract sellers, but on the downside, 63.35 and 61.00 remain long-term support levels to monitor. Oil has been stuck between fundamental headwinds and seasonal demand optimism.

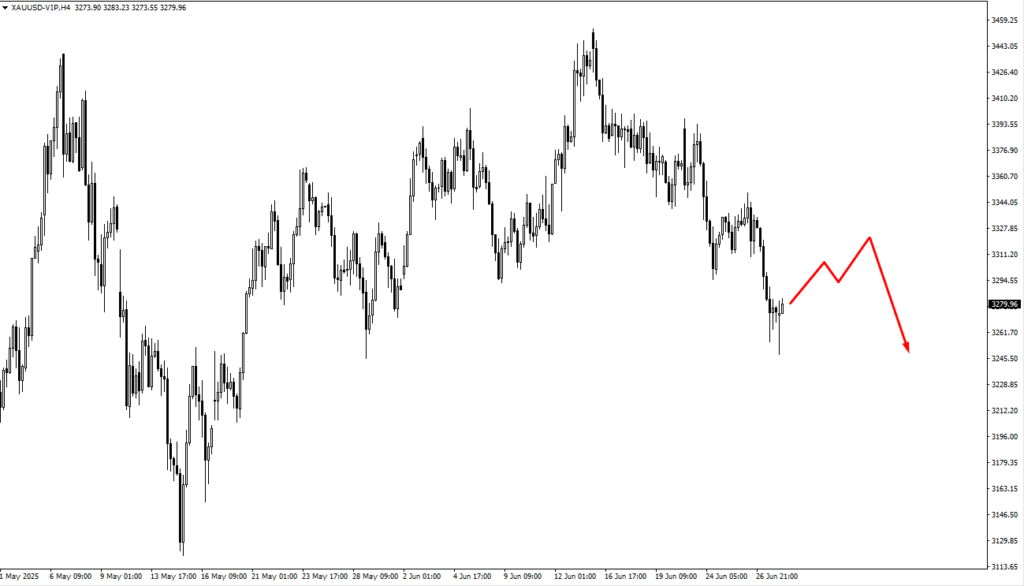
Gold is consolidating near 3,330, with bearish setups possible on a break lower. Support lies around 3,220 or as far as 3,175. Despite dollar softness and rising political uncertainty, gold remains in a holding pattern without a clear trend.

The S&P 500 has pushed higher into overbought territory. Watch 6,200, 6,400, and 6,630 as inflection points. The rally is speculative, driven by rate cut hopes, but extended technicals suggest a pullback may be on the horizon, particularly if labour data surprises to the upside.

Bitcoin broke to a new swing high after consolidating. It now eyes 109,650 as the next key level, with 111,300 seen as the line in the sand for determining further upside. Crypto markets have benefited from the dollar’s softness and broader appetite for decentralised stores of value—but they remain vulnerable to Fed communications that surprise on the hawkish side.

Natural Gas (NG) skipped consolidation entirely and surged toward 3.65. Momentum remains strong. If the rally continues, 3.75 is the next resistance level to watch, with 4.046 being the breakout high that may act as a longer-term barrier.

The Nasdaq is riding the same bullish wave as the S&P, breaking higher and targeting 22,600, then 23,330, with a stretch toward 24,600 if tech continues to lead. While semiconductors and AI-linked stocks are propelling the move, breadth still lags.

Silver dropped from the 36.70 resistance zone and slid below 35.85. A consolidation near 36.45 may offer a bearish continuation setup. The precious metals complex is still in a wait-and-see mode, tracking inflation expectations and real yields.

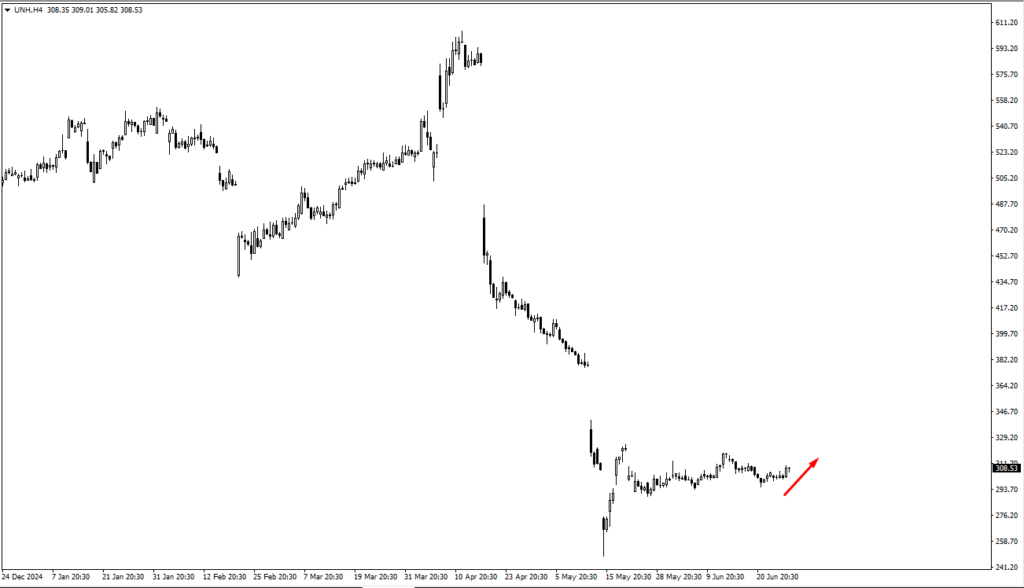
Among individual equities, UnitedHealth (UNH) is trading far below its estimated fair value of $570, currently between $275 and $324. A break above $324.41 could offer technical upside, while long-term investors may find value in phased accumulation.


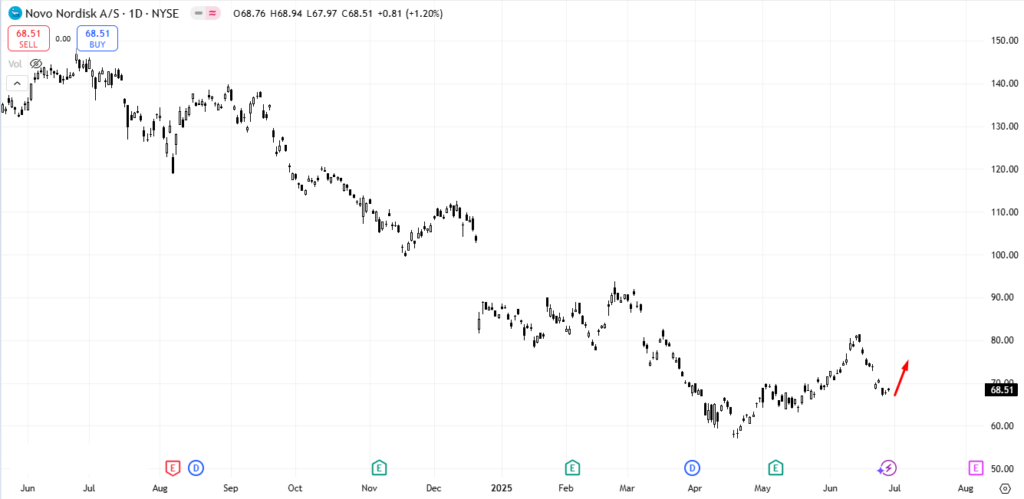
Novo Nordisk (NVO) is trading around 67.80. Like UNH, its market value remains far below its estimated intrinsic value of $150, and long-term investors may look to accumulate gradually at these levels.

Ethereum is also climbing, with $2,580 highlighted as a critical area. A breakout beyond that could trigger the next wave of bullish interest, though like Bitcoin, ETH remains tethered to the broader macro narrative of rate shifts and risk appetite.

Key Events This Week

This week’s calendar offers a tight cluster of high-impact events, concentrated around central bank commentary and labour market data, each carrying the potential to recalibrate expectations around rate cuts, both in the US and abroad.

The action begins Tuesday, 1 July, with Bank of England Governor Andrew Bailey and Bank of Japan Governor Kazuo Ueda both scheduled to speak. With the yen recently under pressure and sterling showing resistance near key levels, traders will be listening closely for any hint of policy recalibration. Ueda’s tone, in particular, will be watched for signs of discomfort with persistent yen weakness—a scenario that could alter near-term FX dynamics in Asia-Pacific pairs.

Later that day, all eyes will turn to Federal Reserve Chair Jerome Powell, whose remarks are expected to reiterate the central bank’s “data-dependent” approach. Market pricing remains heavily tilted toward a September cut, but the tone Powell strikes could widen or narrow that window sharply.

Also on Tuesday, the latest JOLTS job openings report is due. Consensus stands at 7.45 million, up modestly from 7.39 million previously. While hardly a blockbuster release on its own, in the current environment of heightened sensitivity to labour data, a softer reading could reinforce the case for earlier rate relief. Conversely, a surprise beat may embolden Powell’s caution and press pause on the bond market’s easing bias.

Thursday, 4 July, delivers a more concentrated cluster of labour data, including CPI (m/m) for Switzerland, as well as the US unemployment rate and non-farm employment change. Expectations here are subdued: the US unemployment rate is forecast to tick up to 4.3% (from 4.2%), and NFP is expected at 120,000 (down from 139,000). If both figures come in weaker than expected, the July FOMC meeting could return to the spotlight as a live event. But Powell has made it clear that one poor print won’t drive policy.

It would take meaningful, sustained deterioration to warrant a July move, and as such, this week’s data may shape tone more than trigger action.

Create your live VT Markets account and start trading now.
Dividend Adjustment Notice – Jun 30 ,2025

Dear Client,

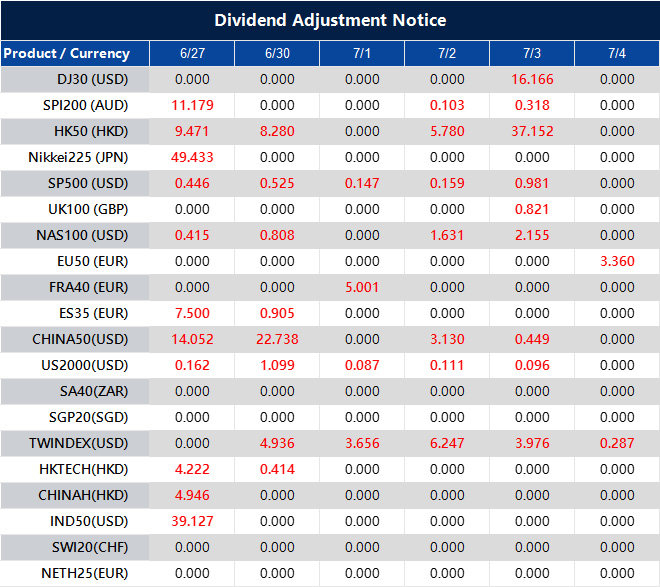
Please note that the dividends of the following products will be adjusted accordingly. Index dividends will be executed separately through a balance statement directly to your trading account, and the comment will be in the following format “Div & Product Name & Net Volume”.

Please refer to the table below for more details:

Dividend Adjustment Notice

The above data is for reference only, please refer to the MT4/MT5 software for specific data.

If you’d like more information, please don’t hesitate to contact [email protected].

Notification of Trading Adjustment in Holiday – Jun 27 ,2025

Dear Client,

Affected by international holidays, the trading hours of some VT Markets products will be adjusted. Please check the following link for the affected products:

Notification of Trading Adjustment in Holiday

Note: The dash sign (-) indicates normal trading hours.

Friendly Reminder:
The above data is for reference only, please refer to the MT4/MT5 software for specific data.

If you’d like more information, please don’t hesitate to contact [email protected].

Dividend Adjustment Notice – Jun 27 ,2025

Dear Client,

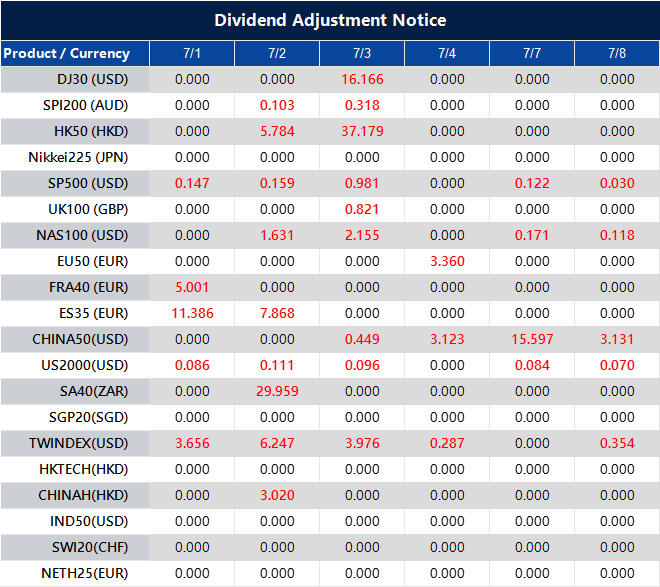
Please note that the dividends of the following products will be adjusted accordingly. Index dividends will be executed separately through a balance statement directly to your trading account, and the comment will be in the following format “Div & Product Name & Net Volume”.

Please refer to the table below for more details:

Dividend Adjustment Notice

The above data is for reference only, please refer to the MT4/MT5 software for specific data.

If you’d like more information, please don’t hesitate to contact [email protected].

Trump’s choice for Fed Chair could change perceptions, but policy decisions depend on the consensus of multiple influential members.

The market is buzzing about Trump’s upcoming nomination for the new Fed Chair. Many believe this could lead to a more dovish Fed, which might weaken the US dollar, raise Treasury yields, and boost stock prices. However, decisions about monetary policy involve 12 voting members, not just the Fed Chair. While the Chair carries weight, they don’t have all the power. The Fed is independent to prevent political influence, so changes in policy aren’t certain with a new Chair.

Policy Dynamics And The Fed

Trump’s nomination doesn’t automatically mean rate cuts. Previous nominations have shown that the Fed acts independently. For example, Powell, who was nominated by Trump, based his decisions on the economy’s needs, not on what the President preferred. There could be uncertainty around policy if there are disagreements within the FOMC. Right now, there are more members who are neutral or hawkish than those who are dovish. Keep an eye on economic indicators, especially how inflation affects interest rates and future Fed decisions. So far, there’s buzz about Trump’s potential choice for Fed Chair, and many think that a more dovish figure could push for easier policy. This could result in a weaker dollar, rising long-term yields, and maybe higher stock prices. But remember—while the Chair sets the tone, decisions are made by a group of 12 voters at the FOMC. It’s not just about personalities; data needs to support any decisions. Powell’s history shows us this: even if someone is appointed for specific reasons, they may not act as expected. He raised rates multiple times in 2018 and 2019, despite disagreement from the White House. The Fed’s credibility comes from reacting to economic signs, not from political applause.

Trading Desk Insights

For traders, who sits in the Chair matters less than what the group communicates after each meeting. Dovish leanings matter only when backed by data, like lower inflation or slower job growth. Currently, with most members leaning toward keeping rates firm, even a softer-spoken Chair won’t dramatically change the mood. Markets move based on expectations, but if those are shaky—more based on assumptions than facts—it can lead to volatility. Bigger price swings often happen not when policies are announced, but when future expectations are challenged. Unless inflation drops significantly and wage growth slows, the committee is unlikely to shift toward faster cuts than already planned. It’s wise to monitor core inflation, especially in services, since goods are already seeing a slowdown. Look at the forward swaps and futures curves — not just what they indicate, but whether they’ve become overly reactive. Rate volatility, especially in the short term, won’t stabilize until policy direction becomes clearer based on actual data. Recent comments from Harker and Waller show the committee isn’t rushing. Upcoming CPI reports will be important, and the PCE even more so. Movements in the breakeven inflation market will suggest how long-term expectations could guide the Fed’s decisions. A new Chair nominee won’t change that—data will always weigh more than an individual opinion. Traders should react to pricing changes instead of assuming policy directions. Positions should be based on probabilities, not headlines. Even if sentiment suggests cuts, indicators like FRA-OIS spreads should back that before taking action. Keeping duration exposure flexible, reassessing carry trades with currency overlays, and closely watching the next Summary of Economic Projections can be more effective than guessing on appointment outcomes. It’s the data points, not the figureheads, that influence expectations. Create your live VT Markets account and start trading now.
here to set up a live account on VT Markets now

Dovish comments from the Fed impact USD/JPY, with market reactions anticipated near key support levels

The USDJPY pair is going down as the US dollar becomes weaker. Recent negative factors include dovish comments from Fed’s Bowman, suggesting possible rate cuts if inflation remains low. Iran’s recent actions, reminiscent of past occurrences, have influenced the market. Also, President Trump mentioned speeding up the announcement of a new Fed Chair. Month-end flows may also weaken the dollar. In Japan, the yen is stable as the Bank of Japan (BoJ) maintains rates at 0.5% and tweaks its bond tapering plan. The BoJ is focused on the US-Japan trade agreement and inflation. On the daily chart, USDJPY is close to the 142.35 level, where buyers may come in. Sellers want to break below this point to aim for 140.00. On the 4-hour chart, dropping below 144.25 suggests more bearish momentum toward 142.35. However, if it rises above 144.25, buyers might drive it up to 146.28. The 1-hour chart indicates a downward trendline, showing bearish momentum. If prices rise above this trendline, it could attract buyers, but sellers are focused on a drop below 144.25. Upcoming data includes US Jobless Claims, US Q1 GDP, Tokyo CPI, US PCE price index, and Michigan Consumer Sentiment. The earlier section clearly explains the recent movement of USDJPY. The decline highlights a weakening dollar, mainly due to Bowman’s comments about potential interest rate cuts if inflation stays low. This shifts market expectations toward a less aggressive monetary policy in the US, usually leading to a weaker dollar across major pairs. Geopolitical issues are also important. Iran’s recent actions echo past events, adding anxiety to market sentiment. Additionally, Trump’s mention of an early Fed Chair announcement introduces another uncertainty. These narrative shifts combined with possible month-end portfolio rebalancing are affecting the dollar’s recent decline. From Tokyo, there weren’t many surprises. The central bank left interest rates unchanged and made small adjustments to bond purchases. The BoJ is focused on domestic inflation trends and external pressures from the US trade relationship, and their control over the yen suggests confidence in their approach. If we look at key trading levels, the 142.35 mark has reappeared as a potential area for buying. There appears to be real interest from buyers at this level, possibly linked to previous demand zones on smaller timeframes. A significant drop below this level could lead the pair toward 140.00, as there isn’t much historical resistance in between. The 4-hour chart shows a consistent downward trend below 144.25. This level has become a key threshold; staying below it means bearish momentum is likely to continue. If prices rise above it, markets may move upward toward 146.28, but this would require new bullish signals from the US. On shorter timeframes, we see lower highs forming beneath a respected downward trendline. This trendline serves as a barrier. However, sharp moves above it could create bullish opportunities. Sellers have already shown strong interest just above 144.25. If prices drop below it, especially with high volume, more short positions may enter the market, focusing on the next major demand area at 142.35. There’s also a lot of economic data coming up. Any significant changes in this week’s US GDP or PCE price readings could shift inflation expectations and prompt adjustments in market positioning. Tokyo’s CPI will be monitored for indications that domestic inflation could rise again, possibly energizing discussions on policy in Japan. We will also watch S&P revisions to sentiment indicators like the Michigan release. Consumer sentiment typically impacts dollar demand, and when combined with PCE shifts, it can strengthen or weaken expectations about future Fed actions. While we stick to our technical maps, macroeconomic factors are currently more impactful than usual. When inflation either exceeds or falls short of expectations, trading positions can change rapidly, especially for short-term trades or any ties to US dollar strength.

here to set up a live account on VT Markets now

South Africa’s Producer Price Index dropped from 0.5% to -0.3% in May

In May, South Africa’s Producer Price Index (PPI) fell to -0.3%, down from 0.5% in April. This indicates a trend in producer costs within the South African economy. In global markets, the Euro strengthened against the US Dollar and traded near 1.1700. The British Pound remained strong, staying above 1.3700 due to a weaker US Dollar.

Commodity Price Movements

Gold prices saw a slight increase but did not exceed $3,350 during early European trading. Bitcoin Cash gained 2%, nearly reaching $500. Tensions are rising in the Persian Gulf due to fears that Iran might block the Strait of Hormuz. This concern intensified after recent US military actions in the area. South Africa’s drop in the Producer Price Index to -0.3% indicates a reduction in the prices that producers receive for goods. This suggests that cost pressures are easing in the supply chain, which may impact pricing strategies and profit margins across various export-related sectors. Generally, when producer prices decline, we can expect changes in consumer inflation and adjustments in firms’ profit planning. These shifts may influence monetary policy and currency values, particularly concerning the South African Rand (ZAR). With the Euro moving closer to 1.1700 against the US Dollar and the Pound staying above 1.3700, the USD is facing broader pressure. This trend seems related to decreasing expectations around the Federal Reserve tightening, alongside strong data from both the Eurozone and the UK. For those involved in currency derivatives, adjustments and implied volatilities, especially for the one-month period, may begin to reflect these shifts more clearly. During such times, we often see price ranges tested more quickly than anticipated, particularly as dollar-negative positions gain traction.

Market Reactions and Strategies

Gold’s inability to break through $3,350 in Europe shows a reluctance to fully embrace bullish positions amid global uncertainties. While there have been moderate ETF inflows, there is no clear sign of a major breakout. Safe-haven interest continues to provide some support, but market positioning remains cautious due to steady real yields and a lack of urgency in inflation hedging. Many tracking options flow have noted slight drops in implied volatilities, particularly at the high end, while short-term gamma has remained stable, indicating a balanced market with a neutral tendency. Bitcoin Cash’s 2% rise, nearing $500, reflects a growing risk-on sentiment in the digital asset market. We see pockets of momentum, particularly among altcoins outperforming major cryptocurrencies lately. There are signs that traders are seeking directional exposure, anticipating a potential breakout. However, historical resistance around $510-520 often triggers profit-taking, so flexibility in positioning is essential. Currently, shorter trades seem favored over longer strategies. Escalating tensions near the Strait of Hormuz are a significant concern. Fears of disruption from Tehran, especially following US military involvement, are impacting freight risk premiums and raising speculation about oil transport restrictions. Volume in oil-linked contracts has increased, along with notable shifts in open interest for energy futures. For those concerned with geopolitical events, this represents not only an upside risk for crude oil but also affects transport costs and shipping insurance, contributing to inflation-linked pricing. Volatility surfaces suggest a heightened response, anticipating longer-term tensions. Monitoring how energy hedges adjust will be crucial. Proper positioning in related derivatives requires not only directional insight but also an understanding of how swiftly the market reacts to news from this key region. Create your live VT Markets account and start trading now.
here to set up a live account on VT Markets now

The European session sees few key events as US jobless claims and GDP draw attention amid economic concerns.

In the European session, ECB and BoE officials are scheduled to speak, but no changes in their current positions are expected. During the American session, key reports will be released, including US Durable Goods Orders, the final Q1 GDP, and US Jobless Claims. Durable Goods Orders are generally volatile and usually do not have a strong impact on the market. GDP data is often seen as outdated and does not significantly influence market decisions, which focus more on future expectations.

US Jobless Claims

Jobless Claims data is a crucial indicator of the labor market and provides up-to-date insights on employment trends. If the labor market shows clear signs of weakening amid rising inflation expectations, the Federal Reserve might consider rate cuts. Initial Claims are forecasted at 245,000, while Continuing Claims are expected to reach 1,950,000. However, some factors may affect these numbers, such as seasonal increases in claims during the summer and challenges in finding jobs due to economic uncertainty. Recent increases in Continuing Claims might not just indicate layoffs, but also difficulties in re-employment. Important speaker times in GMT include BoE’s Breeden at 08:30, ECB’s de Guindos at 09:45, and ECB’s Schnabel at 11:00. Fed and ECB officials will also speak later in the day. This text describes several economic events happening today. Although European central bank officials will speak, their views are expected to remain unchanged. They are likely to repeat what they have said in the past. Consistency from leaders like Breeden and de Guindos has become the norm, and markets seem to have adapted to their positions. Attention then shifts to the United States in the afternoon, where several important data points will be released. While Durable Goods Orders are on the agenda, their unpredictable nature means that many market participants may overlook them. This dataset often undergoes revisions and experiences sharp monthly changes, making the initial release less relevant. As a result, markets might ignore the headline entirely.

Market Focus and Policy Implications

The final reading of Q1 GDP will also be released, but the market already has a clear idea of what this will show. Since it reflects the state of the economy from months ago, it acts more as a historical reference than a guide for the future. By release time, investors are often more focused on current indicators. More important is the Jobless Claims data. Weekly claims provide a timely snapshot of employment trends. Predictions for initial claims hover around 240,000, with continuing claims expected to approach two million. While these figures are higher than previous months, they aren’t necessarily alarming by themselves. Context is important. An increase in the number of individuals relying on jobless benefits suggests difficulties in the labor market. There are seasonal trends during late spring and early summer that typically push claims higher—stemming from education, tourism, and contracts ending. This time period often introduces temporary distortions in labor market data, making it tricky to determine if the numbers represent short-term noise or a meaningful shift. If there are several weeks of rising continuing claims, especially without significant layoffs, it may indicate that workers are struggling to find new jobs. These updates are crucial when considering policy expectations. Fed Chair Powell and colleagues are already closely examining the labor market, and any substantial weakening could lead to changes in central bank policies. If inflation expectations rise but job data begins to weaken consistently, trade-offs will become more evident. As policymakers speak throughout the day, their statements are likely to be cautious. Schnabel and de Guindos will likely stick to known positions. However, slight changes in their wording can still influence market pricing, though shifts in tone typically reflect cumulative signals rather than isolated comments. For those who rely on short-term rates and volatility, it’s essential to stay alert for significant data shifts, even in a calm consensus environment. Since rates influence decisions on leverage, market positions should prioritize clarity over uncertainty. While Durable Goods and GDP data create background noise, labor market data—whether clear or messy—should be the main focus. Create your live VT Markets account and start trading now.

here to set up a live account on VT Markets now

Back To Top
Chatbots