Safe-haven demand strengthens the Swiss franc amid trade tensions, keeping USD/CHF near 0.7720 for five days
USD/CHF fell for a fifth straight day and traded near 0.7720 during Asian hours on Thursday. The Swiss Franc rose on safe-haven demand as trade tensions picked up again.
Donald Trump moved ahead with new 10% tariffs on trading partners, even after the US Supreme Court blocked part of his proposed duties. In his State of the Union address, he said the US economy is recovering, argued that tariffs support growth, and criticised the Court’s decision.
The Swiss Franc also got support as markets scaled back expectations for near-term Swiss National Bank rate cuts. Swiss inflation was unchanged at 0.1% in January. That is within the SNB’s 0–2% target range and matches its first-quarter outlook.
The Swiss ZEW Expectations Index rose to 9.8 in February from -4.7 in January. This was its second-highest level since January last year. It also supports expectations that the SNB policy rate will stay at 0% through 2026.
Markets are watching Switzerland’s Q4 employment data due later on Thursday, and Q4 GDP on Friday. In the US, weekly initial jobless claims are due during the North American session.
We still see the Swiss Franc holding firm as trade talks between the US and the European Union keep markets on edge. This is similar to the safe-haven buying seen during the tariff disputes in early 2025. USD/CHF is now near 0.8850, well above last year’s lows, but selling pressure is starting to build again.
The Swiss National Bank is giving little reason to expect a shift away from its tight policy stance, which supports the franc. Swiss inflation for January 2026 came in at 1.2%. That is still within the SNB’s target range and well above the 0.1% seen at the start of last year. With the SNB’s next meeting in March, markets expect the policy rate to stay at 1.75%.
On the US side, recent data points to slower momentum, which could weigh on the dollar. The latest Non-Farm Payrolls report showed job growth of 185,000, below forecasts, and January inflation eased to 2.9%. This gap—steady conditions in Switzerland and a softer US outlook—supports the case for a lower USD/CHF.
In the weeks ahead, we think traders should look at strategies that limit exposure to a move higher in the pair. One option is to buy USD put options with a strike below the 0.8800 support level. This offers a defined-risk way to position for a potential drop. It lets traders benefit if the pair falls, while limiting the maximum loss to the premium paid.
We also remember the steep fall during the 2025 trade tensions, when the pair dropped below 0.8000. Today’s tensions are different, but the pattern is familiar: in uncertain times, investors often move into the Swiss Franc. Past volatility in these periods suggests that even small changes in geopolitical sentiment can trigger big moves in this pair.
EUR/USD rises for a second session but faces resistance near 1.1830 at the H4 100-SMA during Asia
EUR/USD rose for a second day and traded near 1.1830 in Thursday’s Asian session. The US dollar stayed weak as traders worried about the economic impact of US President Donald Trump’s trade policies.
The RSI is 56. This points to improving upside momentum, but it is not yet overbought. Earlier, the RSI was below 30. The MACD line is slightly above the signal line and just in positive territory, with a small positive histogram.
Near Term Technical Outlook
The move higher stalled near the 100-period SMA on the 4-hour chart. A clean break above this level could push the pair toward 1.1860, then 1.1900. Support is near 1.1790, followed by 1.1760, where the latest bounce started. Staying above 1.1790 keeps the bullish bias in place. A drop below 1.1760 would weaken the rebound and suggest a broader range. The technical analysis was produced with the help of an AI tool. EUR/USD is showing modest strength and is trading around 1.0750. This follows recent European Central Bank comments that kept rates at 2.75% but signaled possible cuts ahead. That contrasts with the US Federal Reserve’s firmer stance at 3.50%. This policy gap is the main factor driving the current market tension.Key Levels And Trading Approach
We have seen similar policy-driven uncertainty before. For example, trade disputes in the late 2010s led to sharp and uneven swings. More recently, in 2025, the pair dropped quickly after an unexpected Fed rate hike. These episodes show that even when price is moving sideways, major news can still trigger a strong breakout. Technically, the Relative Strength Index (RSI) is near 52, which signals a neutral market with limited momentum. The MACD is also flat and close to its signal line. This supports the view that neither buyers nor sellers are in clear control. As a result, it makes sense to wait for a stronger signal before taking a directional trade. A key level to watch in the coming weeks is the 50-day Simple Moving Average at 1.0790. A sustained break above it would suggest fresh bullish strength and could open a move toward resistance at 1.0850. Traders could then consider short-term call options to benefit from the upside follow-through. On the downside, initial support is at 1.0720, which has held on recent pullbacks. A clear close below 1.0720 would suggest rising bearish pressure, possibly helped by a wider interest rate gap. If that support breaks, traders may look at put options targeting the 1.0650 area. For now, the safest approach is to wait for a confirmed break out of this range. The latest US inflation data showed CPI still high at 2.9%, which may support the dollar. Opening new derivative positions before price clearly moves through 1.0790 or 1.0720 adds unnecessary risk. The market is still waiting for its next major catalyst, so trading plans should reflect that patience. Create your live VT Markets account and start trading now.FXStreet-compiled data shows India’s gold prices rose in Thursday’s trading session.
Gold prices rose in India on Thursday, according to FXStreet data. Gold was priced at INR 15,217.13 per gram, up from INR 15,092.72 on Wednesday.
The price per tola increased to INR 177,489.60 from INR 176,038.50 a day earlier. Other listed rates were INR 152,171.30 for 10 grams and INR 473,306.00 per troy ounce.
How FXStreet Calculates Indian Gold Prices
FXStreet calculates Indian gold prices by converting international prices using USD/INR, then applying local measurement units. The figures are updated daily at the time of publication and are for reference only. Local rates may differ slightly. Central banks hold more gold than any other group. According to the World Gold Council, they added 1,136 tonnes—worth about $70 billion—to reserves in 2022. That was the biggest annual purchase since records began. Gold often moves in the opposite direction of the US Dollar and US Treasuries. It may also move against risk assets. Key influences include interest rates, recession worries, and geopolitical instability. The post says an automation tool was used to create it.Key Drivers Traders Are Watching
Gold prices are rising, which fits its long-standing role as a hedge during uncertain times. This move is being helped by a US Dollar that has eased from the highs of the past year. Derivatives traders should keep this inverse relationship in mind as a useful signal going forward. Markets are also responding to expectations that the US Federal Reserve will cut interest rates later this year. After the sharp rate hikes of 2023 and 2024, the tightening cycle now appears to be ending. That can make a non-yielding asset like gold more appealing. CME FedWatch Tool data currently points to a 70% chance of at least two rate cuts before 2027, showing a meaningful shift in expectations. Central-bank demand remains strong as well. After the record buying in 2022, the World Gold Council reports that central banks bought more than 1,000 tonnes per year in both 2023 and 2024, and other reports indicate the trend continued through 2025. This steady demand can help support gold prices over the long term. Global growth is also showing signs of slowing. Recent IMF forecasts were revised lower for the second half of 2026. The risk of slower growth, combined with ongoing geopolitical tensions, increases gold’s safe-haven appeal. A similar pattern played out in 2025, when stock-market volatility pushed more investors toward gold. With these factors in mind, some traders may look at long positions using futures to benefit from further upside. Options traders might consider buying call options or using bull call spreads to limit risk while positioning for higher prices. It is also worth watching volatility, as rising volatility can signal stronger market conviction. Create your live VT Markets account and start trading now.USD/JPY keeps retreating from two-week highs, as sellers test 155.75 support at the 200-day SMA and 23.6% Fibonacci confluence
USD/JPY pulled back from the 156.80–156.85 area, a two-week high, and slipped to around 155.75 during Thursday’s Asian session. This ended a two-day rally after sellers stepped in.
The Japanese Yen strengthened following hawkish comments from Bank of Japan officials, which reinforced expectations of more policy tightening. The Yen also found support from trade uncertainty and geopolitical risks ahead of US-Iran nuclear talks, along with mild US Dollar softness.
Technical Support In Focus
The decline paused near 155.75. This level is where the 200-period simple moving average on the 4-hour chart aligns with the 23.6% Fibonacci retracement of the 152.34–156.85 move. A clean break below this area could lead to more downside. The next supports are the 38.2% Fibonacci retracement at 155.15, followed by the 50.0% level at 154.60. If the sell-off continues, the 61.8% retracement at 154.06 could come into view. The RSI is near 55 after failing to hold close to 70. The MACD line is just above the signal line near zero, suggesting weak directional momentum. The Bank of Japan targets inflation near 2%. It introduced QQE in 2013, added negative rates and yield control in 2016, and raised rates in March 2024.Shift In Macro Backdrop
Back in 2025, USD/JPY repeatedly tested 155.75, which was a key support zone at the time. Today, the picture looks very different. The US-Japan interest rate gap has narrowed sharply, and market conditions have changed as the Bank of Japan continued to normalize policy. The BoJ’s shift began with its first rate hike in March 2024 and has remained a major driver. Since then, it has made a few more small moves in response to domestic inflation, which has stayed above the 2% target for most of the past 18 months. As of January 2026, Japan’s core inflation was 2.3%, supporting the central bank’s tighter stance. On the US side, the Federal Reserve has been easing policy as inflation cooled. US core inflation is now closer to 2.5%, well below the levels seen in 2024 and 2025. This has given the Fed room to cut rates several times. As a result, the policy gap has flipped, adding steady downside pressure on the dollar versus the yen. For traders, this backdrop makes aggressive USD/JPY bullish bets more risky. Consider positions that benefit from further yen strength, such as buying JPY calls or USD puts. Another approach is selling out-of-the-money USD/JPY call spreads to generate income while keeping the view that upside may now be limited. The main technical level to watch is the 200-day moving average, near 144.50. A decisive break below it could trigger another wave of selling and bring the 140.00 psychological level into focus. A strong rebound may be hard to sustain as long as the narrowing rate differential story remains in place. Create your live VT Markets account and start trading now.S&P 500 E-mini futures trade sideways with a slight bullish bias as traders assess an ongoing five-wave cycle
S&P 500 E-Mini Futures (ES) has mostly moved sideways, with a slight upward bias, since October 2025. A short-term cycle from the 21 November 2025 low is still developing as a five-wave Elliott Wave move.
Wave 1 ended at 7043, the index’s all-time high. Price then fell in a zigzag: wave ((a)) ended at 6864.5 and wave ((b)) ended at 7011.5.
Wave Structure And Key Levels
Wave ((c)) dropped to 6791.6, which completed wave 2 at a higher degree. From 6791.6, the index turned up into wave 3. However, the market still needs a break above 7043 to rule out a larger double correction. From the wave 2 low, wave (i) rose to 6925.75, then wave (ii) fell to 6828.5. In the near term, 6791.6 is the key pivot. Any pullback should hold above this level, ideally within a 3-, 7-, or 11-swing sequence. Momentum is still tilted higher, but the bullish case needs confirmation from a sustained move above 7043. Based on the late-2025 analysis, ES is in a constructive, but still unconfirmed, uptrend. The sideways trade since 7043 has helped build a base for a potential third wave higher. For traders, the main focus is the 6791.6 pivot. It must hold to keep the bullish outlook valid.Options Positioning For Breakout And Support
With this setup, one possible strategy for the coming weeks is selling out-of-the-money put credit spreads with the short strike below the 6791.6 pivot. With the VIX recently near 14, option premiums are still reasonable for trades that benefit from time decay and from the market staying stable or moving higher. This fits the view that dips should find support as long as the key low holds. For traders looking for a confirmed breakout, building long exposure with bull call spreads aimed at a move above 7043 can make sense. This limits risk while positioning for the larger upside move expected in a third wave. A strong close above the prior high would likely bring in new buying and speed up the advance. This technical setup is also supported by recent January 2026 fundamentals: core inflation cooled to 2.8%, and job growth came in at a steady (but not overheating) 195,000. This lowers the risk of unexpected central bank moves and supports the market’s underlying tone. In past examples, such as Q2 2023, long periods of quiet sideways action have often been followed by strong, sustained trends. Even so, discipline is critical. A break below 6791.6 would invalidate this bullish wave count. That would point to a larger double correction and require a quick shift to a defensive or bearish stance. In that case, traders would likely need to exit bullish positions and consider buying puts for downside protection. Create your live VT Markets account and start trading now.NZD/USD rises for a third day to near 0.6000 as tariff worries weaken the US dollar
NZD/USD rose for a third straight day and traded near 0.6000 in Asian hours on Thursday. The pair moved higher as the US Dollar stayed weak, with markets still unsure about White House economic policy.
In Tuesday’s State of the Union address, President Donald Trump said the US economy is rebounding. He defended tariffs and criticised the Supreme Court for striking down part of his tariff policy.
Imf Sees Tariffs Adding To Inflation
IMF Managing Director Kristalina Georgieva said US goods inflation has been driven in part by tariffs. She said moving the federal funds rate toward 3.25%–3.50% would be consistent with a return to full employment. She also said public debt will need firm fiscal action to get onto a clear downward path. In New Zealand, the ANZ Business Confidence Index fell to 59.2 in February from 64.1 in January. The ANZ Activity Outlook rose to 52.6 from 51.6. Inflation expectations climbed to 2.93% from 2.77%, the highest since April 2024. RBNZ Governor Anna Breman said inflation is expected to return to the target range in the first quarter of this year. She said progress toward 2% inflation has been uneven. We see the US Dollar’s weakness as a direct result of continued political uncertainty around tariff policy. The latest US inflation data for January 2026 showed prices still rising 3.4% year over year. This supports the view that tariffs are keeping inflation sticky. In this environment, we are reluctant to hold large long positions in the US Dollar.Policy Divergence And Market Volatility
The IMF’s call to cut the federal funds rate toward 3.25% highlights a key problem: tariffs can push inflation up, while lower rates would add stimulus. With the Fed currently at 4.00%, a move down to that range would be a major dovish shift. This tension is a major source of uncertainty and could keep pressure on the dollar in the weeks ahead. In contrast, New Zealand’s backdrop is more supportive for the Kiwi. Inflation expectations have risen to 2.93%, and official Q4 2025 inflation was 3.1%, still above the central bank’s target. That makes it less likely the Reserve Bank of New Zealand will move quickly toward easier policy. For derivative traders, this policy gap argues for NZD/USD call options. This can position for further upside, with strike prices above 0.6000, such as 0.6050 or 0.6100. This provides upside exposure while keeping risk capped if US policy clarity improves suddenly. Mixed signals may also lift market volatility. A US administration leaning toward tariffs, alongside the possibility that the Federal Reserve may need to cut rates, could create larger swings in NZD/USD. Strategies that benefit from higher implied volatility may also work well. We saw a similar setup in 2022–2023. Currencies backed by more aggressive, inflation-fighting central banks tended to outperform those where policy direction was less clear. History shows rate differentials can be a powerful driver in FX. This strengthens our view that the Kiwi is well placed to gain against the US Dollar. Create your live VT Markets account and start trading now.During Asian trading, GBP/USD holds near 1.3565, preserving weekly gains as trade-policy uncertainty weighs on the US Dollar
Sterling held weekly gains near 1.3565 against the Dollar in Thursday’s Asian session. The Dollar stayed under pressure as traders faced uncertainty over US trade policy. The US Dollar Index (DXY) edged lower to around 97.55.
GBP/USD rose 0.42% on Wednesday and moved back toward 1.3600. The pair had traded for several days in a roughly 1.3450 to 1.3520 range. The rebound followed a pullback from the late-January high near 1.3870 and pushed price back toward the 20-day EMA.
Dollar Pressure And Sterling Levels
UK CPI inflation fell to 3.0% in January from 3.4% in December, according to the ONS. This was the lowest reading since mid-2025. Markets priced in about an 80% chance of a 25 basis point Bank of England cut at the 19 March meeting. Services inflation was reported at 4.4%. UK unemployment rose to a five-year high of 5.2%, which added to expectations of easier policy. In the US session on Wednesday, GBP/USD traded at 1.3523, up 0.29%. With little data released, markets focused on central bank comments and uncertainty over trade policy. At this time in 2025, the Pound was holding near 1.35 against a weak US Dollar. Today, with GBP/USD closer to 1.2750, the picture has clearly flipped. Last year, broad Dollar weakness drove the move. That theme has since faded. In 2025, markets were confident the Bank of England would cut rates in March after inflation dropped sharply to 3.0%. However, the Bank’s warning on services inflation proved important. The latest January 2026 CPI data shows inflation is still high at 3.8%. That makes near-term rate cuts much less likely than they seemed a year earlier. For derivatives traders, this suggests implied volatility on GBP options may be too low. A slowing UK economy alongside sticky inflation can set up a sharp move in the currency. Ahead of the next BoE meeting, strategies such as long straddles may be worth considering, since they can benefit from a large move in either direction.Shifting Rate Divergence
Back then, the US Dollar Index (DXY) was struggling near 97.55. It now sits firmly above 104. Recent data supports that strength: US non-farm payrolls in January 2026 beat expectations again, with 295,000 jobs added. The Federal Reserve is now seen as much more hawkish than the Bank of England. Because of this, the story has shifted from broad Dollar weakness to sterling-specific pressure. Watch closely for further signs that the UK is weakening while the US stays more resilient. In that kind of backdrop, buying GBP/USD put options can be an attractive hedge or speculative trade. Past moves show the pair can revisit post-Brexit lows below 1.20 when this divergence becomes more pronounced. Create your live VT Markets account and start trading now.Dividend Adjustment Notice – Feb 26 ,2026
Dear Client,
Please note that the dividends of the following products will be adjusted accordingly. Index dividends will be executed separately through a balance statement directly to your trading account, and the comment will be in the following format “Div & Product Name & Net Volume”.
Please refer to the table below for more details:
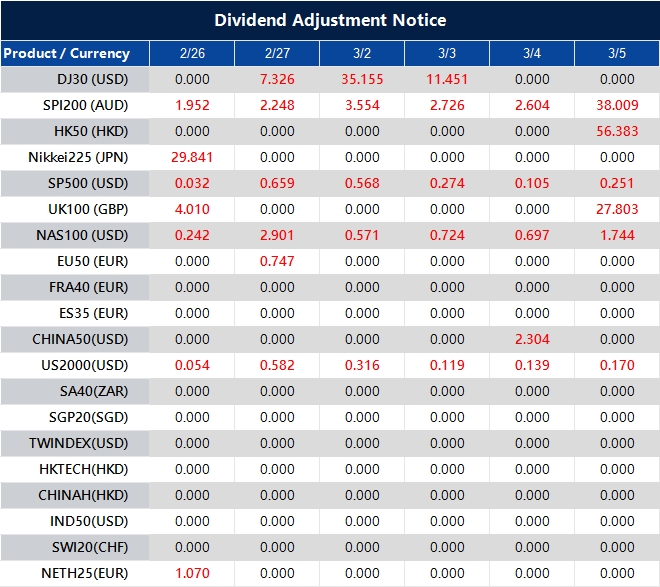
The above data is for reference only, please refer to the MT4/MT5 software for specific data.
If you’d like more information, please don’t hesitate to contact [email protected].
Trump’s Tariffs Ruling: When Consumers Lose, But Corporations Stand To Gain
On 20 February 2026, the US Supreme Court delivered one of the most consequential trade rulings in modern American history.
In a 6-3 decision on Learning Resources v. Trump, the Court struck down 70% of the tariffs imposed under President Trump’s “Liberation Day” executive orders, ruling that the International Emergency Economic Powers Act (IEEPA) does not grant the President the power to tax, a right strictly reserved for Congress.
The ruling was widely hailed as a return to constitutional order.
But the immediate aftermath has been anything but orderly. Markets are recalibrating, the dollar is under pressure, and a $175 billion question now hangs over the economy.
Here is what traders need to understand about the financial fallout, and whether these tariffs ever made economic sense in the first place.
The Financial Fallout
The Court’s decision has created an immediate fiscal vacuum. Since April 2025, the US government collected roughly $175 billion in duties that are now considered unlawful, and the refund process is shaping up to be a costly ordeal.
Large corporations, like Walmart, Costco, and LVMH have the legal firepower to file thousands of claims and are first in line to reclaim billions. The problem is that roughly 90% of those tariff costs were already passed down to consumers through higher retail prices.
Ordinary shoppers will see none of that $175 billion return. Instead, the money flows back to corporate balance sheets, where it is more likely to fuel stock buybacks than lower the price of goods.
Within hours of the ruling, the White House moved to plug the gap. The administration invoked Section 122 of the Trade Act of 1974, imposing a temporary 15% global surcharge as a strategic bridge while it explores more durable measures under Sections 301 and 232.
However, experts are already pushing back. Section 122 was designed for the gold-standard era of the 1970s and is widely considered ill-suited to today’s floating exchange rate environment. That near-guarantees a fresh round of litigation and prolonged uncertainty for businesses trying to plan.
The Fiscal-Monetary Intersection
The ruling has fundamentally reshaped the outlook for both the US dollar and equity markets, and the effects are moving through two distinct channels: fiscal and monetary, with the Federal Reserve sitting squarely at the centre of the storm.
The most immediate pressure point is the federal budget. The sudden loss of approximately $150 billion in annual tariff revenue has punched a significant hole in a budget already under considerable strain, with the national debt standing near $38.7 trillion.
To offset that lost revenue, the government will need to increase Treasury issuance. That means more debt flooding into the bond market.
That surge in supply is pushing yields higher, particularly at the long end of the curve. For equity markets, this “yield squeeze” cuts both ways. Higher yields raise the cost of borrowing and crowd out private investment, weighing most heavily on tech-heavy stocks that are especially sensitive to rising rates.
On the currency side, the near-term picture points to mild downside pressure on the dollar. With tariff removal easing imported inflation, markets are increasingly pricing in earlier or deeper rate cuts from the Federal Reserve, which narrows the interest rate differentials that had previously supported the greenback.
The medium-term trajectory, however, is defined by a deeper tension. If interest payments on the ballooning national debt continue to outpace primary government expenditure, the US could find itself effectively printing money to cover the shortfall.
It’s a scenario that would inflict significant structural damage on the dollar.
To defend the dollar’s reserve currency status, the Federal Reserve under Kevin Warsh may need to adopt aggressive hard money tactics.
That could mean cutting rates strategically to ease the government’s interest burden, halting Treasury bill purchases to stop further monetary expansion, and uncapping bank cash-holding ratios to drive internal demand for the dollar within the financial system.
Did The Tariffs Actually Help the US?
To answer that fairly, the rhetoric needs to be set aside and the 2025 data examined on its own terms.
The primary justification for the tariffs was to close the trade gap. According to the Bureau of Economic Analysis, the 2025 trade deficit came in at $901.5 billion, a negligible 0.2% improvement from 2024.
Even where imports were disrupted, the adjustment largely came through trade diversion rather than the promised reshoring of American industry. Companies simply sourced from alternative countries, while retaliatory measures from trading partners dampened demand for US exports.
The jobs story is equally sobering. The tariffs were marketed as a lifeline for the American heartland, but between April and December 2025, the manufacturing sector shed 72,000 jobs.
Because roughly half of US imports are inputs for domestic production, like parts, chemicals, and raw metals, the tariffs effectively acted as a tax on American factories, eroding their global competitiveness rather than strengthening it.
On the fiscal side, tariff revenues proved largely cosmetic.
Once stripped out, the federal deficit under the tariff regime was larger than headline figures suggested, leaving the structural problem of fiscal overspending completely untouched.
With federal debt now approaching $39 trillion, the Court’s ruling has exposed an uncomfortable truth: tariffs were never a durable solution to America’s budget imbalance.
Final Verdict: Was The US Better Off?
Financially and structurally, the answer is no. A handful of primary metal producers saw a brief uptick in activity, but the broader economy absorbed higher consumer costs and a contraction in manufacturing employment. The gains were narrow; the pain was widespread.
The Supreme Court has corrected a constitutional overreach, and that matters. But the ruling has also laid bare what might be described as a robbery in plain sight. The public paid the tax, the government spent the revenue, and now corporations will keep the change. The $175 billion does not return to the people who funded it.
FAQ
What should traders be aware of following this Supreme Court ruling?
Watch Treasury yields for signs of further upward pressure as debt issuance rises. Monitor the dollar closely. Near-term weakness is likely as rate cut expectations build, but the medium-term picture depends heavily on how aggressively the Fed moves to shore up dollar credibility.
Finally, keep an eye on equity markets, particularly the tech sector, where the yield squeeze will continue to test valuations.
What does Section 122 say about tariffs?
Section 122 is a part of the Trade Act of 1974 that gives the US President a temporary authority to impose tariffs without long investigations or detailed reviews. This provision allows the US president to impose tariffs of up to 15%.
Trade activities under this provision can only last for 150 days unless extended through other trade authorities.
How did the Federal Reserve react to the US Supreme Court ruling on Trump’s tariffs?
Federal Reserve officials downplayed major policy shifts.
Fed Governor Christopher Waller stated the ruling would not significantly alter his interest rate outlook, supporting a pause on cuts if labour markets stabilise, and emphasised looking past temporary tariff effects on inflation.
Chicago Fed President Austan Goolsbee suggested the decision could help cool inflation.
St. Louis Fed President Alberto Musalem noted that replacement tariffs under other laws like Section 122 would leave his forecasts largely unchanged, though he plans to speak with CEOs to understand the impact of tariff uncertainty on companies.
Silver rises for a second day amid White House policy uncertainty, nearing $90 in Asian trading hours
Silver rose for a second straight day, trading near $90.00 per troy ounce during Asian hours on Thursday. Demand for safe-haven assets increased as uncertainty grew around White House economic policy.
In Tuesday’s State of the Union address, Donald Trump gave no sign that tariffs will ease. Section 122 tariffs were raised to 10%, after earlier threats of 15%. This followed a Supreme Court ruling 10 months ago that struck down country-specific tariffs under IEEPA.


