S&P index sees a slight gain, while Dow and small caps perform well and Nasdaq declines
Funds are shifting from big tech stocks to the Dow 30 and small-cap stocks. The NASDAQ index has dropped by 111.2 points, or 0.55%.
On the other hand, the Dow has risen by 470.66 points, an increase of 1.05%. The small-cap Russell 2000 has gained 33 points, up by 1.55%.
The S&P index sits between the Dow and the NASDAQ, with a slight increase of just 0.04%.
This trend shows a rebalancing across the stock market. The decline in large-cap tech has pulled down the NASDAQ, while money entering more traditional sectors and smaller companies has boosted the Dow and the Russell 2000. This shift isn’t just superficial — it reflects changes in market values and earnings expectations. The NASDAQ’s drop signals that investors are less interested in high-growth tech firms for now. In contrast, the Dow’s strong gain indicates a preference for sectors with more stable cash flow connected to the overall economy.
The Russell 2000’s rise of 1.55% suggests investors are looking for opportunities beyond the largest companies, as high valuations deter new investments in previous leaders. Such movements often hint at long-term trends, especially when they coincide with shifts in bond yields or central bank policies.
For those tracking short-term trends and options trading, smaller stocks often behave differently. They usually have lower liquidity and wider bid-ask spreads, but can experience sharper price movements in both directions. As a result, we expect higher implied volatility for these stocks in near-term contracts. This creates opportunities for straddle writers or short-term trades using vertical spreads.
On a broader scale, the S&P’s mere 0.04% increase suggests the market lacks a clear unifying theme right now. Instead, it reacts based on specific sector influences. In such cases, we dig deeper — it’s not just about whether the whole market is up or down, but whether certain sectors are genuinely gaining traction or just going through mechanical rebalancing.
We’re noticing growing interest in shorter-dated put options for NASDAQ stocks, with a shift in skew indicating that more investors are seeking protection against downside risk. While this doesn’t ensure a decrease in prices, it shows caution about chasing higher prices without a solid reason.
Conversely, call volumes for Russell 2000 ETFs and the underlying stocks have increased, especially for the 1–2 week timeframe. We see this as speculative trading rather than hedging, given changes in open interest and relatively low volume in similar put options.
Volume in Dow options also highlights increased weekly rotation strategies. We’re seeing selling pressure in longer-dated calls and renewed buying interest in near-term in-the-money strikes, typically favored by traders looking for short-term gains tied to earnings or economic announcements.
Expect trading volume to focus on short expiries, with delta hedging flows likely causing larger price swings late in the trading day, especially ahead of important data releases. Traders should be cautious about the timing of their trades, as liquidity can quickly diminish, particularly near market close.
In June, the ISM Manufacturing PMI rose to 49.0, surpassing expectations and indicating increased activity.
In June, the US manufacturing sector saw a small increase in activity, with the ISM Manufacturing PMI rising to 49.0 from 48.5 in May. This was better than the expected 48.8. However, the Employment Index fell to 45.0 from 46.8, showing ongoing issues in the sector’s job market.
The Prices Paid Index, which measures inflation, slightly increased to 69.7 from 69.4. Meanwhile, the New Orders Index decreased to 46.4 from 47.6 last month. Although the Production Index moved into positive territory, hiring trends remained cautious.
Market Response To The Economic Data
Following these updates, the US Dollar weakened, trading near 96.60. This drop reflects varying interpretations of the recent economic data. Even though June’s Manufacturing PMI rose to 49.0, it stayed below the crucial 50 mark that indicates whether the economy is expanding or contracting. The increase in production is contrasted by falling new orders and weaker job figures, revealing uneven growth. While production is now positive, demand is still declining. This mismatch suggests that the current production strength may not last unless new orders start to pick up. The fall in the Employment Index from 46.8 to 45.0 indicates that manufacturers are hesitant to hire new workers. This caution likely reflects careful cost management, particularly with inflation concerns resurfacing. The slight rise in the Prices Paid Index to 69.7 hints at rising costs. When costs increase, even slightly, profit margins shrink, causing companies to hesitate before adding to payroll. From a trading perspective, with hiring still weak and new orders falling for a second month, the strength in production could be vulnerable. Market participants may reconsider current pricing strategies, especially for interest rate-sensitive contracts. Labor data is crucial for understanding the overall economic direction, given its link to consumer strength and central bank guidance.Impact On The US Dollar And Market Sentiment
The US Dollar’s decline toward 96.60 reflects a cooling market sentiment regarding US growth. If employment tightens, not through new jobs but layoffs, expectations around interest rates may change. Markets could feel less pressure to tighten policy or might even begin to anticipate easing later on. This can shift perceptions around real yields, affecting currency pricing models and rate derivatives. The drop in the New Orders Index to 46.4 adds another layer of complexity. Without a clear increase in future demand, any growth in production might just lower inventories rather than signify real expansion. It’s useful to keep an eye on supplier delivery times and inventory levels alongside new orders, as these often indicate changes in production planning. Although the production index is no longer negative, the slower order rate means there may be increased demand for optionality. The risk is now tilted to the downside, which can quickly alter pricing, often leaving short gamma strategies vulnerable. Periods like this might require more dynamic hedging or the use of longer-term volatility to manage costs effectively. The market reacted quickly to the weaker aspects of the report, even though the headline PMI increased. This highlights the importance of examining specific components instead of relying solely on overall figures. Short-term trading, especially during quarter rebalancing, can exaggerate reactions to data, leading to quick pricing changes that aren’t always backed by strong macro trends. With the US Dollar weakening and real activity indicators sending mixed signals, there is an opportunity for speculative positioning to drift further away from fundamentals. In such scenarios, it’s helpful to monitor metrics like open interest and changes in skew, especially in index and treasury futures, for signs of market stress or shifts. Traders need to stay alert to how pricing pressures develop. Ongoing rises in input costs, even without significant inflation, could affect interest rate sensitivity. This may change the appeal of carry and roll strategies, especially on the 2s5s10s fly. The uneven recovery in manufacturing suggests that short-term volatility in macro-themed trades could unexpectedly increase. We believe that these imbalances require cautious positioning, especially in products vulnerable to changes in interest rate expectations or currency premiums linked directly to US economic outcomes. Create your live VT Markets account and start trading now.Trump stated that the US will replenish the Strategic Petroleum Reserves when prices are favorable.
President Trump announced plans to refill the Strategic Petroleum Reserves when oil prices are favorable. Right now, crude oil is priced at $65.67, which is up by $0.56 or 0.86%.
The price has been bouncing around between $64 and $66.33. The 100-hour moving average is currently at $65.24. Buyers are defending this average today, giving them a short-term advantage.
Monitoring Market Trends
If the price drops below this average, the trend could turn down. The key question now is whether the price will break out of its current range or fall below the moving average. This article captures a moment in the crude oil market, where traders are paying attention to both price levels and policy statements. When Trump talked about refilling the Strategic Petroleum Reserves, he indicated he might re-enter the market as a buyer, but only at prices he finds acceptable. This comment can create an informal support level for prices, though it’s not fixed. Currently, oil is priced at $65.67 per barrel, showing a mild 0.86% gain today. This small rise is significant, given that prices have been fluctuating between $64 and $66.33. Most trading activity has respected these boundaries. For those focused on short-term price movements, the 100-hour moving average at $65.24 is crucial. It’s become a key reference point. This isn’t just theoretical—it’s a critical line. Sellers have pushed prices lower but have seen buyers step in around that support. This pattern continued today, with buyers trying to keep the trend line intact. Because of this, we need to closely monitor the charts. If the price falls below that moving average and stays there, it will show that buyers have lost control. This could lead to a shift in trading dynamics, where the market trends downward.Watching For Breakouts
In this situation, it’s useful to watch the volume at each test of the range limits. As the price approaches $66.33, we want to see if volume increases—specifically, are sellers coming back strongly, or are buyers feeling confident enough to break out? Likewise, when the price dips towards $64 or the moving average, we’ll look for similar signs. It’s important to remember that this range won’t last forever. A breakout in either direction will require traders using options and futures to quickly adjust their strategies. Since the 100-hour moving average has held for several sessions, a drop below it would change market sentiment and force traders, especially those who are long, to reposition. For those of us trading derivatives, this kind of market can quickly shift against static positions. Flexibility is more crucial than the direction right now. With such a narrow market that reacts to both technical indicators and outside comments, fixed predictions can lead to unexpected losses. We will also look for signs in open interest data and options skew to see how traders are positioning their expectations. If options data shows more puts around $64, it could hint that others are bracing for a drop. A movement contrary to that evidence would be particularly significant. Clearly, support has been strong—it hasn’t just been tested, but actively defended. This makes it even more vital. If that support breaks down, the market’s direction will become clear. And when the chart reveals its trends, it’s better to listen than ignore it. Create your live VT Markets account and start trading now.Economic optimism in the United States at 48.6, below the expected 50.1
The RealClearMarkets/TIPP economic optimism index for the United States was at 48.6 in July, lower than the expected 50.1. This shows that economic optimism is fading.
Please note that forward-looking statements carry risks and uncertainties. The markets discussed here are for informational purposes only and should not be seen as a recommendation for trading or investing.
Warning About Risks
FXStreet cannot guarantee the accuracy of the information provided, as it may contain errors or omissions. There are significant risks involved in open market investing, which can lead to complete loss of investments and personal distress. The views expressed in this content are those of the authors and do not reflect official policies. There are no guarantees regarding accuracy, completeness, or suitability, and FXStreet or the author are not responsible for any errors or damages that may arise from using this information. This initial section indicates that economic sentiment among US consumers and investors has weakened going into July. A drop below the midpoint of 50 on the RealClearMarkets/TIPP index suggests growing concerns about issues like inflation, employment confidence, or overall economic policy. The number 48.6, though close to the forecast of 50.1, is significant and should be taken seriously. Markets often respond to even small deviations from expectations. Indices like this one are valuable because they capture changing moods across different sectors. When sentiment dims, risk premiums tend to increase, leading to higher chances of unexpected volatility. From our viewpoint, the key point is not just the number itself, but how it changes behavior. Traders often focus on hints from central banks, corporate earnings, and consumer credit. If optimism dips, there might be adjustments regarding interest rate cuts or projections for stock performance. Fixed income traders may also change pricing strategies if disinflation no longer seems straightforward.Changes in Derivatives Positioning
Given the current climate, short-term derivatives should emphasize macro hedging over optimistic exposure. When consumer confidence drops below a critical point, it can influence not only stock performance but also sector shifts, implied volatility, and correlations across assets. Attention may shift toward budget constraints—both fiscal and personal—which is important for risk traders. Utility and staple investments might gain more focus, while protection against downturns in discretionary sectors could also be prioritized over high-risk investments. There may be a steepening in volatility surfaces, indicating that options are not only for hedging but also represent directional views. When indexes drop unexpectedly, there is often some speculative unwinding, especially in leveraged ETF options and close-to-the-money call spreads. While this is not a guaranteed response, tail hedge flows typically increase, especially in broader indices, while sector-specific flows may become more varied. Additional pressure can lead to more options selling from those seeking to earn yields. However, this can be risky in environments where political or earnings surprises could deepen pessimism. Positions that rely on low-volatility assumptions need careful consideration of upcoming events. As a result, upcoming inflation reports, job statistics, and earnings guidance will be particularly important. A weak consumer mood can elevate sensitivity to any declines in overall demand. Adjustments to implied moves in derivatives may be necessary, focusing more on shifts in skew or decreases in realized volatility correlation. In the short term, any sudden changes from monetary authorities, whether they lean hawkish or dovish, could trigger strong reactions. The price of options may increase not only due to higher risk but also because of greater uncertainty. This can lift premiums across the board. Traders should closely monitor their exposure to upcoming events, especially those that may change current expectations. When optimism dips, even slightly, it becomes essential to consider a broader range of outcomes. This is not the time to assume that previous patterns will simply return. Create your live VT Markets account and start trading now.Dividend Adjustment Notice – Jul 01 ,2025
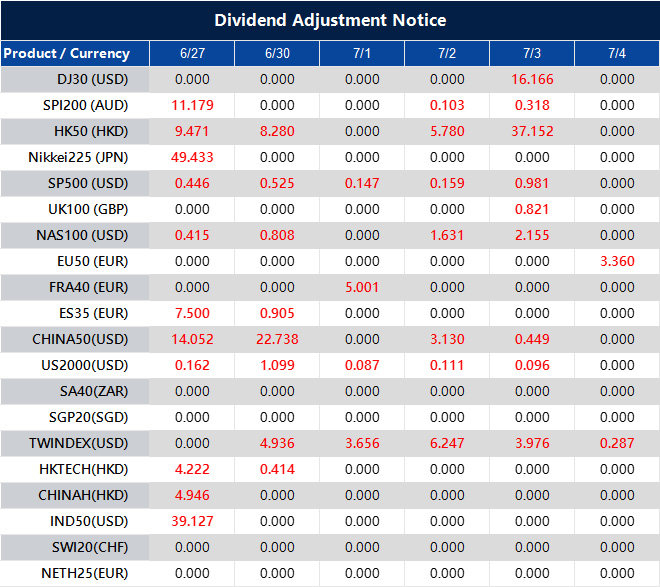
Dear Client,
Please note that the dividends of the following products will be adjusted accordingly. Index dividends will be executed separately through a balance statement directly to your trading account, and the comment will be in the following format “Div & Product Name & Net Volume”.
Please refer to the table below for more details:
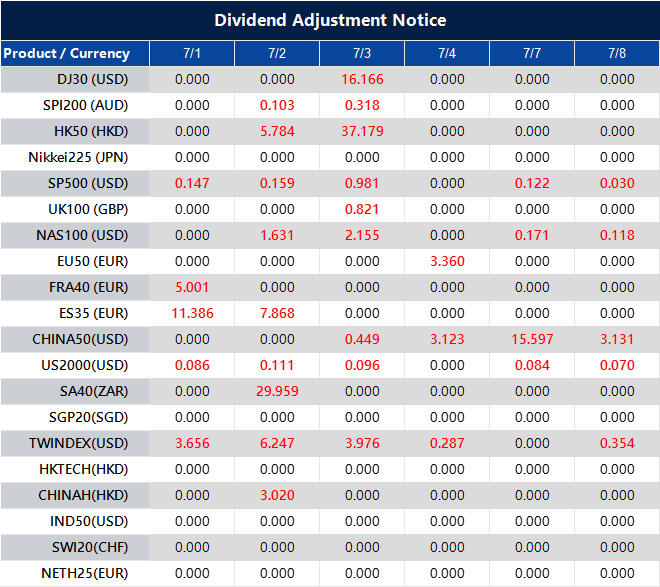
The above data is for reference only, please refer to the MT4/MT5 software for specific data.
If you’d like more information, please don’t hesitate to contact [email protected].
S&P 500 Holds Firm Following Fresh Record Highs

US equities began the new quarter on a confident note, with the S&P 500 rising 0.52% on Monday to close at 6,204.05 after reaching an intraday peak of 6,219.65. The Nasdaq added 0.47%, while the Dow Jones Industrial Average advanced by 0.63%, buoyed once again by robust gains in major technology names.
Microsoft and Meta Platforms were at the forefront of the rally, both setting fresh record highs and helping lift the Nasdaq to a strong quarterly close. Optimism was further fuelled by news that Canada would shelve its planned digital services tax, an announcement aimed at reducing tensions with the United States ahead of upcoming trade discussions.
Trade Developments And Fed Hopes Underpin Confidence
Investor sentiment was lifted by Canada’s decision to abandon its digital tax plan, which had been a sticking point in US-Canada relations. This move has smoothed diplomatic ties just ahead of President Trump’s 90-day tariff pause, with negotiations continuing between the US and several key trading partners, including Mexico, India, and Vietnam.
Meanwhile, US Treasury yields edged lower as economic indicators showed signs of softening. This decline, combined with cautious rhetoric from Federal Reserve officials, reinforced expectations of potential rate cuts later this year. Lower yields have provided additional support to equity valuations, particularly in interest-sensitive industries such as technology and real estate.
Technical Analysis
On the 15-minute chart, the S&P 500 remains well-supported above its 30-period moving average. The index rebounded firmly after touching 6,136.65 on Friday, and momentum indicators such as the MACD histogram have returned to positive territory. The MACD signal lines are also beginning to slope upward, suggesting the potential for further gains, albeit with moderate strength.
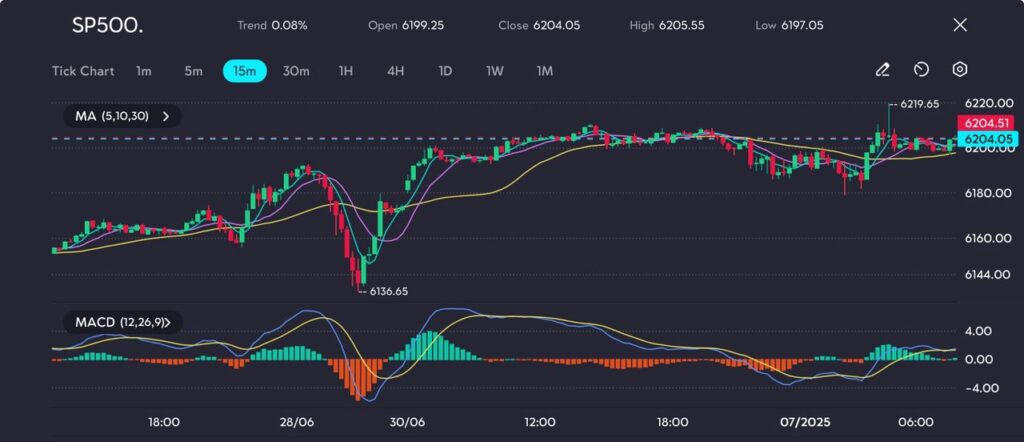
With the S&P sitting near all-time highs, resistance remains at 6,220. A sustained break above this level could trigger fresh upside. However, profit-taking and headline risks may keep the index oscillating between 6,180 and 6,220 in the near term.
The bullish equity trend may continue if trade negotiations progress and U.S. macro data remains soft but stable. However, stronger-than-expected inflation or labour figures could temper rate cut expectations and weigh on stock momentum.
Week Ahead: Rate Cuts Loom Large On Market Radar

The recent stock market rally is being fuelled less by corporate performance and more by shifting expectations around US interest rate policy. Traders are betting that Federal Reserve Chair Jerome Powell will soon be forced to step back. Figuratively for now, but perhaps literally too, as political pressure builds and the Fed navigates a narrow path between inflation control and fiscal constraints.
At the centre of this tension is a growing standoff between President Donald Trump and Powell. Although Powell’s term officially runs until May 2026, there are growing rumours that Trump could pre-emptively name a successor as early as this September or October.
While the US Supreme Court recently reaffirmed the Fed’s institutional independence, markets are watching closely. An early announcement could significantly undermine Powell’s authority and reorient investor focus toward the likely policy stance of a more politically aligned Fed Chair.
Trump’s agenda hinges on aggressive monetary easing. He argues that a 2–3 percentage point reduction in interest rates could save the US Treasury nearly $900 billion a year in debt servicing. With Treasury Secretary Scott Bessent extending cash management to 24 July to avoid breaching the debt ceiling, the argument is gaining ground. Annual interest payments are on course to exceed $950 billion, a record figure threatening to squeeze discretionary government spending.
Still, Powell remains guarded. In recent testimony, he maintained a data-driven stance, suggesting cuts could come ‘sooner rather than later’ if inflation continues to ease, but reiterating there is ‘no rush’ to act prematurely.
The Fed expects inflation to pick up in the latter half of 2025, partly due to renewed tariffs. Combined with a still-resilient labour market, this has encouraged a cautious tone.
Traders Prepare For A Trim
Markets, however, appear sceptical. According to the CME FedWatch Tool, there’s a 91.5% chance of a cut at the 17 September FOMC meeting, and expectations are building for a second cut before year-end. Although just 19.1% of traders expect action at the 30 July meeting, this divergence between Fed communication and market pricing is widening, driven in part by Trump’s growing influence.
Currency markets have already responded. Bloomberg’s Dollar Index has declined over 8% year-to-date, with losses accelerating as speculation mounts about Powell’s possible replacement. Should Trump appoint a dovish successor, the greenback could face further weakness, especially if economic data starts to falter.
Equities tell a different story. The S&P 500’s climb appears tied more to hopes of looser monetary policy than robust earnings. With M2 money supply inching higher and borrowing costs poised to fall, investors are piling into rate-sensitive assets, anticipating a liquidity-driven rally. Yet this optimism remains speculative and not grounded in confirmed policy moves.
Market Movements This Week
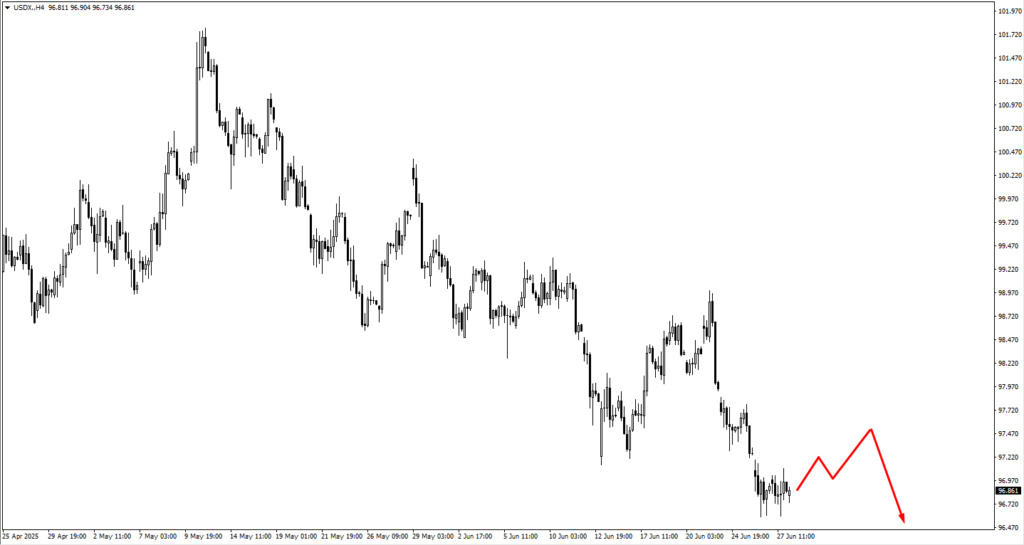
The US Dollar Index (USDX) is testing key support at 96.50. A rebound toward 97.70 could present short-term bearish trade opportunities. However, if the downtrend extends, 95.40 will be the next level to monitor. Political factors are now playing a greater role in the dollar’s direction than inflation data or Fed guidance.
EUR/USD is struggling to break above resistance at 1.1770. A pause or pullback here would be natural, but if price consolidates, the 1.1605 zone becomes critical for bullish continuation patterns. Traders appear hesitant to overcommit, likely waiting for confirmation that the ECB’s easing path is not outpacing the Fed’s.
GBP/USD faced resistance at 1.3790 this week. Price action suggests a potential pullback, and if the pair consolidates downward, 1.3605 could become a viable entry for medium-term bulls. With Bank of England commentary due next week, sterling may remain directionless until fresh forward guidance is provided.
USD/JPY remains mixed. A decline could see buyers re-enter around 143.10, while rallies toward 145.20 or 145.75 may trigger selling. With Japan having initiated its easing cycle earlier than most, the yen is increasingly traded on rate differentials rather than risk sentiment alone.
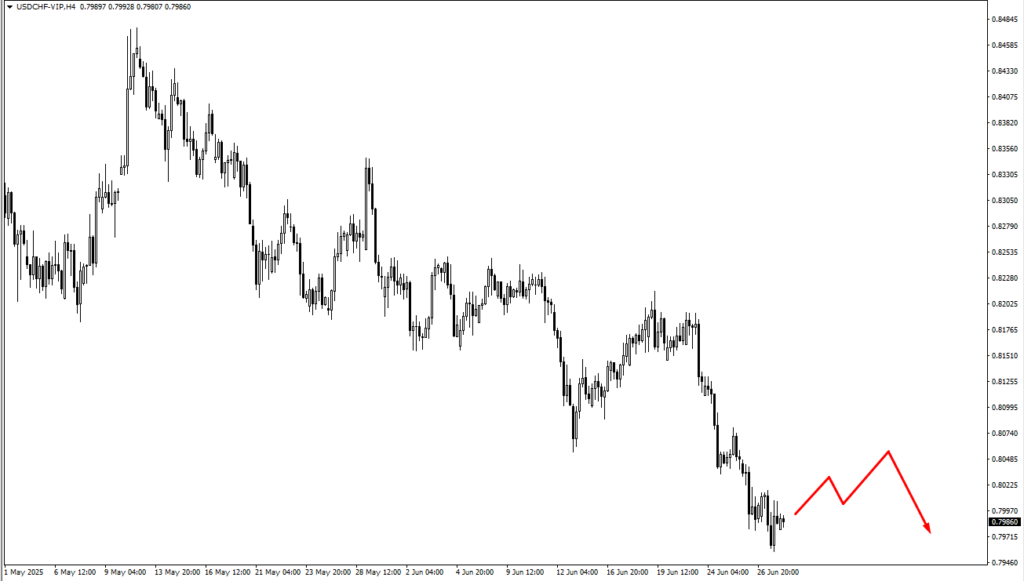
USD/CHF continues to struggle. Any bounce toward 0.8050 or 0.8110 is expected to face renewed selling pressure, assuming the dollar’s weakness and SNB’s slow pace of easing persist.
In the commodity-linked pairs, AUD/USD and NZD/USD are both setting up potential bullish trades if price consolidates near 0.6490 and 0.6455 for AUD, and 0.6005 or even as deep as 0.5730 for NZD. Sentiment remains tied to Chinese demand and broader commodity flows, but the FX reaction is more measured than enthusiastic.
USD/CAD made a run higher, breaching the 1.3754 swing high before pulling back. Sellers remain present but weak. Should price revisit 1.3810 and consolidate, that area may offer a bearish setup, particularly if oil prices stay elevated or Canadian employment data remains firm.
Turning to crude oil, the price has approached the upper range with resistance at 71.80 and 73.40. Consolidation near these levels could attract sellers, but on the downside, 63.35 and 61.00 remain long-term support levels to monitor. Oil has been stuck between fundamental headwinds and seasonal demand optimism.
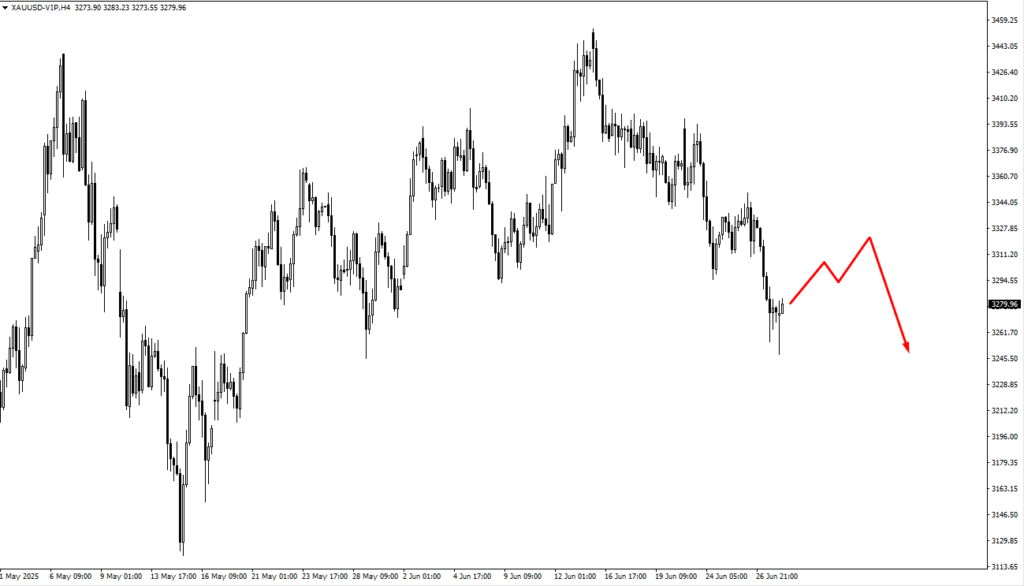
Gold is consolidating near 3,330, with bearish setups possible on a break lower. Support lies around 3,220 or as far as 3,175. Despite dollar softness and rising political uncertainty, gold remains in a holding pattern without a clear trend.
The S&P 500 has pushed higher into overbought territory. Watch 6,200, 6,400, and 6,630 as inflection points. The rally is speculative, driven by rate cut hopes, but extended technicals suggest a pullback may be on the horizon, particularly if labour data surprises to the upside.
Bitcoin broke to a new swing high after consolidating. It now eyes 109,650 as the next key level, with 111,300 seen as the line in the sand for determining further upside. Crypto markets have benefited from the dollar’s softness and broader appetite for decentralised stores of value—but they remain vulnerable to Fed communications that surprise on the hawkish side.
Natural Gas (NG) skipped consolidation entirely and surged toward 3.65. Momentum remains strong. If the rally continues, 3.75 is the next resistance level to watch, with 4.046 being the breakout high that may act as a longer-term barrier.
The Nasdaq is riding the same bullish wave as the S&P, breaking higher and targeting 22,600, then 23,330, with a stretch toward 24,600 if tech continues to lead. While semiconductors and AI-linked stocks are propelling the move, breadth still lags.
Silver dropped from the 36.70 resistance zone and slid below 35.85. A consolidation near 36.45 may offer a bearish continuation setup. The precious metals complex is still in a wait-and-see mode, tracking inflation expectations and real yields.
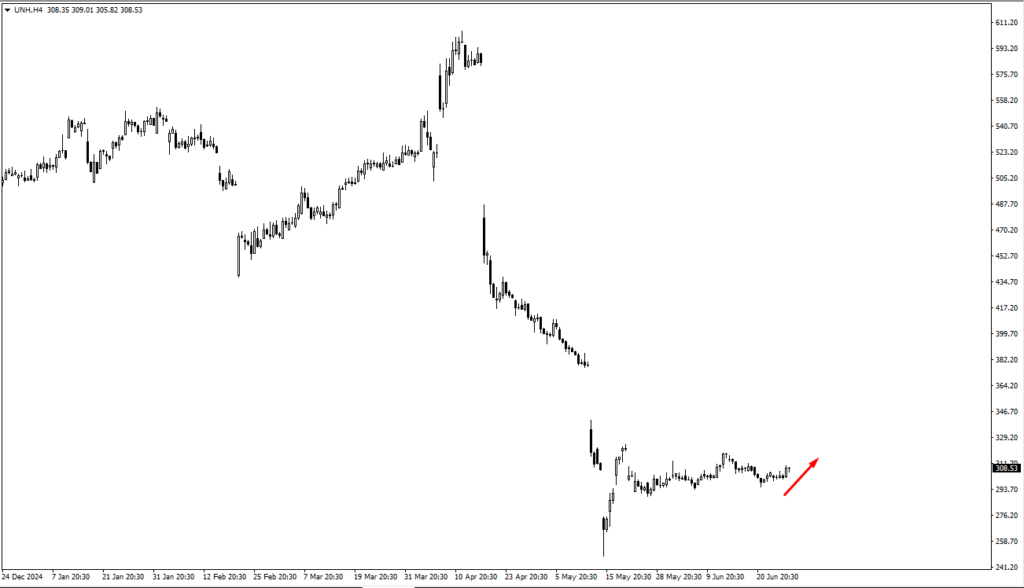
Among individual equities, UnitedHealth (UNH) is trading far below its estimated fair value of $570, currently between $275 and $324. A break above $324.41 could offer technical upside, while long-term investors may find value in phased accumulation.
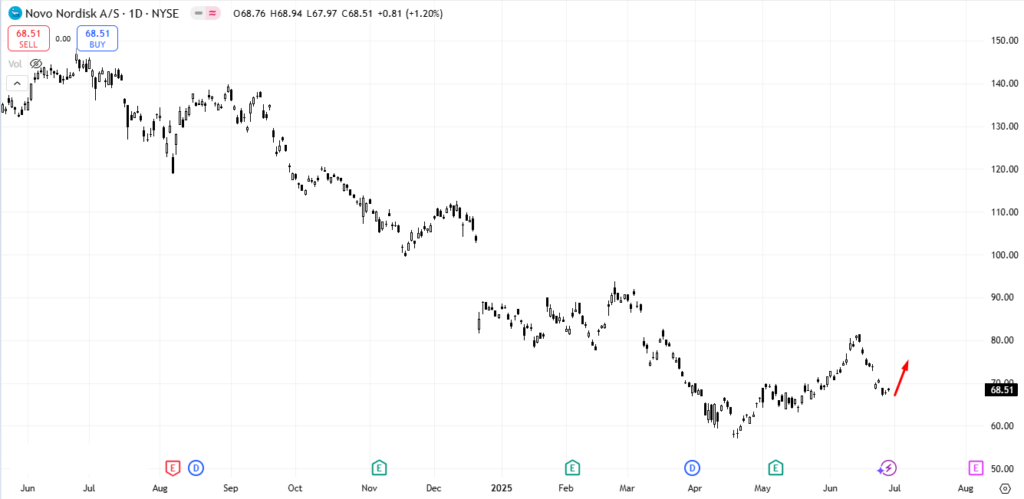
Novo Nordisk (NVO) is trading around 67.80. Like UNH, its market value remains far below its estimated intrinsic value of $150, and long-term investors may look to accumulate gradually at these levels.
Ethereum is also climbing, with $2,580 highlighted as a critical area. A breakout beyond that could trigger the next wave of bullish interest, though like Bitcoin, ETH remains tethered to the broader macro narrative of rate shifts and risk appetite.
Key Events This Week
This week’s calendar offers a tight cluster of high-impact events, concentrated around central bank commentary and labour market data, each carrying the potential to recalibrate expectations around rate cuts, both in the US and abroad.
The action begins Tuesday, 1 July, with Bank of England Governor Andrew Bailey and Bank of Japan Governor Kazuo Ueda both scheduled to speak. With the yen recently under pressure and sterling showing resistance near key levels, traders will be listening closely for any hint of policy recalibration. Ueda’s tone, in particular, will be watched for signs of discomfort with persistent yen weakness—a scenario that could alter near-term FX dynamics in Asia-Pacific pairs.
Later that day, all eyes will turn to Federal Reserve Chair Jerome Powell, whose remarks are expected to reiterate the central bank’s “data-dependent” approach. Market pricing remains heavily tilted toward a September cut, but the tone Powell strikes could widen or narrow that window sharply.
Also on Tuesday, the latest JOLTS job openings report is due. Consensus stands at 7.45 million, up modestly from 7.39 million previously. While hardly a blockbuster release on its own, in the current environment of heightened sensitivity to labour data, a softer reading could reinforce the case for earlier rate relief. Conversely, a surprise beat may embolden Powell’s caution and press pause on the bond market’s easing bias.
Thursday, 4 July, delivers a more concentrated cluster of labour data, including CPI (m/m) for Switzerland, as well as the US unemployment rate and non-farm employment change. Expectations here are subdued: the US unemployment rate is forecast to tick up to 4.3% (from 4.2%), and NFP is expected at 120,000 (down from 139,000). If both figures come in weaker than expected, the July FOMC meeting could return to the spotlight as a live event. But Powell has made it clear that one poor print won’t drive policy.
It would take meaningful, sustained deterioration to warrant a July move, and as such, this week’s data may shape tone more than trigger action.
Dividend Adjustment Notice – Jun 30 ,2025
Dear Client,
Please note that the dividends of the following products will be adjusted accordingly. Index dividends will be executed separately through a balance statement directly to your trading account, and the comment will be in the following format “Div & Product Name & Net Volume”.
Please refer to the table below for more details:
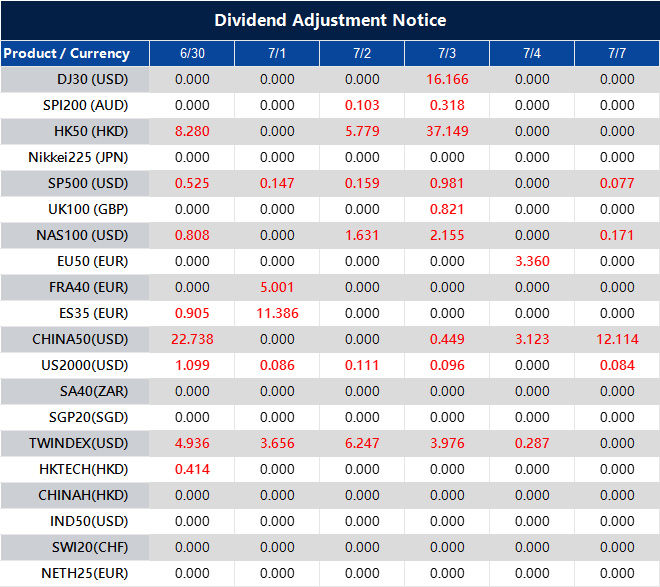
The above data is for reference only, please refer to the MT4/MT5 software for specific data.
If you’d like more information, please don’t hesitate to contact [email protected].
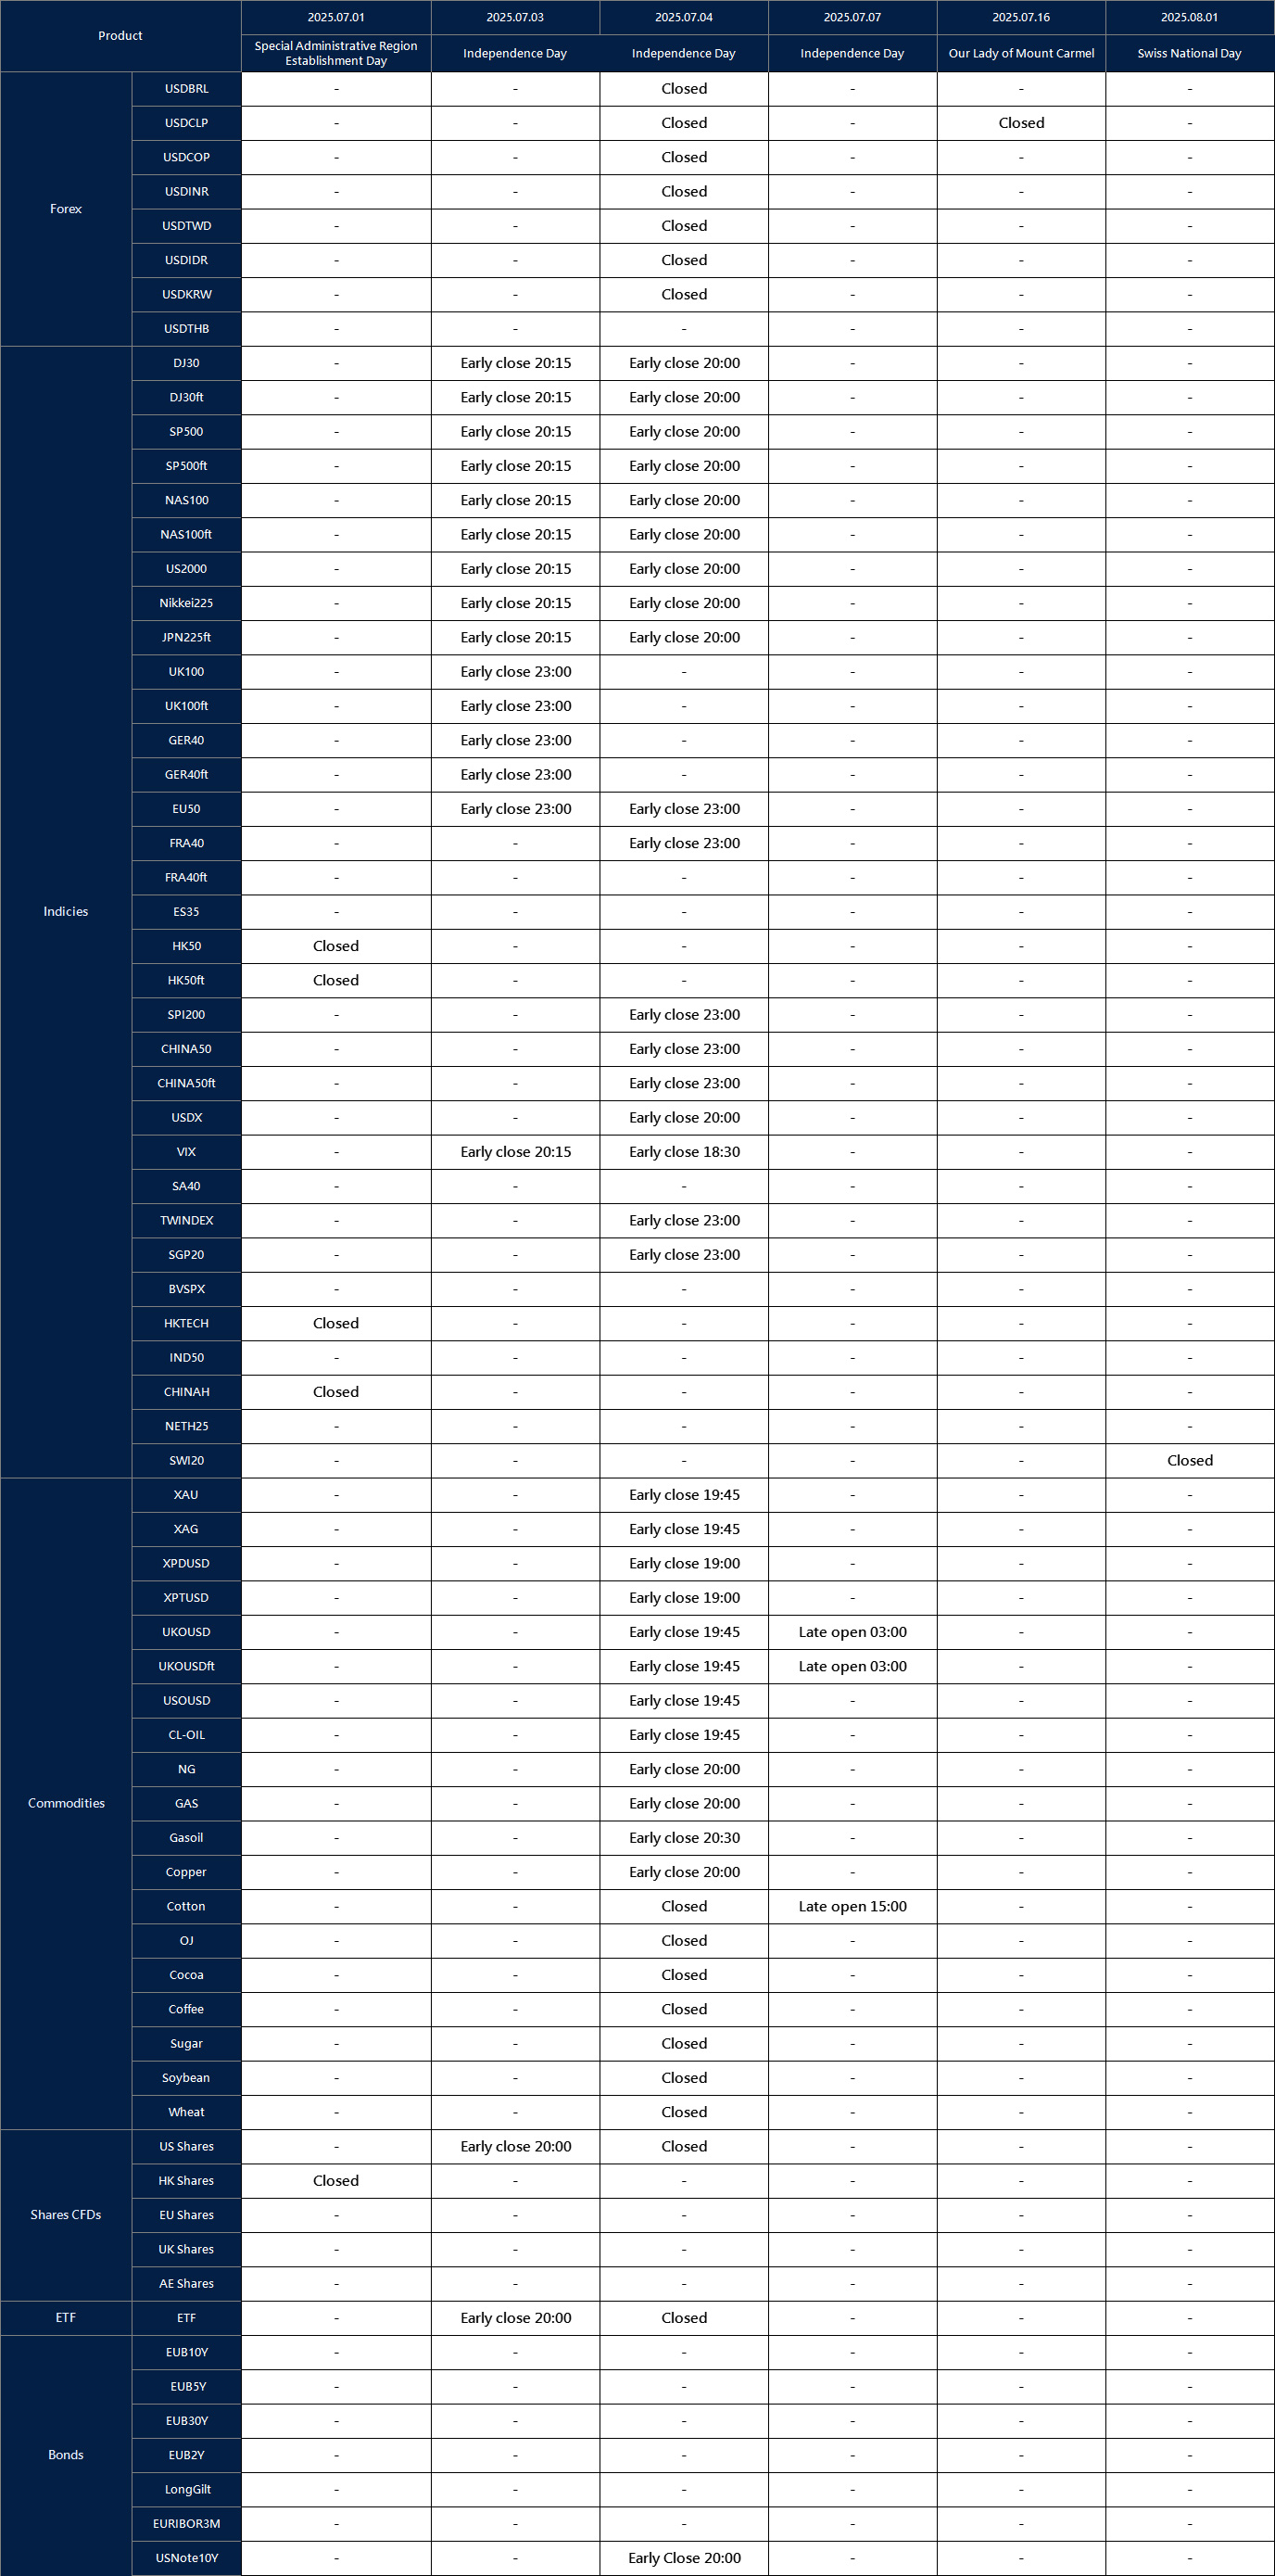
Notification of Trading Adjustment in Holiday – Jun 27 ,2025
Dear Client,
Affected by international holidays, the trading hours of some VT Markets products will be adjusted. Please check the following link for the affected products:
Notification of Trading Adjustment in Holiday
Note: The dash sign (-) indicates normal trading hours.
Friendly Reminder:
The above data is for reference only, please refer to the MT4/MT5 software for specific data.
If you’d like more information, please don’t hesitate to contact [email protected].
Dividend Adjustment Notice – Jun 27 ,2025
Dear Client,
Please note that the dividends of the following products will be adjusted accordingly. Index dividends will be executed separately through a balance statement directly to your trading account, and the comment will be in the following format “Div & Product Name & Net Volume”.
Please refer to the table below for more details:
The above data is for reference only, please refer to the MT4/MT5 software for specific data.
If you’d like more information, please don’t hesitate to contact [email protected].


