BoE cut expectations and a rebounding US dollar keep GBP/USD below 1.3500, near 1.3480, after gains
GBP/USD fell after two days of gains. It traded near 1.3480 during Asian hours on Tuesday as the US Dollar bounced back after two sessions of losses. Later, the focus turns to the US ADP Employment Change four-week average and speeches from Federal Reserve officials.
The Dollar has also been under pressure as foreign investors cut exposure to US assets because of trade uncertainty. The Wall Street Journal reported that the Trump administration is considering new national security tariffs under Section 232 of the Trade Expansion Act of 1962. These would be separate from the 15% global tariff announced on Saturday.
FXStreet data shows Pakistan’s gold prices fell, with the precious metal trading lower overall today
Gold prices in Pakistan fell on Tuesday, according to FXStreet data. Gold traded at PKR 46,414.09 per gram, down from PKR 46,992.65 on Monday.
The price per tola slipped to PKR 541,365.80 from PKR 548,113.10 the day before. Other listed rates were PKR 464,143.10 per 10 grams and PKR 1,443,696.00 per troy ounce.
How FXStreet Calculates Local Gold Prices
FXStreet calculates Pakistan’s gold prices by converting global gold prices into local units using the USD/PKR exchange rate. The figures are updated daily using market rates at the time of publication and are meant as a guide, since local prices can differ. Central banks are the biggest holders of gold. World Gold Council data shows central banks bought 1,136 tonnes of gold worth around $70 billion in 2022, the largest yearly total since records began. Gold often moves in the opposite direction to the US Dollar and US Treasury yields. It can also move against risk assets like stocks. Prices may also shift with interest rates, geopolitical events, and recession fears. Local prices, including in Pakistan, have dipped slightly, which mainly reflects short-term currency moves. Our main focus remains gold’s inverse link with the US Dollar. That relationship is key to where the market may head in the coming weeks.Trading Considerations For The Weeks Ahead
Gold does not pay interest, so it can look more attractive when rates may fall. After steep rate hikes through 2025, US inflation has cooled to 2.8%. Markets are now pricing in a possible rate cut by the third quarter. Lower rate expectations can support gold. Demand for safe-haven assets is also rising as geopolitical tensions pick up again. More naval activity in the South China Sea this month has made some investors more cautious about riskier assets like stocks. When uncertainty increases, money often moves into gold as a store of value. Central banks also continue to support prices through steady buying, a trend that accelerated after the record purchases in 2022. Final reports for 2025 showed emerging economies—especially China and Turkey—added another 950 tonnes to their reserves. This consistent demand can help put a floor under prices and limit the downside for traders. In this setting, it may make sense to use strategies that target upside while controlling risk. Options strategies, such as buying call spreads, can be one way to position for a move in XAU/USD toward the $2,250 level last seen in late 2025. This approach can offer exposure to a potential rally without taking on the full capital requirement of a futures contract. Create your live VT Markets account and start trading now.Dividend Adjustment Notice – Feb 24 ,2026
Dear Client,
Please note that the dividends of the following products will be adjusted accordingly. Index dividends will be executed separately through a balance statement directly to your trading account, and the comment will be in the following format “Div & Product Name & Net Volume”.
Please refer to the table below for more details:
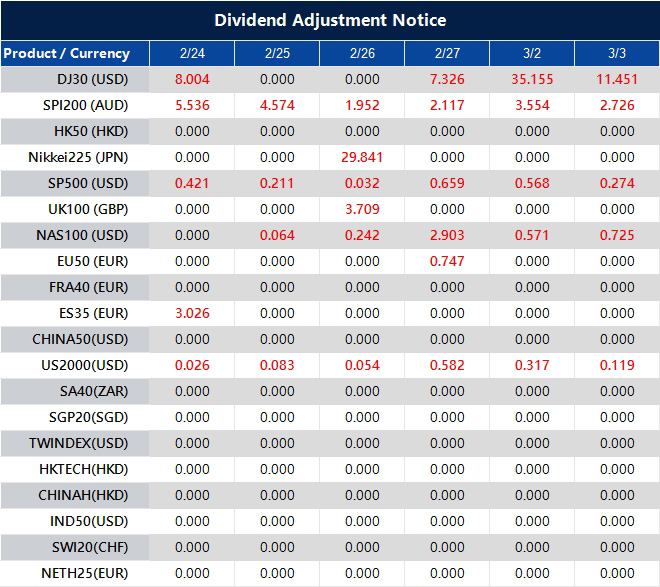
The above data is for reference only, please refer to the MT4/MT5 software for specific data.
If you’d like more information, please don’t hesitate to contact [email protected].
A rare nine-wave triangle may form, with a D-wave rise toward 25,771, echoing nine Navratnas
A video says a rare nine-wave triangle pattern is forming on the Nifty and BankNifty charts. It compares the setup to “9 Navratnas” and describes the move as nine separate waves.
It says the market is now in the c-wave (the current decline) and suggests this phase could trap bearish trades.
Nine Wave Triangle Pattern
The video gives a d-wave bounce target near 25,771. It also marks zones for the d-wave and a final e-wave drop, before a later upside rally. The author is Abhishek H. Singh, described as a financial analyst with more than 10 years of experience and a focus on Elliott Wave Theory. A complex nine-wave pattern is said to be guiding the market. The view is that we are in the final part of a downward c-wave. The recent dip below 24,500 is described as a shakeout of weak holders, happening alongside fresh concerns about service-sector inflation. The claim is that this downside move may be close to running out of steam. Derivative traders are told to get ready for a sharp d-wave rally, with a target near 25,771. Recent FII data is cited, showing net selling fell sharply in the last week of January 2026. This is presented as a sign that FIIs may be positioning for an upswing. The video warns that the bounce could be fast and may catch many bears off guard.Derivative Trading Considerations
With the India VIX still above 15, selling out-of-the-money put spreads is presented as one way to benefit from a potential rebound and a possible drop in volatility. Another approach mentioned is buying at-the-money call options for the March 2026 expiry to play the expected rally more directly. It adds that traders should stay flexible, because the move may be temporary. The video stresses that this rally could be a trap inside a larger consolidation, not the start of a new bull market. It points to a similar “fake” rally in Q4 2025 that quickly reversed, and suggests taking profits near 25,700. The pattern described implies a final e-wave drop after the bounce. After the d-wave rally finishes, traders are told to be ready to flip positions for the final e-wave decline. This last drop is expected to complete the nine-wave triangle. That would set up the next major, longer-lasting trend—but only after one more push lower. Create your live VT Markets account and start trading now.WTI hovered near $67 in Asian trading, rising for a second session amid supply disruption fears
WTI crude rose for a second straight session, trading near $66.80 a barrel during Asian hours on Tuesday. It remained close to a six-month high of $67.23, set on 23 February.
Prices climbed on worries that supplies could be disrupted if tensions in the Middle East escalate. Oman said a third round of talks between Washington and Tehran will take place this week in Geneva.
Middle East Supply Risk
US envoys Steve Witkoff and Jared Kushner are expected to meet an Iranian delegation. US President Donald Trump said on Monday that talks will resume on Thursday. He warned Tehran of a “very bad day” if a nuclear deal is not reached. He also dismissed reports that the Pentagon was worried about the risks of a long military campaign against Iran. Meanwhile, the US Energy Information Administration (EIA) said rising global oil inventories are likely to pressure prices. The EIA expects global production growth to outpace consumption, which would lift stockpiles. It forecasts global inventories will rise by an average of 3.1 million barrels per day in 2026, higher than the build expected in 2025. Traders also weighed fresh trade risks after the administration signalled new national security tariffs on several industries. These would be imposed under Section 232 of the Trade Expansion Act of 1962 and would be separate from the 15% global tariff announced on Saturday.Trading And Volatility Outlook
We expect oil prices to test six-month highs as conflict fears in the Middle East keep a risk premium in the market. The upcoming US-Iran talks in Geneva are the main focus and are driving uncertainty. This points to higher implied volatility. The CBOE Crude Oil Volatility Index (OVX) has recently moved back above 35, a level not seen consistently since late last year. Beyond the near-term headlines, the fundamentals look softer for the rest of the year. The EIA projects a large global inventory build of 3.1 million barrels per day in 2026. That kind of surplus typically weighs on prices. Strong output from US shale also adds to supply, which could limit upside once current tensions fade. Demand risks are also back in focus. New US tariffs could slow economic activity, similar to how trade disputes affected markets in 2025. China’s latest manufacturing PMI slipped to 50.2, showing only mild expansion. Further trade barriers could push down oil demand forecasts in the coming quarters. With mixed signals, some traders may look for ways to benefit from near-term volatility. Buying front-month straddles could profit from a large move in either direction after Iran-related headlines. For a longer-term view, the bearish inventory outlook suggests selling rallies or buying second-quarter put options to position for a potential pullback. Create your live VT Markets account and start trading now.USD/CHF rises towards 0.7760 in Asian trading as investors look past uncertainty over US trade policy
USD/CHF rose to around 0.7760 during Asian trading on Tuesday. The US Dollar extended a rebound late Monday, as traders expected uncertainty after a US Supreme Court decision to be short-lived.
At the time of writing, the US Dollar Index (DXY) was slightly higher near 97.75. On Friday, the Supreme Court ruled that using economic emergency law to justify higher import duties was “unlawful”.
Supreme Court Ruling And Tariff Outlook
President Donald Trump announced 15% tariffs worldwide and warned of higher duties for countries accused of breaking trade agreements. The Swiss Franc held steady as risk-off sentiment stayed strong, driven by uncertainty around US trade policy and US–Iran tensions. Nuclear talks are scheduled to resume on Thursday. The US Dollar is the world’s most traded currency. In 2022, it accounted for more than 88% of global foreign exchange turnover, or about $6.6 trillion per day. It became the main reserve currency after World War II and stopped being backed by gold after the 1971 Bretton Woods changes. Federal Reserve policy influences the Dollar mainly through interest rates, which aim to support stable prices and full employment. The Fed targets 2% inflation. Quantitative easing adds to the money supply and often weakens the Dollar. Quantitative tightening reduces bond buying and usually supports the Dollar. A familiar pattern is emerging: trade policy uncertainty is weighing on the US Dollar, similar to the tariff disputes seen in 2025 and earlier years. This time, however, markets are reacting differently because economic conditions have changed. Attention is now on fresh trade talks with the European Union, and the risk-off mood is proving more persistent.Market Reaction And Rate Expectations
In the past, the Dollar often held up well during trade disputes. Now, the US Dollar Index (DXY) is struggling to stay above 103.00 as investors price in a slowing US economy. Data from late 2025 showed weaker manufacturing PMI and softer retail sales, reinforcing these concerns. As a result, CME Group’s FedWatch Tool now shows nearly a 45% chance that the Federal Reserve will cut rates by the third quarter of 2026. This backdrop is pushing money into classic safe havens, especially the Swiss Franc. USD/CHF has fallen below 0.8800, which is very different from the gains seen in earlier trade clashes. The move is also supported by the Swiss National Bank’s more hawkish tone compared with the Fed, as Switzerland’s latest inflation reading remains above target. For derivatives traders, ongoing uncertainty has boosted implied volatility in FX options in recent weeks. The CBOE Volatility Index (VIX) has also climbed from its 2025 lows and has recently traded above 16, pointing to heavier hedging demand. This raises option premiums, but it can also create opportunities. Given these conditions, buying put options on USD/CHF could offer a direct hedge against further Dollar weakness and Franc strength. Traders may also look at volatility strategies, such as long strangles, to benefit from potential sharp moves as trade headlines continue to drive price action. These strategies can gain from the rising implied volatility now in the market. Create your live VT Markets account and start trading now.Amid US trade uncertainty and US dollar weakness, the New Zealand dollar climbs toward 0.5965 in Asia
NZD/USD rose to around 0.5965 in Tuesday’s Asian session, supported by a weaker US Dollar. Markets are still focused on uncertainty around US trade policy. The US January Producer Price Index (PPI) is due on Friday.
Trade worries grew after the US Supreme Court struck down earlier emergency tariffs. President Trump then proposed a new 15% global tariff under Section 122 of the Trade Act.
Trade Policy Uncertainty Drives Volatility
The Wall Street Journal reported on Monday that the administration is also considering national security tariffs on about six industries. These would be issued under Section 232 of the Trade Expansion Act of 1962. They would be separate from the 15% global levy announced on Saturday. In New Zealand, the Reserve Bank of New Zealand kept the Official Cash Rate unchanged at its February meeting. Governor Anna Breman said policy is still accommodative. The expected timing for the first possible rate hike has been pushed back to late 2026. The RBNZ targets inflation between 1% and 3% over the medium term, with a goal of keeping it near 2%. The NZD is also influenced by China’s economic performance, dairy prices, interest rate gaps versus the US, local data, and changes in overall market risk appetite. For now, the main driver is US dollar weakness. New tariff proposals are adding uncertainty and have pushed NZD/USD toward 0.5965. This keeps the near-term momentum mildly bullish.Options Approaches For The Near Term
However, there appears to be a clear ceiling on strong gains for the Kiwi. With the RBNZ signaling no hikes until late 2026, and with last quarter’s 2025 inflation easing to 2.5%, upside looks limited. One approach could be selling out-of-the-money call options above 0.6050 to collect premium. Attention now turns to Friday’s US PPI report. If inflation comes in hotter than expected, the US dollar could rebound quickly and push the pair lower. Volatility strategies such as straddles may help position for a sharp move in either direction after the release. New Zealand fundamentals also suggest caution. The latest Global Dairy Trade auction showed prices fell 1.2%, extending a softer trend that started in late 2025. That weighs on a major export sector and supports the view that upside in the currency may be limited. We have seen similar conditions before, especially during the 2018 trade dispute period. Back then, headlines triggered fast and hard-to-predict currency swings. That history supports using defined-risk option spreads to manage risk in the weeks ahead. Create your live VT Markets account and start trading now.During Asian trading, EUR/JPY recovered toward 182.60 and held above the nine-day EMA as bullish reversal signals emerged
EUR/JPY cut some of Monday’s losses and traded near 182.60 during Asian hours on Tuesday. On the daily chart, the pair is holding just above the top of a descending channel. The 14-day RSI sits at 46.84.
Price is also just above the nine-day EMA at 182.57. The 50-day EMA at 182.78 is capping any near-term bounce. This points to consolidation, with the risk of continued range trading unless the pair can move back above the 50-day EMA.
Technical Levels And Near Term Bias
A daily close above the 50-day EMA could turn the bias bullish and open the way to the record high of 186.88, set on 23 January. If the pair falls below the nine-day EMA, it could slip back into the channel and move toward roughly 177.30. A further break below the channel would increase downside pressure toward the four-month low at 175.70. This technical analysis was produced with help from an AI tool. EUR/JPY is currently in a tight range around 182.60. It is caught between short-term support at the nine-day average (182.57) and resistance at the 50-day average (182.78). This type of consolidation often comes before a larger move, so volatility could pick up. With direction unclear, a long straddle options strategy may fit. This involves buying a call and a put with the same strike price and the same expiry date. One-month implied volatility for EUR/JPY has risen to 9.8% from 8.5% last month, suggesting the market is already pricing in a breakout. The strategy can profit if the pair makes a strong move in either direction before expiry.Options Strategy And Breakout Triggers
For a bullish setup, the trigger would be a daily close above the 50-day EMA at 182.78. This could be supported by recent eurozone inflation, which came in slightly above expectations at 2.9%, easing pressure on the ECB to cut rates right away. If the break holds, call options with strikes closer to the January high of 186.88 could come into focus. For a bearish setup, a drop below the nine-day EMA at 182.57 would suggest sellers are back in control. In 2025, hints from the Bank of Japan about policy normalization strengthened the yen, and recent CFTC data shows growing speculative long yen positions. A break lower could shift attention to put options targeting the 177.30 channel support. Create your live VT Markets account and start trading now.Japan’s Finance Minister Satsuki Katayama said the government will closely review the details of the US tariff ruling
Japan’s Finance Minister, Satsuki Katayama, said on Tuesday that Japan will closely review the details of a US Supreme Court decision on tariffs. A correction clarified that the comments were made on Tuesday, not Friday.
Katayama said Japan will continue to roll out an investment package aimed at the United States. She also said Japan must stay aware that US tariffs on automobiles are still in place.
Tariff Ruling Raises Uncertainty
She said Japan has been in close talks with the United States, when asked about a Nikkei report on a New York Fed “rate check”. Katayama said she would not comment on rate checks. At the time of reporting, USD/JPY was up 0.14% on the day at 154.90. USD/JPY is facing strong pressure and is trading near 154.90 as officials speak publicly about major trade issues. The Finance Minister’s focus on the US Supreme Court tariff ruling adds a key new source of uncertainty. This backdrop points to a higher chance of a sharp rise in currency volatility in the coming weeks. Her “no comment” on a possible NY Fed rate check is a common signal that officials are uneasy about yen weakness. Similar warnings in late 2022 and again in 2024 came before direct market interventions, when the pair moved above the 150–152 area. Derivative traders may want to consider USD/JPY put options to position for a sudden, intervention-driven drop.Options Volatility Strategies
It is also important to remember that the risk of US auto tariffs remains a serious threat to Japan’s economy. The US is still the main market for Japanese car exports, with more than 1.7 million vehicles in 2025, making it a major source of revenue. This pressure could limit any lasting yen strength. That could make strategies like selling out-of-the-money JPY calls appealing for premium income. With these forces pulling in different directions, implied volatility in USD/JPY options may rise from current levels. One-month volatility has been below 10%, which looks low given the higher risk of policy headlines and possible central bank action. Traders could consider strategies like long straddles, which can profit from a large move in either direction, to take advantage of the growing uncertainty. Create your live VT Markets account and start trading now.China’s central bank set the dollar-yuan midpoint at 6.9414, up from 6.9398 and above Reuters’ 6.9249 estimate
On Tuesday, the People’s Bank of China (PBoC) set the USD/CNY central rate at 6.9414. This compares with the previous fix of 6.9398 on February 13 and a Reuters estimate of 6.9249.
The PBoC’s main policy goals are to keep prices stable, including the exchange rate, and to support economic growth. It also works on financial reforms, such as opening and developing China’s financial markets.


