Trade uncertainty persists, but the US dollar rebounds as market participants closely monitor key developments
The US Dollar steadied on Monday after a weak start, with the USD Index closing almost unchanged. Early Tuesday, it inched up toward 97.90 as markets watched tariff headlines. Later today, traders will focus on the ADP Employment Change 4-week Average and February Consumer Confidence, along with speeches from several Federal Reserve officials.
The Dollar fell after the US Supreme Court ruled against President Donald Trump’s tariffs. It then came under more pressure after global tariffs were raised to 15% from 10%, effective immediately. Later, safe-haven demand linked to US stocks helped support the Dollar. The Wall Street Journal also reported plans for new national security tariffs on about six industries under Section 232 of the Trade Expansion Act of 1962, separate from the 15% levy.
In late Asian trading, USD/JPY rose to around 155.30 as the dollar recovered despite tariff threats
USD/JPY rose 0.4% to around 155.30 in late Asian trading on Tuesday as the US Dollar firmed. The move came as the Dollar recovered, even after US President Donald Trump warned of higher tariffs for countries that do not honour trade agreements.
The US Dollar Index (DXY) was up 0.2% near 97.90, measuring the Dollar against six major currencies. On Monday, Trump warned of steeper tariffs for countries “playing games with existing trade agreements” following a Supreme Court ruling.
Dollar Strength And Yen Weakness
Last week, the Supreme Court ruled against tariffs imposed under the International Emergency Economic Powers Act (IEEPA). Meanwhile, the Japanese Yen lagged. This was despite a Nikkei report that US authorities carried out January “rate checks” to support the Yen. Reuters also reported they were ready for joint intervention if Japan asked for it. On the chart, USD/JPY traded near 155.30 and remained broadly sideways. This fits with a Descending Triangle pattern. Support sits near 152.00, while resistance is around 156.01. The upper boundary is drawn from the 23 January high of 159.66. The 20-day EMA stands at 154.91, and price is still above it. The 14-day RSI remains between 40.00 and 60.00, suggesting a range-bound market. In 2025, USD/JPY tightened into a narrow range, with pressure building around 155. That period included heavy US political headlines and talk of possible Japanese currency intervention. Today, the pair trades much higher near 162.50, showing that broader Dollar strength ultimately prevailed.Policy And Volatility Outlook
Markets are still being driven by central bank policy, though the story is shifting. January US CPI came in at 3.2%, hotter than expected. This keeps pressure on the Federal Reserve to hold rates steady. It also supports the Dollar through higher yields, which helped drive last year’s breakout. The Bank of Japan is also showing early signs of change. At its last meeting, it removed language that committed to further easing. That adds uncertainty, because any move toward tightening would be a major shift for the Yen. In early 2025, the focus was on possible joint intervention. Now, traders are watching for the BoJ to act on its own. With this backdrop, volatility is the key issue for derivatives traders in the weeks ahead. Implied volatility on 3-month USD/JPY options has moved back above 12%. This reflects concern about a sudden policy signal from Tokyo. Last year’s sideways consolidation eventually broke higher, and another sharp move remains possible. Higher volatility also makes outright option buying more expensive, so cost-aware strategies may be more attractive. Bullish traders who expect the US rate advantage to persist may consider call spreads to target a move toward 165, while limiting upfront premium. Traders positioning for a BoJ surprise may prefer put spreads to seek gains from a drop back toward 158. Create your live VT Markets account and start trading now.Data compiled by an external market information provider shows gold prices in Saudi Arabia declined
Gold prices in Saudi Arabia fell on Tuesday, based on FXStreet data. Gold was priced at SAR 622.84 per gram, down from SAR 631.61 on Monday.
The price per tola fell to SAR 7,264.78 from SAR 7,366.99 the day before. Other listed prices were SAR 6,228.49 for 10 grams and SAR 19,374.86 per troy ounce.
How Prices Are Calculated
FXStreet converts global gold prices into Saudi riyals using the USD/SAR exchange rate and local measurement units. Prices are updated daily using market rates at the time of publication. They are for reference only, as local prices may vary slightly. Central banks hold more gold than any other group. They often buy gold to diversify their reserves. According to the World Gold Council, central banks added 1,136 tonnes in 2022, worth about $70 billion. This was the largest annual purchase ever recorded. Gold often moves in the opposite direction of the US Dollar and US Treasury yields. It can also move against risk assets. Gold prices can be influenced by geopolitics, recession fears, interest rates, and the direction of the US Dollar, since gold is priced as XAU/USD. We see today’s small drop as normal market movement, not a shift in the broader trend. For us, the main driver remains the outlook for US interest rates. After the aggressive rate hikes through 2025, rates now appear to have peaked. If policy shifts toward neutral or rate cuts, that would be strongly positive for gold.Implications For Traders
The interest-rate outlook affects the US dollar, which usually moves opposite to gold. After hitting multi-year highs in 2025, the dollar has started to weaken. We expect that trend to continue if the Federal Reserve signals rate cuts later this year. A weaker dollar makes gold cheaper for buyers using other currencies, which typically supports demand. Another key factor is steady, large-scale buying by central banks, which helps support prices. After record buying in prior years, central banks added another 800 tonnes in 2025, according to the World Gold Council. This type of demand can reduce the risk of sharp sell-offs. Gold also remains important as a safe-haven asset and an inflation hedge. Inflation has eased from the highs of 2023 and 2024, but it is still above many central bank targets. For that reason, some investors continue to hold gold to protect purchasing power. Ongoing geopolitical tensions also support holding gold as part of a diversified portfolio. Given these conditions, derivatives traders may want to use recent weakness to build bullish exposure. Buying call options with three-to-six-month expirations offers upside potential with limited risk. Traders with higher risk tolerance could also consider long futures positions on price dips. Create your live VT Markets account and start trading now.FXStreet data shows Philippine gold prices fell today, according to compiled figures
Gold prices in the Philippines fell on Tuesday, according to FXStreet data. Gold was priced at PHP 9,609.71 per gram, down from PHP 9,734.06 on Monday.
The price per tola fell to PHP 112,085.60, from PHP 113,546.00 the day before. Other listed prices were PHP 96,096.86 for 10 grams and PHP 298,860.70 per troy ounce.
Philippine Gold Price Snapshot
FXStreet creates these figures by converting global gold prices into Philippine pesos using the USD/PHP exchange rate and local units. The rates are updated daily at the time of publication and are for reference only. Local prices may vary slightly. Central banks hold more gold than any other group. In 2022, they bought 1,136 tonnes (worth about $70 billion), according to the World Gold Council. That was the largest yearly total since records began. Gold often moves in the opposite direction to the US Dollar and US Treasuries. It can also move differently from risk assets. Key drivers include geopolitical events, recession worries, interest rates, and the US Dollar, since gold is priced in dollars (XAU/USD). Gold has dipped slightly. This looks like normal short-term movement inside a broader uptrend. The pullback comes even as the US Dollar shows signs of weakening, which usually supports precious metals. For derivatives traders, these pullbacks may be chances to enter, not a signal that the trend has changed.Central Bank Policy And Market Strategy
The main driver is still central bank policy, especially from the US Federal Reserve. After several rate cuts through 2025, recent comments point to a pause. Still, markets are pricing in at least one more cut by year-end, helped by easing inflation. January 2026 CPI came in at a moderate 2.8%. Lower interest rates reduce the cost of holding assets that do not pay interest, like gold, which tends to support prices. Strong physical demand from central banks also matters. It has helped put a floor under prices. Central banks added more than 1,000 tonnes to reserves in both 2024 and 2025. The People’s Bank of China was a major buyer for 27 straight months. This steady demand suggests that large price drops could attract strong institutional buying. With that backdrop, selling cash-secured puts below the current market price could be a sensible approach. It lets traders collect premium while choosing a lower possible entry price, using short-term volatility. For traders who remain bullish, call spreads can offer a lower-cost way to target a rebound toward the record highs seen last quarter. Gold’s safe-haven role also remains important. Tensions in several global hotspots continue, keeping uncertainty in stock markets. Gold derivatives, especially long-dated call options, can be a relatively low-cost hedge against a sudden risk-off move, like the one that shook markets in fall 2025. Create your live VT Markets account and start trading now.FXStreet-compiled figures show that gold prices in the United Arab Emirates fell today, reflecting a broader market decline.
Gold prices in the United Arab Emirates fell on Tuesday, based on data compiled by FXStreet. Gold was priced at AED 610.72 per gram, down from AED 618.38 on Monday.
The price per tola fell to AED 7,123.30, from AED 7,212.61 the day before. Other listed prices were AED 6,107.17 for 10 grams and AED 18,995.60 per troy ounce.
How FXStreet Calculates UAE Gold Prices
FXStreet calculates UAE gold prices by converting global prices into AED using the USD/AED exchange rate and local units. The numbers are updated daily at the time of publication and are meant as a guide. Local prices may vary slightly. Gold is widely used to store value and to make jewellery. Many also use it to hedge against inflation and a weaker currency. Central banks are the biggest holders. In 2022, they added 1,136 tonnes—worth about $70 billion—to their reserves, the highest yearly total on record. Gold often moves in the opposite direction to the US Dollar and US Treasuries. It can also move differently from risk assets like stocks. Prices can change with geopolitical events, recession worries, interest rates, and shifts in the US Dollar, since gold is priced in dollars (XAU/USD). This small drop in gold is likely a normal daily move when set against bigger market trends. The inverse link with the US Dollar is a major factor. Even a brief rise in the dollar can cause small pullbacks like this. Derivatives traders may want to ignore day-to-day noise and focus on the main drivers for the months ahead.Key Signals Traders Are Watching
We are watching the US Federal Reserve for signs of interest rate cuts later this year. Gold does not pay interest, so it tends to look more attractive when rates fall. We saw this during similar shifts in 2024. If rate cuts become more likely, gold could get a strong boost, and current levels may appeal to bullish traders. Central bank buying also continues to support the market. Reports show strong net purchases through the end of 2025, especially from emerging economies. The World Gold Council said this was a major trend last year, with more than 800 tonnes added in the first three quarters alone. This steady demand suggests big players see long-term value and may use price dips to add to reserves. Geopolitical uncertainty remains another key support. Gold’s safe-haven role matters most when markets turn volatile. While stocks have been strong, a pullback or a rise in global tensions could push investors toward safety and lift gold. This pattern appeared many times during smaller conflicts and economic scares in 2025. Because of this, some traders may see the recent softness as a chance to position for a rebound. Options strategies that benefit from a rise over the next few months—such as buying call options or using bull call spreads—may be worth considering. The key is to watch for a weaker US Dollar and clearer signs that central banks are turning more dovish. Create your live VT Markets account and start trading now.After retreating from 1.1835, EUR/USD slips toward 1.1775 amid modest dollar strength in Asia
EUR/USD extended its decline in the Asian session on Tuesday after retreating from the 1.1835 area. The pair traded around 1.1775–1.1770, down nearly 0.15%, as the US dollar strengthened slightly.
Traders are watching for a clear break below the 61.7% Fibonacci retracement level, following the recent bounce from the 200-day simple moving average (SMA) support that was tested in January. A move below last week’s low at 1.1745–1.1740 could deepen the pullback from around 1.2100, the highest level since June 2021, set last month.
Technical Indicators Signal Mild Bearish Momentum
The MACD histogram has moved further into negative territory. The MACD line remains below the signal line and is hovering near zero. The RSI is at 46, below the 50 midpoint, which suggests mild bearish momentum without signaling oversold conditions. The next support on the downside is near the 78.6% retracement level around 1.1695. The 200-day SMA is rising slightly and stands at 1.1658, and the pair is still trading above it. Part of this technical analysis was produced with the help of an AI tool. We saw similar bearish pressure build on EUR/USD in 2025, when the pair traded near 1.1775. At that time, the negative MACD and an RSI below 50 correctly pointed to weakening momentum. The pullback later continued and broke below key moving-average supports we were tracking throughout the year.Current Macro Backdrop Favors The Dollar
The situation has changed, with EUR/USD now trading much lower near 1.0750 as the US dollar stays strong. A key driver is the interest-rate gap: the US Federal Reserve’s policy rate is 4.75% while the European Central Bank’s is 3.5%. That 1.25 percentage point difference continues to favor US dollar assets. Given this backdrop, derivatives traders may consider buying EUR/USD put options to position for more downside in the coming weeks. Recent data showing Eurozone inflation easing to 2.8% gives the ECB less pressure to stay aggressive, which could weigh on the euro. Puts with a strike near 1.0650 offer a defined-risk way to target the lows from late last year. That said, volatility could rise around the upcoming US non-farm payrolls release. A weaker-than-expected jobs report could temporarily weaken the dollar and spark a short-term bounce in EUR/USD. To hedge that risk at a low cost, traders could consider out-of-the-money call options with a strike above 1.0900. Create your live VT Markets account and start trading now.BoE cut expectations and a rebounding US dollar keep GBP/USD below 1.3500, near 1.3480, after gains
GBP/USD fell after two days of gains. It traded near 1.3480 during Asian hours on Tuesday as the US Dollar bounced back after two sessions of losses. Later, the focus turns to the US ADP Employment Change four-week average and speeches from Federal Reserve officials.
The Dollar has also been under pressure as foreign investors cut exposure to US assets because of trade uncertainty. The Wall Street Journal reported that the Trump administration is considering new national security tariffs under Section 232 of the Trade Expansion Act of 1962. These would be separate from the 15% global tariff announced on Saturday.
Market Drivers And Policy Signals
Fed official Christopher Waller said support for a March rate cut depends on February labour data. Swaps now price a 5% chance of a 25-basis-point cut in March and about 50 bps of easing in 2026. Sterling stayed soft as markets expect the Bank of England may start cutting rates as early as March. This view is tied to weaker labour conditions and easing inflation. MPC member Alan Taylor said inflation should return to the 2% target and supported more near-term cuts. The pound dates back to 886 AD and is the UK’s currency. It is the fourth most traded currency, making up 12% of FX (about $630 billion a day in 2022). Key pairs include GBP/USD (11%), GBP/JPY (3%), and EUR/GBP (2%). With the Bank of England hinting at a March cut, the policy gap between the UK and the US is widening. UK data show inflation fell to 2.3% in January and Q4 2025 GDP grew just 0.1%. This supports our view that the BoE will move sooner than the Fed. This backdrop suggests GBP/USD may have more downside in the weeks ahead.Trade Ideas And Key Risks
Based on this view, we see value in strategies that benefit if the pound falls. Buying GBP/USD put options expiring in April could capture a move after the March central bank meetings. If you are less bearish, a put spread—such as buying a 1.34 put and selling a 1.32 put—can lower the cost while positioning for a steady decline. The main risk to this bearish view is uncertainty around US trade policy, which could weaken the dollar unexpectedly. This risk shows up in implied volatility, which has risen to about 8.5% for three-month options. The higher premium can make selling volatility attractive, but it requires strict risk control because tariff headlines can shift quickly. This setup looks different from late 2025, when optimism about a stronger UK recovery kept the pair supported above 1.3600. Now the Fed remains data-dependent after a strong January jobs report that added 225,000 roles, and GBP/USD (Cable) looks biased lower. The key event is February US labour data, which will strongly shape the Fed’s March decision. Traders should be ready for further weakness below 1.3500. In this environment, using options to cap risk is the safer approach. Any bounce back toward 1.3500 may offer a chance to add fresh bearish positions, targeting the 1.3350 support area. Create your live VT Markets account and start trading now.FXStreet data shows Pakistan’s gold prices fell, with the precious metal trading lower overall today
Gold prices in Pakistan fell on Tuesday, according to FXStreet data. Gold traded at PKR 46,414.09 per gram, down from PKR 46,992.65 on Monday.
The price per tola slipped to PKR 541,365.80 from PKR 548,113.10 the day before. Other listed rates were PKR 464,143.10 per 10 grams and PKR 1,443,696.00 per troy ounce.
How FXStreet Calculates Local Gold Prices
FXStreet calculates Pakistan’s gold prices by converting global gold prices into local units using the USD/PKR exchange rate. The figures are updated daily using market rates at the time of publication and are meant as a guide, since local prices can differ. Central banks are the biggest holders of gold. World Gold Council data shows central banks bought 1,136 tonnes of gold worth around $70 billion in 2022, the largest yearly total since records began. Gold often moves in the opposite direction to the US Dollar and US Treasury yields. It can also move against risk assets like stocks. Prices may also shift with interest rates, geopolitical events, and recession fears. Local prices, including in Pakistan, have dipped slightly, which mainly reflects short-term currency moves. Our main focus remains gold’s inverse link with the US Dollar. That relationship is key to where the market may head in the coming weeks.Trading Considerations For The Weeks Ahead
Gold does not pay interest, so it can look more attractive when rates may fall. After steep rate hikes through 2025, US inflation has cooled to 2.8%. Markets are now pricing in a possible rate cut by the third quarter. Lower rate expectations can support gold. Demand for safe-haven assets is also rising as geopolitical tensions pick up again. More naval activity in the South China Sea this month has made some investors more cautious about riskier assets like stocks. When uncertainty increases, money often moves into gold as a store of value. Central banks also continue to support prices through steady buying, a trend that accelerated after the record purchases in 2022. Final reports for 2025 showed emerging economies—especially China and Turkey—added another 950 tonnes to their reserves. This consistent demand can help put a floor under prices and limit the downside for traders. In this setting, it may make sense to use strategies that target upside while controlling risk. Options strategies, such as buying call spreads, can be one way to position for a move in XAU/USD toward the $2,250 level last seen in late 2025. This approach can offer exposure to a potential rally without taking on the full capital requirement of a futures contract. Create your live VT Markets account and start trading now.Dividend Adjustment Notice – Feb 24 ,2026
Dear Client,
Please note that the dividends of the following products will be adjusted accordingly. Index dividends will be executed separately through a balance statement directly to your trading account, and the comment will be in the following format “Div & Product Name & Net Volume”.
Please refer to the table below for more details:
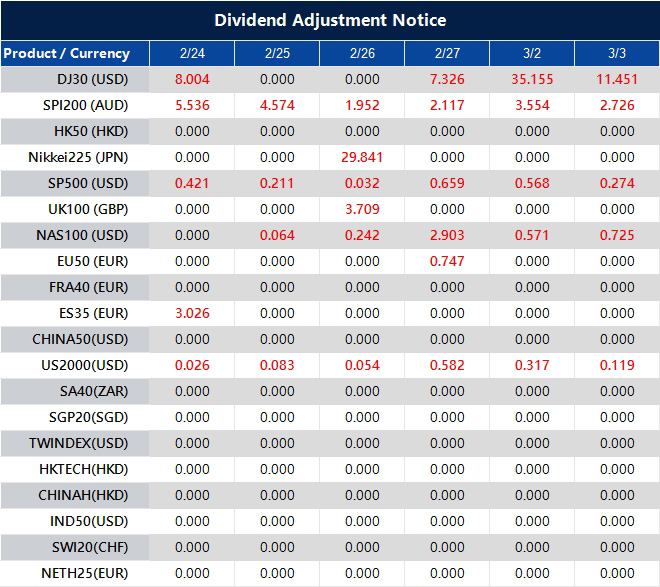
The above data is for reference only, please refer to the MT4/MT5 software for specific data.
If you’d like more information, please don’t hesitate to contact [email protected].
A rare nine-wave triangle may form, with a D-wave rise toward 25,771, echoing nine Navratnas
A video says a rare nine-wave triangle pattern is forming on the Nifty and BankNifty charts. It compares the setup to “9 Navratnas” and describes the move as nine separate waves.
It says the market is now in the c-wave (the current decline) and suggests this phase could trap bearish trades.


