Italian consumer price index for May was 1.7%, below the expected 1.9%
China’s NPC Standing Committee meeting will focus on anti-competition laws and international issues.
Bundesbank President addresses ECB in Frankfurt, says a pause or cut isn’t sensible
Understanding The ECB’s Role
The European Central Bank (ECB) is based in Frankfurt and manages monetary policy for the Eurozone. Its primary goal is to maintain price stability, aiming for inflation of around 2% by adjusting interest rates. High rates usually strengthen the Euro, while low rates weaken it. In tough financial times, the ECB uses Quantitative Easing (QE) to pump money into the economy by buying assets, which can lead to a weaker Euro. Conversely, during recovery, Quantitative Tightening (QT) involves halting asset purchases, typically strengthening the Euro. Nagel’s statements indicate that while current figures show success, there’s no immediate shift in monetary policy. Policymakers are cautious about locking themselves into fixed plans. Although inflation has decreased, it hasn’t done so uniformly across the Eurozone, with some areas still showing weak indicators. Thus, it’s risky to talk about ending or reversing policy too soon. For now, the ECB keeps its options open. Leaders like Nagel are advocating patience. With inflation near the 2% target, there’s a temptation for market analysts to suggest easing up. However, the cautious approach indicates that changes won’t happen quickly. We see the Euro gaining against the Dollar, largely influenced by shifts in investor sentiment and a weaker Dollar, rather than just demand for the Euro. This reaction in the derivatives market isn’t surprising. Traders are adjusting their positions, expecting a different trajectory for the Fed and the ECB in the near future. This divergence will rely more on incoming data than on policy announcements.Navigating Future Challenges
The need for flexibility is genuine. Rate adjustments may be necessary in either direction. For policymakers to react effectively, they need clear signals, rather than just noise from monthly reports. At the same time, pricing is sensitive to comments from policymakers; any suggestion of dovish or hawkish trends can impact yields, currencies, and futures. As we approach upcoming meetings, we might see significant changes in the implied volatility of rate futures and options. Directional bets are fragile when confidence hinges on unpredictable external factors—like commodity prices, geopolitical tensions, and uneven recoveries in the service sector across member states. With QT continuing, it signifies a gradual withdrawal from pandemic-era support. This also technically supports the Euro by trimming excessive supply from the market. However, this process is slow and methodical, similar to how the stimulus measures were rolled out in 2020. The ECB values credibility, particularly during a recovery that isn’t consistent across the board. Economic indicators are mixed—some countries show low unemployment, while others are still struggling. This situation turns the process into a waiting game rather than a guessing game for the central bank. In such scenarios, those trading derivatives are already adjusting their strategies. We are monitoring hedging ratios and the sensitivity of short-dated contracts. Any current overexposure could lead to challenges due to policy inertia. Delta positioning must be attuned to this immediate risk. It is likely that volatility will rise again as traders adjust for the later quarters. In simpler terms, options are narrowing, even though the outlook seems complete at first glance. Create your live VT Markets account and start trading now.Futures suggest buyer dominance, indicating institutional accumulation and a potential market recovery.
Buyer Dominance in Early Trading
Today’s early futures trading highlights buyer strength with little selling pressure and low volume, suggesting that institutions are methodically accumulating. This follows Friday’s sell-off, with buyers stepping in during price dips and absorbing liquidity at lower levels. The price increase happened without significant intraday pullbacks, indicating intentional accumulation. For traders, today’s performance suggests market stabilization and potential buying opportunities on minor dips. Long-term investors might question if recent macro concerns are overblown. The current behaviour in the futures market shows a shift from reactive selling to quiet accumulation. If this trend continues, we may see a broader recovery as the U.S. session begins. What we observe is a consistent reaction to Friday’s drop, with buyers cautiously but clearly re-entering the market. The lack of strong selling pressure and low volume during upward moves indicate that buying is not driven by speculation. Instead, it seems to be driven by institutions—carefully and deliberately focused on value. Such buying habits help strengthen price levels. Futures remaining stable without intense selling or sudden drops suggest that sellers are losing their energy. This often signals a phase where value-seekers quietly enter the market—not forcefully, but patiently, allowing prices to rise gradually as supply is absorbed. In this situation, it’s the base being formed, not the speed of the rise, that matters.Liquidity and Buyer Dynamics
Examining the order flow reveals that liquidity is building beneath active prices, especially after minor dips. This indicates that buyers are not just present; they are committed to defending their positions. When this commitment appears after a sell-off, prices usually stabilize instead of dropping quickly. This points to a week where strength during light pullbacks may continue to attract attention. However, reactions around key levels must be assessed in real-time. No price movement should be accepted at face value. We need to examine the depth—who is entering the bid, how substantial they are, and if they re-enter after being tested. When buyers maintain their positions even after reduced activity, it conveys more than a fleeting spike. While sentiment seems positive, we cannot ignore global challenges. Instead, we adapt to how the market is reacting—calmly rather than impulsively. When prices stabilize amid uncertain headlines, we consider whether the worst has already been factored in. This reflection guides future strategies. There’s also an advantage in observing how passive flows behave around VWAP and session ranges. If institutions continue to accumulate near these points, it usually signals a purpose. With purpose, opportunities become clearer. However, each scenario requires a plan—entry points need triggers, and stop-losses must fit within the order book context. From our perspective, we proceed with careful observation rather than blind optimism. If shallow dips keep attracting steady buyers, it may indicate positioning for further upward movement. However, if rising prices encounter ongoing selling pressure, it’s time to reevaluate. For now, the responsibility lies with sellers to make their presence known—and they have mostly stayed quiet. Create your live VT Markets account and start trading now.Stock markets remained stable after attacks in the Middle East, despite early fluctuations in Emini S&P.
Emini Dow Jones June Overview
In June, the Emini Dow Jones dropped to 41920 but quickly bounced back, with the day’s low just 50 ticks below the buying zone at 42350/250. The session included trades at resistance levels, and further declines may target 41650 or even 41350/300. In the forex market, the EUR/USD climbed towards 1.1600 as the US Dollar weakened. Similarly, the GBP/USD approached 1.3600. Gold remained stable above $3,400, even though it has lost some of its appeal as a safe-haven asset. Chinese economic data suggests that the country may meet its growth target for the first half of 2025, despite mixed signals from fixed-asset investment and property prices. As mid-June approached, indices remained constrained within narrow ranges. The S&P contract showed strength overnight, breaking above resistance levels at 5995/6005. However, the overall trend lacks clarity. This month, the price action has been confined to a narrow band of about 160 points, which can lead to complacency or false breakouts. Caution is advised around these upper levels, as movement can be indecisive without new drivers. Traders should refrain from overextending positions unless there is consistent upward momentum. On the other hand, the Nasdaq has displayed more reliable trends. It sharply rebounded after nearly touching the 21440/400 band, a previous support area. Recently, it has approached 21900, which now acts as a crucial barrier before any potential movements towards 21970/990. These developments could be fleeting without broad tech participation. The trading range of roughly 900 points has persisted for weeks, so any future breakout will require volume to sustain momentum; otherwise, it may fall back into a retracement trap. Observing the coming sessions above 21900 will help clarify if the bulls are in control.Forex And Commodity Markets
The Dow contract exhibited more volatility, dropping to 41920 before reversing, which aligns with our expectations for buyer interest. The upward bounce confirms that lower support zones like 42350/250 are attracting attention. However, sellers remain vigilant around resistance points, often with precision. While the bounce was orderly, a failure to surpass recent highs may pressure prices back towards lower limits. Should weakness return, 41650 may be achievable, with 41350/300 also on the radar if current strength diminishes. Recent down moves have started to accelerate once buying interest fades. In the currency market, the Euro is steadily moving toward 1.1600, supported by a recent dip in the US Dollar. There has been a subtle shift in tone from the US Federal Reserve that has unsettled dollar bulls, allowing the sterling to edge closer to 1.3600. These are not large jumps, but enough to keep traders alert for potential upward movement. Differing bank policies are likely to resurface soon, making each data release carry extra weight. Gold remains just above $3,400, showing a lack of clear direction lately. Its diminished demand as a safe-haven asset hasn’t triggered a mass sell-off, but new buying interest is also scarce. Currently, gold seems stable, though its balance is fragile. Traders looking to gold for market sentiment might find it less helpful at this time, as the market appears hesitant to make a commitment. Recent Chinese growth data has brought just enough optimism to counter previous concerns. Despite some apprehensions about fixed-asset investments and property data, the overall economic growth trajectory looks aligned with medium-term goals. This offers some stability for risk-sensitive sectors, but caution remains due to inconsistencies in the data. In the upcoming sessions, it will be crucial to monitor volume changes near the Nasdaq’s 21900, the Dow’s mid-42000s, and the S&P’s 6005 area. Equities seem to be in a state of waiting, with underlying momentum building, but not yet realized. We will continue to evaluate whether this price trend signifies accumulation or distribution, as timing is just as important as price levels when ranges tighten and pressure increases. Create your live VT Markets account and start trading now.Traders should remember that US equity index futures rollover happens the Monday before the expiration date.
US Dollar Index remains stable around 98.15 amid rising geopolitical tensions in the Middle East
Consumer Sentiment Improves
Consumer sentiment in the US improved for the first time in six months in June. The University of Michigan’s Index rose to 60.5, exceeding forecasts of 53.5, which may temporarily support the US Dollar. The conflict between Israel and Iran has been ongoing for four days, marked by missile launches from both sides. Increased geopolitical tensions may lead to more safe-haven flows, benefiting the USD. The US Dollar makes up over 88% of global foreign exchange turnover and became the world’s reserve currency after World War II. The Federal Reserve’s monetary policy has a major influence on the dollar’s value. Tools like quantitative easing (QE) and quantitative tightening (QT) affect the flow of credit and the dollar’s strength. Economic indicators and geopolitical risks continue to impact the USD’s direction.Impact of Federal Reserve Policy
The Dollar Index holding around 98.15 is not surprising, given the current economic and political uncertainties. Markets are currently calm, but this “waiting period” is likely before a series of important releases and clarifications from policymakers. The level of 98.15 suggests hesitation among traders, who are holding off on major moves until more guidance from the Fed is provided. With inflation trends appearing softer, many are now expecting two rate cuts, one in September and another in October. Current market expectations indicate that this is becoming the primary scenario, not just a possibility. Whether this is seen as too aggressive or reasonable may depend less on the Consumer Price Index and more on how the Fed discusses overall economic health. If Jerome Powell expresses caution or suggests that disinflation is not secure, expectations may adjust rapidly. We will keep a close watch on the press conference for its tone rather than just the numbers. The encouraging consumer sentiment data, breaking a six-month trend of decline, is significant. It indicates that households may feel more confident, possibly due to stabilizing prices or labor market support. The University of Michigan Index exceeding 60 is much higher than the predicted 53.5, giving the Fed room to delay rate cuts if they decide to. However, this could also create pressure on expectations for rate-sensitive assets. At the same time, the ongoing situation in the Middle East is influencing the market more than domestic data. Currency flows show heightened risk aversion, which generally supports the dollar, especially in short-term futures. The likelihood of further escalation and how long the current tensions last will likely keep demand strong for liquid and reliable assets. We’ve seen this pattern before when conflicts escalate without resolution. When considering the long-term direction of the dollar, all roads lead back to Fed policy. The USD is involved in over 88% of global currency turnover, making it very sensitive to changes in policy communication. We expect a closer relationship between real yields and the index in the coming weeks, particularly if volatility returns to the rate markets. Traders heavily involved in short-term derivatives will need to guard against sharp price changes, especially after Fed updates. Also, keep in mind that broader actions—like balance sheet changes—are crucial. QT and its opposite, QE, significantly affect dollar liquidity. Currently, the environment leans neutral to slightly restrictive, which may help limit excessive dollar weakness if risk-off trends continue. Every piece of data, from jobs to manufacturing, is more important than ever. As we approach Wednesday, traders will have a short window to reassess the current rate path and the Fed’s guidance. Stay flexible with your positions, avoiding hasty conclusions based on individual data points or movements driven solely by geopolitical events. There is not yet a clear consensus, and misinterpretations could lead to swift reversals, especially in leveraged trades. Create your live VT Markets account and start trading now.Tensions rise between Israel and Iran as China’s property sector struggles despite growth in retail sales
Week Ahead: The Quiet Rise of Liquidity

At first glance, soaring stock markets would suggest robust economic fundamentals. Yet in 2025, this perception doesn’t hold. The primary driver behind current market performance isn’t productivity or profitability. It’s policy. And that should prompt some reflection among traders and investors.
Sentiment appears euphoric. Bitcoin has rallied sharply, and gold is reinforcing its reputation as a safe-haven asset. But when one considers the broader macro landscape, it feels suspiciously optimistic. This isn’t a rally born of corporate earnings or broad-based confidence.
Liquidity At The Core
Since 2020, the US money supply has expanded dramatically. M2, which includes cash, current and savings accounts, and money market funds, has reached unprecedented levels. This didn’t unfold organically.
The Federal Reserve injected trillions into the system via aggressive quantitative easing and ultra-low interest rates in response to the COVID-19 crisis. While this stabilised markets in the short term, it also unleashed an era of abundant, low-cost capital.
In such an environment, cash doesn’t sit idle. With interest rates near zero, investors pivot away from deposits and bonds, channelling funds into equities, property, gold, and increasingly, cryptocurrencies. This capital inflow into a finite pool of assets naturally drives prices higher.
A Familiar Playbook
This pattern isn’t unfamiliar. Following the 2008 financial crisis, central banks embarked on a similar path, fuelling one of the longest bull markets in history. What we’re witnessing now is a magnified version. The scale and pace of post-2020 monetary expansion dwarfs anything previously seen, boosting blue-chip stocks and speculative and defensive assets.
Crucially, much of this new liquidity bypasses consumer spending, funnelling straight into financial markets. That’s why we’re seeing record-breaking asset prices while other economic indicators falter. Corporate earnings remain underwhelming, and labour market data sends mixed signals. Yet markets continue climbing, driven by liquidity rather than fundamentals.
The Fed hasn’t relied solely on printing money. Measures such as adjustments to the Supplementary Leverage Ratio have enabled banks to lend more and hold additional government debt. While these tools support markets during periods of instability, they also highlight the extent to which central banks are willing to intervene.
The Risk Of Dependency
Such interventions are not without consequences. If a vulnerable sector, say, commercial property or a regional banking group, begins to unravel, the likely response will be even more stimulus.
History provides a cautionary tale. In the 1970s, prolonged monetary easing and fiscal deficits triggered runaway inflation. Gold soared from $35 to $850 an ounce by 1980. To rein it in, the Fed hiked interest rates above 15%, plunging the economy into a harsh recession. That era stands as a stark reminder of the limitations of endless liquidity.
Navigating The Terrain
For those still holding equities, a more selective approach is warranted. Sectors with strong pricing power often weather inflationary pressures better. Energy, industrials, and defence may prove more resilient than technology or high-growth names. Defensive sectors such as healthcare and consumer staples are also worth watching as volatility picks up.
Holding cash, particularly in US dollars, is no longer the safe option it once was. Despite its reserve currency status, the dollar is facing long-term structural headwinds. Large fiscal deficits, declining demand for US debt, and efforts by other nations to diversify their reserves are eroding its appeal.
Seeking Shelter
Overexposure to cash during aggressive monetary expansion risks silent, gradual capital erosion. For those aiming to preserve long-term value, alternative stores of wealth deserve consideration.
Precious metals such as gold and silver historically retain their value during currency debasement. Inflation-linked bonds (TIPS) provide protection by adjusting returns in line with inflation. Commodities, especially in agriculture and energy, often appreciate when the dollar weakens. Currencies like the Swiss franc, Singapore dollar, or Norwegian krone also offer diversification benefits.
For those more tolerant of volatility, digital assets remain a growing component of the hedging strategy. Bitcoin, despite its fluctuations, continues to attract both institutional and long-term investors.
At the heart of this momentum is liquidity. It’s lifting asset prices even as economic signals remain murky. But this is not a rally grounded in strength. It is one levitating on the back of cheap capital. When the tide turns, the descent could be swift.
Market participants would be wise to monitor the conditions underpinning this surge. When those conditions shift, having a well-thought-out strategy will matter more than ever.
Market Movements This Week
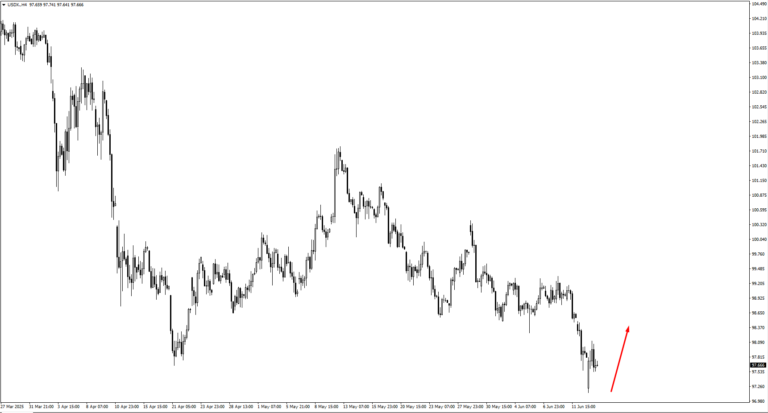
US Dollar Index (USDX) is testing resistance at the 97.90 mark after climbing from 97.139. This zone has previously halted advances, and a break above it could see the index targeting 98.30. On the downside, 96.40 remains a key support for bullish confirmation if momentum fades. With the Fed’s next move pending, expect reactive trading over directional clarity.
EUR/USD hit resistance at 1.1485 and has started to retreat. If buyers fail to reclaim this level, the pair may drift towards support at 1.1420. Alternatively, a bullish rebound would shift focus to 1.1675 and 1.1730 as potential resistance zones. This week’s Eurozone inflation data will be key to determining the next direction.
GBPUSD continues to show strength after taking out the 1.35221 low, but so far has not triggered any major selling pressure. The lack of bearish momentum suggests further upside is possible, with the next key resistance at 1.3670. Whether the pair pushes higher or stalls will likely depend on Wednesday’s CPI report. Any surprise uptick in inflation could change the tone quickly, so we’re staying flexible.
USDJPY dropped from the 145.75 area but found support again near 142.785, a level that has held in previous weeks. The bounce from there suggests bulls may have regained some control. As price moves higher, we’re now watching 145.15, 145.75, and 146.55 for possible bearish reactions. If the BOJ hints at any shift in policy tone when it holds rates at 0.5%, we could see stronger moves either way.
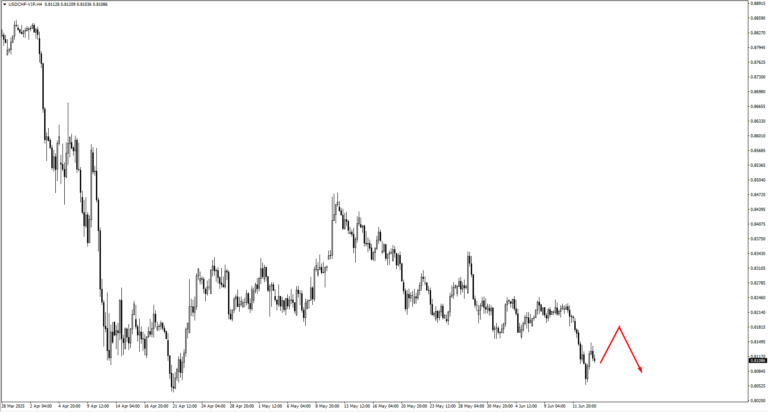
USDCHF remains under pressure and may be setting up for a new leg lower. If price consolidates beneath 0.8195, that area becomes a potential short zone. Should the 0.80388 low be taken out, we’ll be looking for bullish confirmation next, particularly if the SNB does surprise markets by cutting rates from 0.25% to 0.00% as forecasted. Either way, a shift in Swiss franc volatility may follow.
AUDUSD is still caught in consolidation, but the pressure is building. If price pushes up to 0.6575, it could attract sellers looking for a downside continuation, especially with employment data sharply downgraded from 89.0K to 19.9K. We’re also watching how price behaves near the green trend line marked on our chart—this is where we expect any real directional move to show its hand.
NZDUSD continues to respect its support along the green trend line. However, price remains soft, and a liquidity sweep below that line isn’t off the table. If that happens, we’ll be looking closely at the reaction—either to confirm a deeper move or to catch a reversal setup. With limited data out of New Zealand this week, the pair may simply track AUD sentiment.
USDCAD retested the 1.3590 low and even pushed briefly below it, hinting at bearish intent. If this move holds, the next support at 1.3500 becomes the key zone for price action. Stronger oil prices could lend the Canadian dollar a tailwind here, particularly if geopolitical risk continues to support crude. Still, we’re waiting on a clear confirmation before calling for further downside.
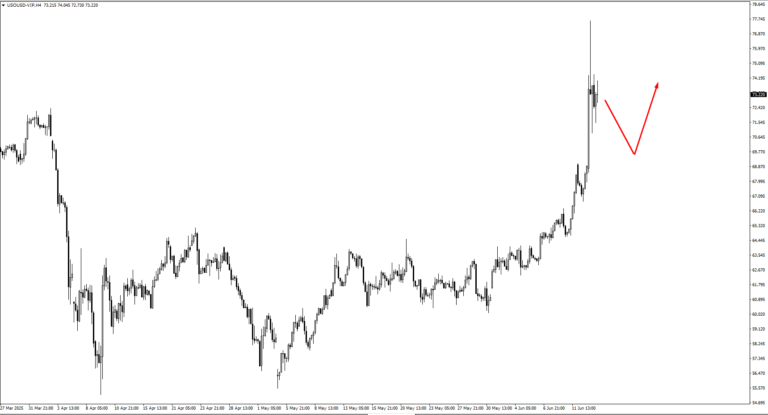
USOil remains supported, with prices holding firm as geopolitical tensions between Israel and Iran remain unresolved. Traders are reluctant to sell into this kind of uncertainty, and if consolidation holds above 68.40, we could see another push higher. However, without fresh headlines, the rally may struggle to gain traction. A pullback to that 68.40 area could attract buyers again.
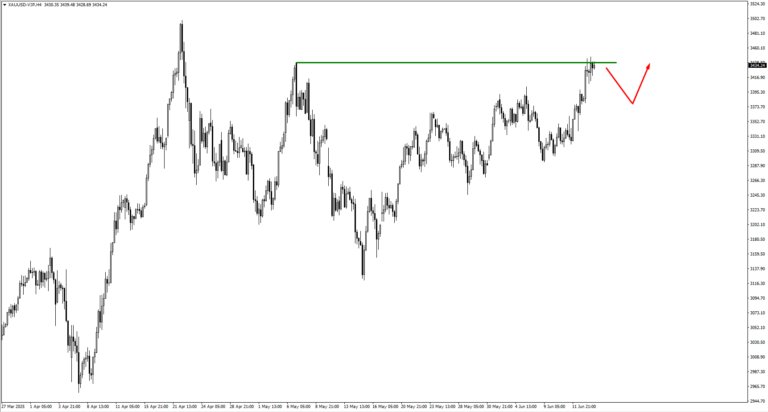
Gold has breached the 3439 level, but confirmation is still lacking. Should prices falter, we’ll be eyeing the 3385 and 3355 levels for buyer interest. The upcoming US inflation data and Fed tone could determine whether gold breaks out or stalls.
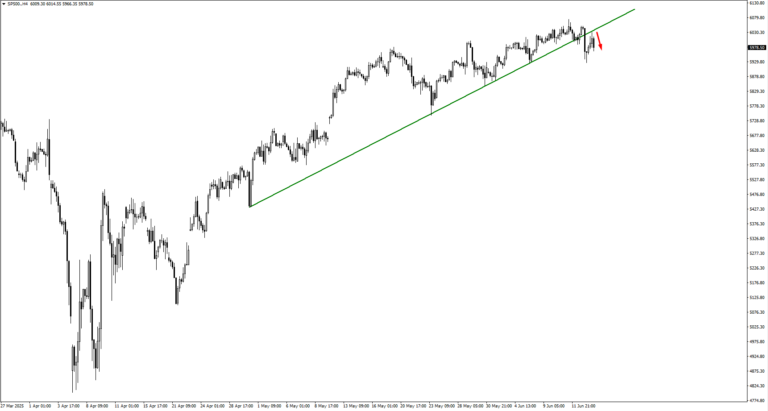
SP500 has pulled back slightly but remains well above the monitored 6000 area. So far, sellers have not shown strong conviction. If price consolidates here, it may just be a pause before another move higher. However, any weakness in earnings forecasts or a hawkish tone from the Fed could trigger a sharper correction. We’re watching for clearer signs of either.
Bitcoin is consolidating after its massive run, with potential bearish setups forming around the 106,950 area. If sellers reclaim control, a drop through the 102,666 low could lead to a deeper flush. On the other hand, continued consolidation may simply be the market catching its breath. Either way, volatility is likely to return soon, so we’re keeping tight watch on the edges of this range.
Natural Gas bounced off the 3.25 area and is now heading toward the 3.52 zone. Bulls will want to see continued follow-through to confirm the move. This week could bring more upside, but traders will likely wait to see if price can hold above the current levels before committing to new longs.
Key Events This Week
On Tuesday, the spotlight turns to Japan, where the Bank of Japan is set to announce its latest policy rate decision. Markets expect it to remain at 0.5 percent, unchanged from previous meetings. However, the real focus will be on any change in language. If Governor Ueda signals the possibility of a rate hike or hints at scaling back stimulus, the yen could strengthen sharply. This would pressure USDJPY, which is already bouncing within a sensitive range. Japanese policymakers have so far resisted tightening, but inflationary pressures and currency weakness may force their hand. Traders should brace for a reactive move, even if the headline rate holds steady.
Come Wednesday, the UK takes centre stage with its Consumer Price Index (CPI) report. Forecasts suggest a year-on-year reading of 3.3 percent, slightly lower than the previous 3.5 percent. While this indicates a modest cooling in inflation, the difference is slim. The reaction in GBPUSD will likely depend on whether price has already made a new swing high before the release. If so, the data could trigger a retracement, especially if inflation undershoots expectations. However, a surprise spike in the numbers could revive rate hike speculation and give sterling a fresh boost. Either way, this CPI print has the potential to jolt the market out of its holding pattern.
Thursday brings a flurry of decisions from four major economies. First up is the U.S. Federal Reserve, expected to keep its Federal Funds Rate at 4.5 percent. After weeks of mixed data and growing calls for rate cuts later this year, traders will dissect the statement for any dovish or hawkish shifts. The Fed’s tone here matters more than the number. If policymakers express concern about sticky inflation or a tight labour market, the dollar could catch a bid. But if the tone leans toward patience or future easing, risk assets could rally further.
At the same time, Australia’s Employment Change data drops, with a sharp drop in hiring projected: 19.9K jobs expected versus 89.0K previously. That’s a steep slowdown, and if the report confirms weakness, AUD could come under pressure—especially if paired with dovish signals from the Reserve Bank of Australia. Price action in AUDUSD has already been drifting, and this data could be the spark for a more decisive move.
Switzerland also enters the fold Thursday with the Swiss National Bank’s rate decision, where markets anticipate a cut from 0.25 percent to 0.00 percent. If that happens, the franc could weaken, particularly against the dollar and euro. But as with most central bank meetings this year, the reaction may depend more on the outlook than the rate itself. Traders will look for clues about how long the SNB expects to remain accommodative, especially amid global divergence in monetary policy.
Rounding out Thursday’s lineup is the Bank of England, expected to leave its Official Bank Rate at 4.25 percent. The decision itself is unlikely to surprise, but the statement could still move markets. If policymakers emphasise persistent inflation risks, GBP could hold its gains or even strengthen. But if they acknowledge progress in disinflation or hint at a more neutral stance, sterling may lose steam.
This week won’t deliver blockbuster surprises on paper, but the tone from central banks and the nuance in CPI figures could still swing markets. We’re preparing for pockets of volatility, especially around FX pairs and commodities tied to rate-sensitive currencies. As always, the message between the lines may matter more than the headline print.


