Early European buying lifts EUR/JPY near 183.00, keeping the bullish tone intact
EUR/JPY rose to around 182.90 in early European trading on Thursday. The move came as markets priced in the ECB keeping its benchmark rate at 2.0% for the rest of this year, with possible increases next year.
Japan’s National CPI is due on Friday. Annual inflation eased to 2.1% in December 2025, the lowest level since March 2022. A stronger CPI print could lift expectations for an earlier BoJ rate hike.
In Pakistan, gold prices declined on Thursday, according to compiled data
Gold prices in Pakistan fell on Thursday, according to data compiled by FXStreet. Gold was priced at PKR 44,813.80 per gram, down from PKR 44,948.43 on Wednesday.
The price per tola fell to PKR 522,715.80 from PKR 524,269.60 the previous day. Other listed prices were PKR 448,151.10 for 10 grams and PKR 1,393,866.00 per troy ounce.
How Local Gold Prices Are Calculated
FXStreet calculates local gold prices by converting international prices using the USD/PKR exchange rate and local units. Prices are updated daily using market rates at the time of publication, so local prices may vary slightly. Central banks hold more gold than any other group. According to the World Gold Council, they added 1,136 tonnes (worth about $70 billion) in 2022. This was the largest yearly total since records began. Gold often moves in the opposite direction of the US Dollar and US Treasuries. It can also move against risk assets like stocks. Key drivers include geopolitical tension, recession concerns, interest rates, and shifts in the US Dollar, since gold is priced in USD (XAU/USD). Local prices are only slightly lower, but the bigger story for derivatives depends on global forces. Gold’s inverse link with the US Dollar matters most. With the Dollar Index (DXY) down nearly 4% since last autumn to around 101.5, gold has a stronger base of support. This is an important trend to watch in the weeks ahead.Interest Rates And Derivatives Outlook
Interest rate expectations are the main driver of gold. The sharp rate hikes of 2023 and 2024 are now in the past. Markets are pricing in possible US Federal Reserve rate cuts later this year. The cooler-than-expected January 2026 inflation reading of 2.8% supports that view, and it often helps non-yielding assets like gold. Steady demand from central banks also matters. After record buying in 2022, central banks added another 1,050 tonnes to reserves through 2025. This ongoing official buying helps support prices and can limit how far gold falls. Gold’s safe-haven role is becoming important again. After a strong run for much of last year, stock markets are showing more volatility, and company guidance for the next quarter is mixed. This uncertainty may lead some traders to add gold derivatives as a hedge. Geopolitical tensions and trade disputes also continue to support gold. When these risks rise, investors often move to safer assets. Because of this, sharp price drops may offer chances to position for higher volatility. Create your live VT Markets account and start trading now.Dividend Adjustment Notice – Feb 19 ,2026
Dear Client,
Please note that the dividends of the following products will be adjusted accordingly. Index dividends will be executed separately through a balance statement directly to your trading account, and the comment will be in the following format “Div & Product Name & Net Volume”.
Please refer to the table below for more details:
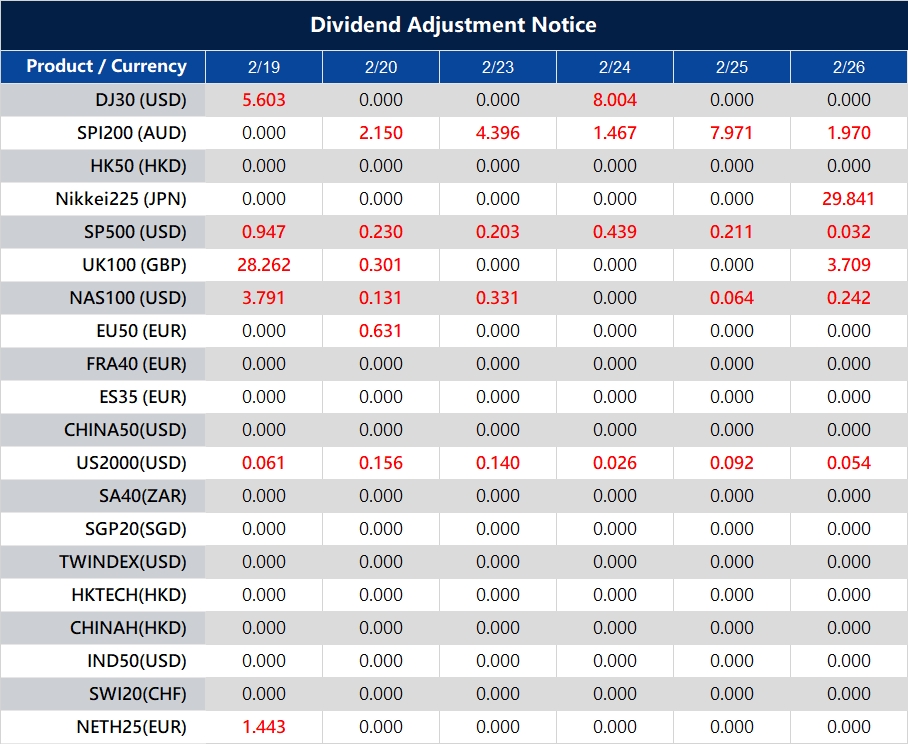
The above data is for reference only, please refer to the MT4/MT5 software for specific data.
If you’d like more information, please don’t hesitate to contact [email protected].
Sterling stays below 1.3500 against the dollar, hovering near four-week lows amid expectations of a BoE rate cut
GBP/USD steadied after three straight days of losses this week. It traded in a narrow range near a four-week low during Thursday’s Asian session. The pair was just below 1.3500 and still looked vulnerable to further downside.
Sterling weakened as markets raised the odds of a Bank of England rate cut at the March meeting. This came after a soft UK jobs report and a fall in UK consumer inflation to its lowest level in almost a year.
Dollar Strength And Policy Divergence
A stronger US Dollar added pressure. Support came from the Federal Reserve’s January meeting minutes, released on Wednesday. Policymakers were divided on whether more rate cuts were needed and when they should happen. They weighed stubborn inflation against the 2% target. Geopolitical risk also stayed high after reports that the US military could strike Iran as soon as this weekend. This helped boost demand for the US Dollar and kept GBP/USD tilted lower, with any bounce seen as limited. Traders watched Thursday’s US data, including Weekly Initial Jobless Claims, the Philly Fed Manufacturing Index, and Pending Home Sales. Markets also looked to speeches from FOMC members and Friday’s US PCE Price Index for clearer direction. At this time last year, markets were already positioning for the Bank of England to cut rates in March 2025. That pushed GBP/USD down toward 1.3500. The outlook was driven by weaker UK jobs data and inflation falling to its lowest level in nearly a year. It set the tone for a longer period of sterling weakness.Volatility Focused Derivatives Approach
Now, we can see the effect of that earlier mood, with the pair trading much lower near 1.2680. But the backdrop has changed. January 2026 data shows UK inflation holding firm at 4.0%, which is double the BoE’s target. With the BoE base rate at 5.25%, the case for near-term rate cuts is much weaker than it was in 2025. On the US side, the Dollar’s strength tells a similar story to early 2025, when Fed officials did not want to cut rates too quickly. The latest Core PCE Price Index for January 2026 sits at 2.9%, still well above the 2% goal. This supports the Federal Reserve keeping its funds rate in the 5.25% to 5.50% range. That puts both central banks in a tough spot and increases uncertainty—something derivatives traders can use. Rather than taking a strong directional view, the next few weeks may suit strategies that benefit from volatility as markets react to each new inflation or jobs update. Options such as long straddles or long strangles may work well, as they can profit from a large move in either direction. Create your live VT Markets account and start trading now.During Asian trading, EUR/JPY rises toward 182.80, extending gains as yen support may limit further upside
EUR/JPY rose for a second session and traded near 182.80 during Asian hours on Thursday. Upside may be capped as the Japanese yen finds support from expectations of further Bank of Japan (BoJ) tightening.
Reuters reported that markets price in nearly an 80% chance of a BoJ rate hike in April 2026. Policymakers are expected to review new data before taking any further steps.
Japan Data And Yen Support
Japan’s core machinery orders rose 19.1% month on month to ¥1,052.5 billion in December 2025. This followed an 11% drop in November and beat forecasts for a 4.5% rise. The jump was linked to large, one-off orders from refineries and nuclear fuel producers. Private-sector orders rose 16.8% year on year in December, after a 6.4% fall in November. This also beat forecasts for a 3.9% gain. The Financial Times reported that ECB President Christine Lagarde may step down before October 2027. It did not give a timeline. Focus now shifts to Japan’s national CPI on Friday, along with early PMI data for Germany and the Eurozone. The BoJ targets inflation of around 2%. It used QQE from 2013, added negative rates and yield curve control in 2016, and raised rates in March 2024.Key Risks And Trading Outlook
EUR/JPY is moving higher, but the rally looks fragile, so caution is warranted. The market strongly expects the BoJ to raise rates in April, with close to an 80% probability priced in. That expectation could act as a firm cap on the pair in the weeks ahead. The case for a stronger yen is growing. Japan’s national core CPI for January 2026 held at 2.4%, staying above the BoJ’s target. While the surge in December 2025 machinery orders was seen as a one-off, it still supports the view that the economy can handle tighter policy. Friday’s national CPI report will be key for confirming (or challenging) this trend. On the other side, the euro faces headwinds from political uncertainty around the ECB presidency. Leadership doubts can weigh on a currency even when economic data is stable. The latest Eurozone Composite PMI for January 2026 was 48.5, which still signals contraction and makes the euro’s strength look less convincing. For derivatives traders, this backdrop points to higher volatility into the April BoJ meeting. One-month implied volatility for EUR/JPY has already risen to a six-month high of 9.5%, suggesting the market is preparing for a larger move. In this environment, buying puts to hedge against a downside pullback, or using straddles to trade a volatility rise, may be sensible. A similar setup played out in 2025. When expectations for a BoJ shift peaked, the yen strengthened quickly and EUR/JPY dropped sharply. The current upswing feels like the type of run-up that has come before past corrections. Create your live VT Markets account and start trading now.During Asian trading, USD/JPY approaches 155.00 as hawkish Fed minutes boost the dollar against the yen
USD/JPY rose slightly to near 155.00 in early Asian trade on Thursday. The move came as the US Dollar strengthened after hawkish signals in the Federal Reserve’s meeting minutes. Traders are now waiting for Japan’s National CPI report on Friday for the next cue.
The Fed has cut its benchmark rate by a total of 0.75 percentage points across moves in September, October, and December. This brought the target range to 3.5%–3.75%. Minutes from the January meeting showed officials were divided on what comes next, with several saying rate hikes could still be on the table.
Japan Political And Fiscal Backdrop
In Japan, Prime Minister Sanae Takaichi’s recent election win has lifted expectations for looser fiscal policy. This includes talk of a two-year suspension of the food sales tax. The IMF has warned Japan against such tax cuts, arguing they could undermine fiscal stability. Markets currently see the next Bank of Japan rate hike as most likely in April. Some also see March as possible if wage growth and inflation stay strong. Expectations for more BoJ tightening by April or July are generally supportive for the Yen and could weigh on USD/JPY. The Yen is driven by Japan’s economic data, BoJ policy, the US–Japan bond yield gap, and overall risk sentiment. Direct BoJ intervention is rare. Meanwhile, the BoJ’s ultra-loose policy from 2013 to 2024 helped weaken the Yen, until the central bank began a gradual shift in 2024. Earlier in 2025, USD/JPY pushed toward 155.00 due to hawkish Fed signals and a more cautious BoJ. Now, on February 19, 2026, the pair trades much lower near 148.50 as central bank policy paths have moved away from last year’s expectations. This change reflects the steady, but clear, policy tightening Japan has delivered over the past 12 months.Policy Divergence And Trading Implications
As expected, the Federal Reserve cut rates into the 3.50%–3.75% range late last year. But US inflation has remained stubborn. The latest Core PCE reading is still above 3%, which has kept the Fed on hold since December 2025. This has helped prevent a larger drop in the US Dollar and has kept it relatively firm against other currencies. In contrast, the Bank of Japan followed through with the rate hikes expected in 2025. It lifted its policy rate to 0.25% through two separate increases. This was a major shift away from negative rates and has supported the Japanese Yen. Traders are now looking for the BoJ’s next signal, which will depend heavily on upcoming data. In the weeks ahead, one major event for traders is Japan’s annual “Shunto” spring wage talks. Early reports suggest large unions are seeking wage gains above 5%, a level not seen in decades. If the final wage deals are strong, the BoJ may feel pressure to tighten further to contain inflation, which would likely support the Yen. With that setup, derivatives traders may look to position for more Yen strength, which would mean a lower USD/JPY. One straightforward approach is buying USD/JPY put options expiring in April or May 2026 to target a possible post-Shunto rate hike. Put spreads—buying one put and selling another at a lower strike—may offer a lower-cost way to express the same view. Still, the US–Japan rate gap remains wide. The US 10-year Treasury yield is around 4.2%, while Japan’s 10-year yield is near 0.9%. This gap supports carry trades and can keep demand under USD/JPY. So while momentum may favor a lower USD/JPY, pullbacks could attract strong buyers. Create your live VT Markets account and start trading now.DXY steadies near 97.70 in Asian trading after rising to a one-week high, keeping upside potential
The US Dollar Index (DXY), which measures the US dollar against a basket of major currencies, traded in a narrow range during Thursday’s Asian session. This came after it climbed to a more than one-week high. It held near 97.70 and was little changed on the day.
Minutes from the January FOMC meeting showed officials were divided on whether, and when, to cut interest rates. Inflation remained the main concern. Some officials said cuts could be needed if inflation drops as expected. Others warned that cutting too soon could put the Federal Reserve’s 2% inflation goal at risk.
Fed Minutes Jobs Data And Geopolitical Risk
The minutes followed last week’s strong January Nonfarm Payrolls report. That report lowered expectations for faster policy easing and helped support the dollar. Reports that the US military could be ready to strike Iran as early as this weekend also kept geopolitical risk in focus. This supported demand for the dollar as a safe-haven. Markets still price in at least two Federal Reserve rate cuts in 2026 after softer US consumer inflation data last Friday. Traders stayed cautious despite a positive market mood. Attention now turns to Friday’s US Personal Consumption Expenditure (PCE) Price Index, which is likely to drive the next move. This same time last year, in early 2025, the US Dollar Index was also consolidating near 97.70 as the Federal Reserve remained deeply divided. Strong jobs data was balanced by expectations that at least two rate cuts were coming. That created a tense standoff for the Greenback. Geopolitical risks tied to Iran also helped support the dollar by keeping its safe-haven appeal in place. Today, conditions look very different. The dollar has strengthened, and the DXY now trades around 104.55. The Fed ended up holding rates steady through most of 2025 because inflation stayed persistent. That outcome went against the market’s earlier hopes for aggressive easing. The gap between those expectations and the Fed’s actual path has been a major reason for the dollar’s rise over the past year.Inflation Labor And Volatility Signals
Recent data still gives the Federal Reserve—and the dollar—a mixed outlook. The January 2026 Consumer Price Index (CPI) report, released last week, showed core inflation edging down to 3.1%. That is still well above the Fed’s 2% target. At the same time, the latest Nonfarm Payrolls report showed a solid gain of 195,000 jobs. That points to a resilient economy and makes the timing of any rate cuts this year harder to judge. For derivatives traders, stubborn inflation combined with steady growth suggests volatility in rate-sensitive assets may stay high. Options strategies, such as buying straddles on euro or yen futures, can help traders position for a large move without having to pick a direction. Implied volatility for these currency pairs has risen to a three-month high of 9.2%, highlighting current uncertainty. Looking ahead, the focus shifts to the upcoming PCE Price Index, the Fed’s preferred inflation measure. A stronger-than-expected reading could push back expected rate cuts. That could lift the DXY and pressure equity index futures. Traders should be prepared for choppy trading and stay flexible around key data releases in the weeks ahead. Create your live VT Markets account and start trading now.Geopolitical tensions keep WTI above $65 despite slipping in Asian trading after a 4.9% fall
WTI traded near $65.00 a barrel during Asian hours on Thursday, after dropping 4.9% in the previous session. Prices stayed supported by supply risks tied to US-Iran tensions and stalled Ukraine-Russia talks.
US-Iran negotiations remain unresolved. Tehran said there was a “general agreement” on the framework for a possible nuclear deal. US officials said Iran has not met US conditions. US President Donald Trump said military action is still possible, and reports suggest it could turn into a long campaign.
Geopolitical Risks Support Prices
Reuters reported that two days of peace talks in Geneva between Ukraine and Russia ended with no progress. Ukrainian President Volodymyr Zelenskiy said Russia is delaying US-led efforts to end the four-year war. Meanwhile, Russian forces kept striking energy infrastructure and continued advancing on the battlefield. In trade flows, India’s state-run Bharat Petroleum Corporation Limited bought Venezuelan crude for the first time. HPCL Mittal Energy Limited also bought Venezuelan cargoes for the first time in two years, Reuters reported, citing sources. The American Petroleum Institute said US weekly crude stocks fell by 0.609 million barrels last week. This partly offset the previous week’s 13.4 million-barrel increase, the largest build since January 2023. Earlier last year, WTI held near $65 a barrel mainly because of major supply risks. US-Iran tensions were high, and the war in Ukraine showed no clear path to ending. This helped put a floor under prices, even as inventory data moved around. Since then, the market has continued to price in a baseline level of geopolitical risk. In the second half of 2025, prices strengthened after OPEC+ signaled it would cut output more aggressively to defend the $70 level. That helped push WTI into a $75–$80 range for several months. Risks linked to Iran and Russia did not disappear, but attention shifted toward OPEC+ supply discipline. This showed up in lower global inventories in Q3 and Q4 reports last year.Demand Signals Challenge The Bull Case
Now, in February 2026, that story is being tested by new concerns about global demand. China’s latest manufacturing PMI came in at 49.2, below 50, which marks the line between growth and contraction. This raises worries about a slowdown in the world’s largest oil importer. It also raises the question of whether OPEC+ cuts can offset a real drop in consumption. This week’s Energy Information Administration (EIA) report supports a more cautious view. It showed a surprise crude inventory build of 4.2 million barrels, despite expectations for a small draw. This is the third straight weekly build, which suggests supply may be rising faster than demand in the near term. That is very different from the large drawdowns seen late last year. In the weeks ahead, the push and pull between weaker demand signals and geopolitical supply risks could drive higher volatility. Strategies that benefit from large price moves, such as buying straddles or strangles, may help capture that uncertainty. Selling short-dated call options with strikes above $80 could also generate income, if demand concerns limit rallies. Create your live VT Markets account and start trading now.During Asian trading, USD/CAD slips toward 1.3695 as rising crude prices boost the Canadian dollar
USD/CAD slipped to around 1.3695 in Asian trading on Thursday. Higher crude oil prices supported the Canadian dollar, as Canada is a major oil exporter. Oil prices climbed on ongoing tension between the US and Iran.
Canada’s CPI inflation eased to 2.3% year over year in January, down from 2.4% in December, according to Statistics Canada data released Tuesday. The figure missed the 2.4% market forecast, which increased expectations of another Bank of Canada rate cut.
Market Drivers In Focus
The US dollar found support from the January Federal Open Market Committee minutes. Several policymakers said rates may need to rise if inflation stays high. On Friday, markets will watch the preliminary US Q4 GDP reading, along with the PCE Price Index and S&P Global PMI data. These releases may drive near-term moves in USD/CAD. Looking back to early 2025, a key divergence began to form between the US and Canada. Softer Canadian inflation was already pointing to Bank of Canada (BoC) rate cuts, while the Federal Reserve kept a hawkish tone. This policy split has shaped trading for the past year. That view proved accurate. The BoC started cutting rates in mid-2025 and has lowered its policy rate to 3.75%. January 2026 inflation data showed CPI at 2.1%, supporting the case that the BoC still has room to ease. This has continued to weigh on the Canadian dollar.Policy Divergence And Trading Implications
In the US, inflation has been more persistent. The Federal Reserve has kept rates steady at a higher level, as core PCE inflation printed at 2.8% for January 2026, still above target. This has widened the rate gap between the US and Canada, making the US dollar more attractive. This gap has generally pushed USD/CAD higher over the past 12 months, lifting it from the 1.3700 area toward 1.3900. At the same time, strong oil prices have helped support the Canadian dollar, with WTI crude trading above $85 a barrel. These forces—higher US rates versus strong energy prices—are keeping the pair in a tight balance. In the coming weeks, selling volatility in USD/CAD could be a possible strategy. With strong but offsetting drivers, the pair may stay in a range. Traders could look at selling strangles, which means selling an out-of-the-money call and an out-of-the-money put to collect premium, and profiting if the pair does not move sharply. If oil volatility rises, buying options can offer defined risk for a directional view. If a trader expects a further jump in energy prices to strengthen the loonie, they could buy USD/CAD put options. If they expect the rate gap to outweigh oil, buying call options may fit that view. Create your live VT Markets account and start trading now.Australia’s part-time employment fell by 32.7K from a 10.4K increase, signalling a downturn in hiring trends
Australia’s part-time employment fell by 32.7K in January. The previous figure was 10.4K.
That’s a 43.1K swing from the prior month. It shows a shift from growth to a decline in part-time jobs.


