India’s HSBC Composite PMI was 57 in March. This was above expectations of 56.5.
The March composite PMI for India coming in at 57, above the expected 56.5, confirms the economy is expanding faster than we anticipated. This signals robust business activity and strong demand, carrying forward the positive momentum we saw throughout 2025. This upside surprise should fuel positive sentiment for Indian indices like the Nifty 50 in the immediate term.
Market Implications For Indian Equities
Given this data, we should consider buying near-month call options on the Nifty 50 to capture a potential upward move. Long positions in futures for banking and capital goods sectors are also attractive, as they directly benefit from this economic strength. For instance, recent reports for the first quarter of 2026 showed that corporate credit growth has remained strong, hovering near 16%, and this PMI data suggests that trend will continue.
However, this strong growth, with India’s inflation for Q1 2026 still sticky around 5.1%, makes it highly likely the Reserve Bank of India will hold interest rates steady later this month. A more hawkish stance from the RBI could put a ceiling on any rally, so we should be cautious with long-term bullish bets. Historically, markets have often reacted with a brief dip when rate cut expectations are pushed further out.
A more measured strategy would be to sell out-of-the-money puts on major indices. This approach benefits from the underlying positive sentiment and collects premium, providing a cushion if the market trades sideways while waiting for the RBI’s decision. Looking back at similar periods in 2025, strong data often led to short rallies followed by consolidation, which made such premium-selling strategies very effective.
Gold prices in the Philippines fell on Monday, based on FXStreet data. Gold was priced at PHP 9,078.41 per gram, down from PHP 9,115.74 on Friday.
Gold also dropped to PHP 105,889.60 per tola from PHP 106,324.20 per tola on Friday. Other listed prices were PHP 90,785.16 for 10 grams and PHP 282,366.10 per troy ounce.
How FXStreet Calculates Local Gold Prices
FXStreet derives Philippine gold prices by converting international prices using the USD/PHP rate and local measurement units. Prices are updated daily at the time of publication and are provided as reference, with local rates able to differ slightly.
Central banks are the largest holders of gold and reported purchases totalled 1,136 tonnes worth about $70 billion in 2022, according to the World Gold Council. This was the highest annual total since records began.
Gold prices can move with the US Dollar, interest rates, and market conditions, as it is priced in dollars (XAU/USD). Gold is described as inversely correlated with the US Dollar, US Treasuries, and risk assets, and it can rise during geopolitical instability or recession fears.
The post notes that an automation tool was used to create it.
Macro Drivers To Watch
We are seeing a small dip in gold prices today, but this is likely minor noise in a larger trend. The key drivers for the coming weeks will not be daily fluctuations but macroeconomic factors like interest rate policy and central bank demand. We believe the broader environment remains supportive for gold.
The market’s attention is focused on the U.S. Federal Reserve, which is expected to begin cutting interest rates later this year. As we saw during the tightening cycle of 2024-2025, higher rates weigh on gold, so this anticipated policy pivot is creating a positive outlook for the metal. A weaker dollar often follows rate cut expectations, providing another tailwind for gold prices.
We must also watch the central banks, who continue to be major buyers and provide a strong floor for the market. After adding a near-record 1,037 tonnes in 2023, reports show this trend of de-dollarization continued through 2024 and 2025, particularly from emerging market banks. This steady, large-scale buying limits the downside for any price corrections.
Persistent geopolitical instability also supports gold’s role as a safe-haven asset. Lingering global tensions mean that any unexpected flare-up could trigger a rapid flight to quality, causing sharp upward price movements. We saw this pattern multiple times last year, where stock market volatility directly benefited gold holdings.
For derivative traders, this small price drop could present a tactical opportunity to build long positions. We view buying call options or establishing long futures contracts as a reasonable strategy over the coming weeks. One might also consider strategies that benefit from increased volatility, as the lead-up to Fed decisions often makes the market jumpy.
Create your live VT Markets account and start trading now.
Start trading now – Click here to create your real VT Markets account
Singapore’s retail sales rose 8.3% year on year in February. This was up from -0.4% in the previous period.
The latest figure shows a rebound in annual retail sales growth. It marks an 8.7 percentage point change from the prior reading.
The sharp rebound in Singapore’s retail sales for February 2025, from a contraction to an 8.3% year-on-year expansion, is a powerful signal of renewed consumer strength. We see this as being driven by the continued recovery in tourism, with visitor arrivals in early 2025 now consistently above one million per month, and resilient domestic demand. This economic momentum is stronger than many had anticipated.
This data significantly raises the stakes for the upcoming Monetary Authority of Singapore (MAS) policy meeting this month. Stronger domestic demand could lead to persistent inflation, which we’ve seen hover around 3% in recent months, pressuring the central bank to consider a tightening move. However, looking back at a similar situation in April 2023, the MAS chose to hold policy steady despite high inflation, so we should not assume an aggressive response is guaranteed.
For foreign exchange traders, this uncertainty creates an opportunity in the Singapore dollar. We believe positioning for SGD strength through short-dated call options is a prudent strategy, particularly against currencies with softer economic data. This allows us to capitalize on a potential hawkish surprise from the MAS while capping our risk if they decide to wait and see.
In the interest rate markets, we are seeing expectations for a policy tightening get priced in, which is steepening the front end of the yield curve. Traders should consider using instruments like short-term interest rate swaps to position for higher rates in the coming months. This trend will likely accelerate if upcoming March inflation data also shows an unexpected increase.
This robust consumer activity is also a clear positive for equities, especially for banks and retail-focused companies on the Straits Times Index (STI). We saw a similar pattern in early 2023, where the STI gained over 3% in the weeks following a strong retail sales report. Buying call options on the STI or a basket of consumer stocks provides direct exposure to this domestic growth narrative.
Start trading now – Click here to create your real VT Markets account
Gold prices in the Philippines fell on Monday, based on FXStreet data. Gold was priced at PHP 9,078.41 per gram, down from PHP 9,115.74 on Friday.
Gold dropped to PHP 105,889.60 per tola from PHP 106,324.20 on Friday. Listed prices also include PHP 90,785.16 for 10 grams and PHP 282,366.10 per troy ounce.
FXStreet derives local gold prices by converting international prices using USD/PHP exchange rates and local measurement units. Prices are updated daily using market rates at the time of publication, and local rates may differ slightly.
Central banks are the largest holders of gold, and they added 1,136 tonnes worth about $70 billion in 2022, according to the World Gold Council. This was the highest annual total since records began, with China, India, and Turkey among those increasing reserves.
Gold often moves inversely to the US Dollar and US Treasuries, and it can also move opposite to risk assets such as equities. Prices can be influenced by geopolitical events, recession fears, and interest rate changes, and gold is priced in US dollars (XAU/USD).
The small dip in local gold prices is just noise against a much larger backdrop. We see the market looking past these daily moves and focusing on the Federal Reserve’s next steps. With inflation now consistently below 3%, traders are pricing in potential rate cuts later this year, which is typically bullish for a non-yielding asset like gold.
Central bank demand remains a critical floor for the price. Looking back, we saw them add a massive 1,037 tonnes in 2023, nearly matching the 2022 record, and data showed 2025 was another strong year of accumulation, particularly from emerging economies. This institutional buying provides a strong tailwind and absorbs physical supply from the market.
The inverse relationship with the US Dollar is playing out exactly as expected. The Dollar Index (DXY) is holding in the low 100s, well below the highs we saw back in 2022, and the prospect of lower US interest rates is likely to keep a lid on its strength. A stable to weaker dollar makes gold more attractive for holders of other currencies.
Given this environment, any price weakness should be viewed as a potential entry point for long positions. For derivative traders, this could mean buying call options to speculate on a move back towards the all-time highs we saw last year in 2025. Selling cash-secured puts below the current price is another strategy to consider, taking advantage of any dips to collect premium.
We cannot ignore the persistent geopolitical tensions that continue to simmer in the background. This uncertainty underpins gold’s role as a primary safe-haven asset for diversifying portfolios away from riskier equities. Even if a major conflict doesn’t escalate, the underlying risk helps prevent any significant, sustained sell-offs in the metal.
Start trading now – Click here to create your real VT Markets account
Silver (XAG/USD) extended declines for a third day, trading near $72.20 per troy ounce in Asian hours on Monday. Prices faced pressure as Middle East tensions lifted energy costs and supported expectations of tighter central bank policy.
Demand linked to risk aversion did not support silver, as selling was driven by forced liquidations to cover losses in other markets. The metal offers no yield, which can reduce its appeal when interest-rate expectations rise.
Escalating Middle East Tensions
US President Donald Trump issued an ultimatum to Iran, warning of strikes on power plants and other civilian infrastructure if the Strait of Hormuz is not reopened. He set a deadline for Tuesday at 8 PM Eastern Time, while Iran rejected the demand and attacks on energy assets in the region continued.
Markets increasingly expect the US Federal Reserve to delay rate cuts, with the chance of higher borrowing costs later this year if inflation persists. Attention is turning to the latest Federal Open Market Committee Meeting Minutes for further policy guidance.
The Bank of England kept the Bank Rate at 3.75% in March by a unanimous vote, pausing recent easing amid inflation risks tied to higher energy prices. The European Central Bank reiterated that policy will remain restrictive until inflation returns to the 2% target.
With silver failing to act as a safe haven, we are likely seeing forced selling to cover margin calls in other volatile markets. This pattern of liquidating safe havens isn’t new; we witnessed a similar dynamic during the liquidity crunch of 2020 when investors scrambled for US dollars. Therefore, traders should consider put options on silver, anticipating further downward pressure as long as this deleveraging continues.
Trading Implications And Positioning
The escalating conflict around the Strait of Hormuz is the primary driver, directly threatening global energy supply. As recent Energy Information Administration (EIA) data reminds us, over 20% of the world’s daily petroleum consumption passes through that chokepoint. We should therefore look at long positions in crude oil futures or call options on energy-sector ETFs, as any further disruption could cause a significant price spike.
Persistent energy-driven inflation is forcing the Fed’s hand, a situation reminiscent of the policy scramble back in 2022 when headline CPI last exceeded 7%. Consequently, traders should anticipate higher yields by considering short positions in U.S. Treasury note futures. The market is already pricing out the rate cuts we expected just last quarter, with fed funds futures now suggesting policy will remain tight through the end of the year.
In this environment of geopolitical risk and hawkish central bank policy, the US Dollar is reasserting its dominance as the ultimate safe haven. We are seeing capital inflows pushing the Dollar Index (DXY) to highs not seen since the market turmoil in 2025. Traders should favor long USD positions against currencies like the Euro and Pound, whose central banks face a tougher battle with stagflation.
Create your live VT Markets account and start trading now.
Start trading now – Click here to create your real VT Markets account
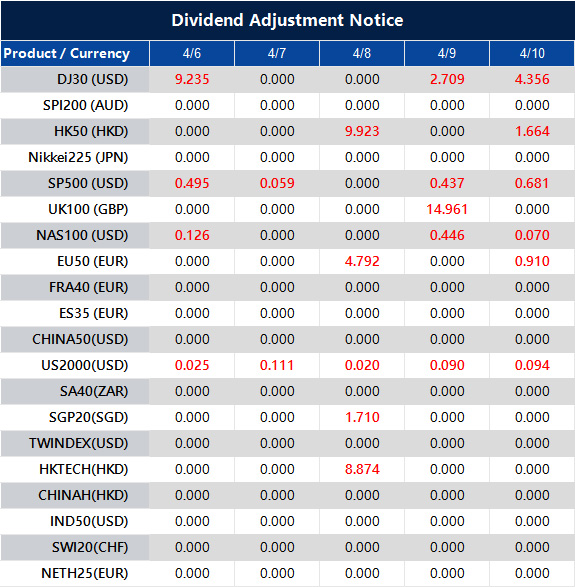
Please note that the dividends of the following products will be adjusted accordingly. Index dividends will be executed separately through a balance statement directly to your trading account, and the comment will be in the following format “Div & Product Name & Net Volume”.
Please refer to the table below for more details:
The above data is for reference only, please refer to the MT4/MT5 software for specific data.
If you’d like more information, please don’t hesitate to contact [email protected].
Crude remains the lead signal, Brent trades near $107 and WTI near $112 after an 11% weekly surge.
Tuesday 8pm ET Iran peace talks set the first directional move across USOil, USDX, SP500, XAUUSD and BTCUSD.
US Core PCE on Thursday and US CPI on Friday decide whether inflation fears harden into tighter rates pricing.
March NFP beat expectations at 178,000 versus 65,000, but revisions and household data still signal an uneven trend.
Markets are not treating this as a one-day headline spike. Traders keep pricing the Strait of Hormuz as the transmission channel for the entire macro story. Partial vessel passage does not equal a stable reopening of commercial energy flows, so the risk premium stays embedded in crude.
The clearest consequence shows up in the oil tape. Brent trades near $107 heading into the week, while WTI settled near $112 after a holiday-shortened week that delivered a gain of a little under 11%. The directional bias stays upward on any escalation headline, with the strike pause set to expire Tuesday evening ET and no ceasefire framework in place.
When oil stays elevated, traders stop reading the conflict as a standalone geopolitical story. The market begins to price second-order effects, higher transport costs, stickier inflation prints, and less room for policy relief.
Trump has made the timing harder for markets to dismiss. His latest comments tied the next phase of the conflict directly to the Strait of Hormuz, with a Tuesday evening deadline and the threat of fresh strikes on Iranian infrastructure if passage is not restored.
President Trump threatened to rain ‘hell’ on Tehran if it did not make a deal and reopen the Strait of Hormuz by his April 7 deadline, as he praised US special forces who rescued an airman in a high-risk mission from deep inside Iran https://t.co/1D0whPbsMRpic.twitter.com/sCCcAEcDBj
At the same time, he kept the door open to a deal. That mix of pressure and conditional diplomacy helps explain why traders are reluctant to fade the oil premium too quickly. Every hint of negotiation offers temporary relief, but each harder line pulls crude, the dollar and broader risk sentiment back toward defence.
Markets recoiled as war jitters over Iran deepened, with stocks sliding, oil surging well over $100 per barrel and the dollar firming after US President Trump dashed hopes for clarity on when the Middle East conflict might end https://t.co/O6kuzQd3d4pic.twitter.com/jkY8zyPZ8K
That also sharpens the sequence for the rest of the week. The focus is no longer just the war in broad terms, but whether the Strait itself becomes the trigger for the next move. If the rhetoric cools and diplomacy gains traction, crude can unwind and risk assets can stabilise.
If the deadline passes with the same aggressive tone, the market is more likely to treat elevated oil as a lasting inflation problem rather than a short-lived geopolitical spike. That keeps pressure on equities, supports USDX, and gives Core PCE and CPI even more weight than usual.
A Jobs Beat That Calms Growth Fear, but Tightens the Policy Setup
March nonfarm payrolls printed at 178,000 versus a 65,000 median expectation. January was revised up to 160,000, while February was revised down to negative 133,000. The headline looks strong, but the internal picture looks mixed. Combined revisions read uneven rather than accelerating.
Household data adds friction. The labour force fell, and total employment declined, while unemployment dipped slightly. Wage growth continued, but slowed, and the average workweek slipped, a pattern often seen before layoffs rise.
This setup shifts the macro balance. Payroll growth remains positive, and unemployment remains low, so the imminent labour-driven recession risk falls. At the same time, an energy shock raises inflation risk and complicates any near-term easing narrative.
Tuesday’s 8 pm ET Deadline is the First Gate for Risk
Tuesday’s Iran peace talks at 8pm ET act as the first event that can reset the week’s tone. Four broad paths sit in front of markets:
De-escalation and improved Hormuz signals can drive crude sharply lower and lift equity futures.
A status quo open allows a brief relief bid off the NFP headline, while energy stays elevated.
Escalation into the deadline can push crude higher again and pressure risk assets, particularly rate-sensitive and consumer areas.
A nervous, weaker open can develop even without new escalation as traders fade risk into the deadline.
This week does not begin with CPI. It begins with whether the oil premium expands or contracts.
Read more about Trump and how his statements have been affecting market movements here.
Core PCE and CPI Decide Whether the Oil Shock Spreads
Thursday brings US Core PCE Price Index m/m at 0.4% forecast versus 0.4% previous, alongside final GDP q/q at 0.7% forecast versus 0.7% previous. Friday follows with US CPI y/y at 3.4% forecast versus 2.4% previous.
Inflation data sits in a different context when crude stays bid. A firm print can harden rates pricing and keep the dollar supported. A softer print can open the door for risk assets to stabilise, but that relief tends to fade if oil remains elevated.
Cross-Asset Read Heading Into the Week
The dollar stays the cleanest read on defensive positioning when the market prices conflict risk and higher-for-longer policy bias. Gold stays pulled between safe-haven demand and a firmer dollar backdrop. Equities attempt to rebound, but oil and inflation risk keep pressure on the follow-through. Crypto behaves like risk, with the next impulse tied to whether the week opens with relief or stress.
Key Symbols to Watch
USDX | USOil | XAUUSD | SP500 | BTCUSD
Key Events of the Week
Date
Currency
Event
Forecast
Previous
Analyst Remarks
07 Apr
USD
Result of Iran Peace Talks (8pm EST)
N/A
N/A
Oil reaction sets the week’s tone for USDX and risk.
08 Apr
NZD
Official Cash Rate
2.25%
2.25%
Watch guidance for NZD volatility, not the hold itself.
09 Apr
USD
Core PCE Price Index m/m
0.40%
0.40%
A firm print supports USDX and keeps rates sticky.
09 Apr
USD
Final GDP q/q
0.70%
0.70%
Confirms the growth pulse entering the oil shock.
10 Apr
USD
CPI y/y
3.40%
2.40%
Hot CPI can harden the higher-for-longer tone quickly.
For a full view of upcoming economic events, check out VT Markets’ Economic Calendar.
Key Movements Of The Week
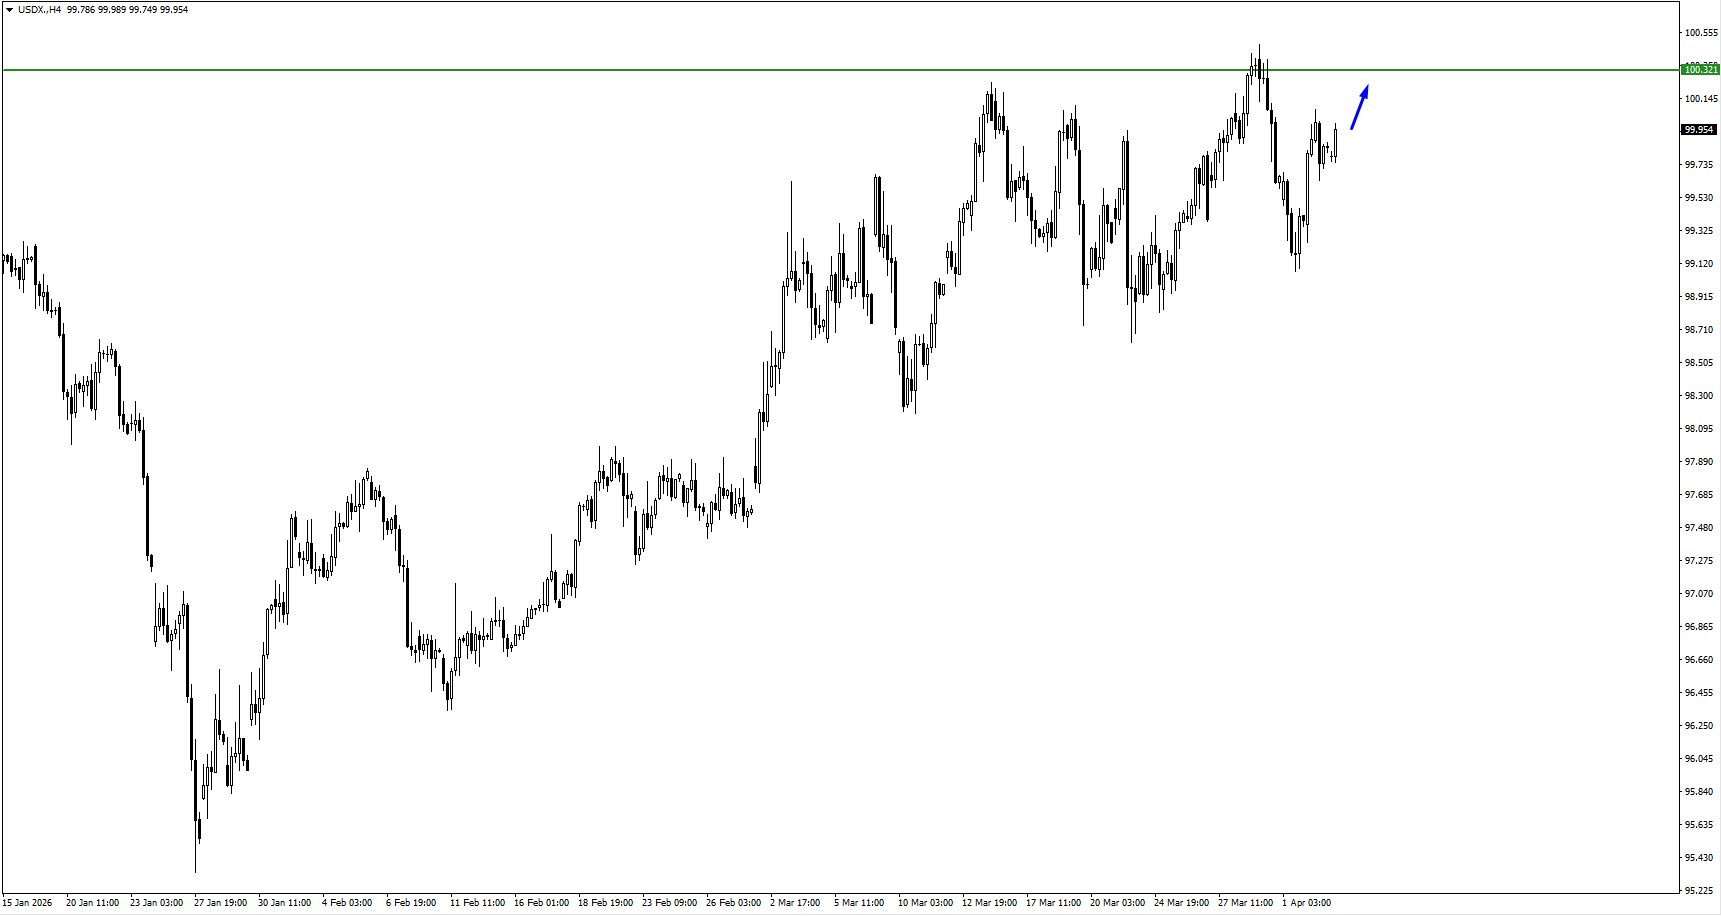
USDX
Price holds firm as traders price the Tuesday 8pm EST deadline into rates expectations.
Thursday’s Core PCE is the first inflation checkpoint before CPI resets the week.
A calmer oil tape after peace talks would be the clearest way to soften the bid.
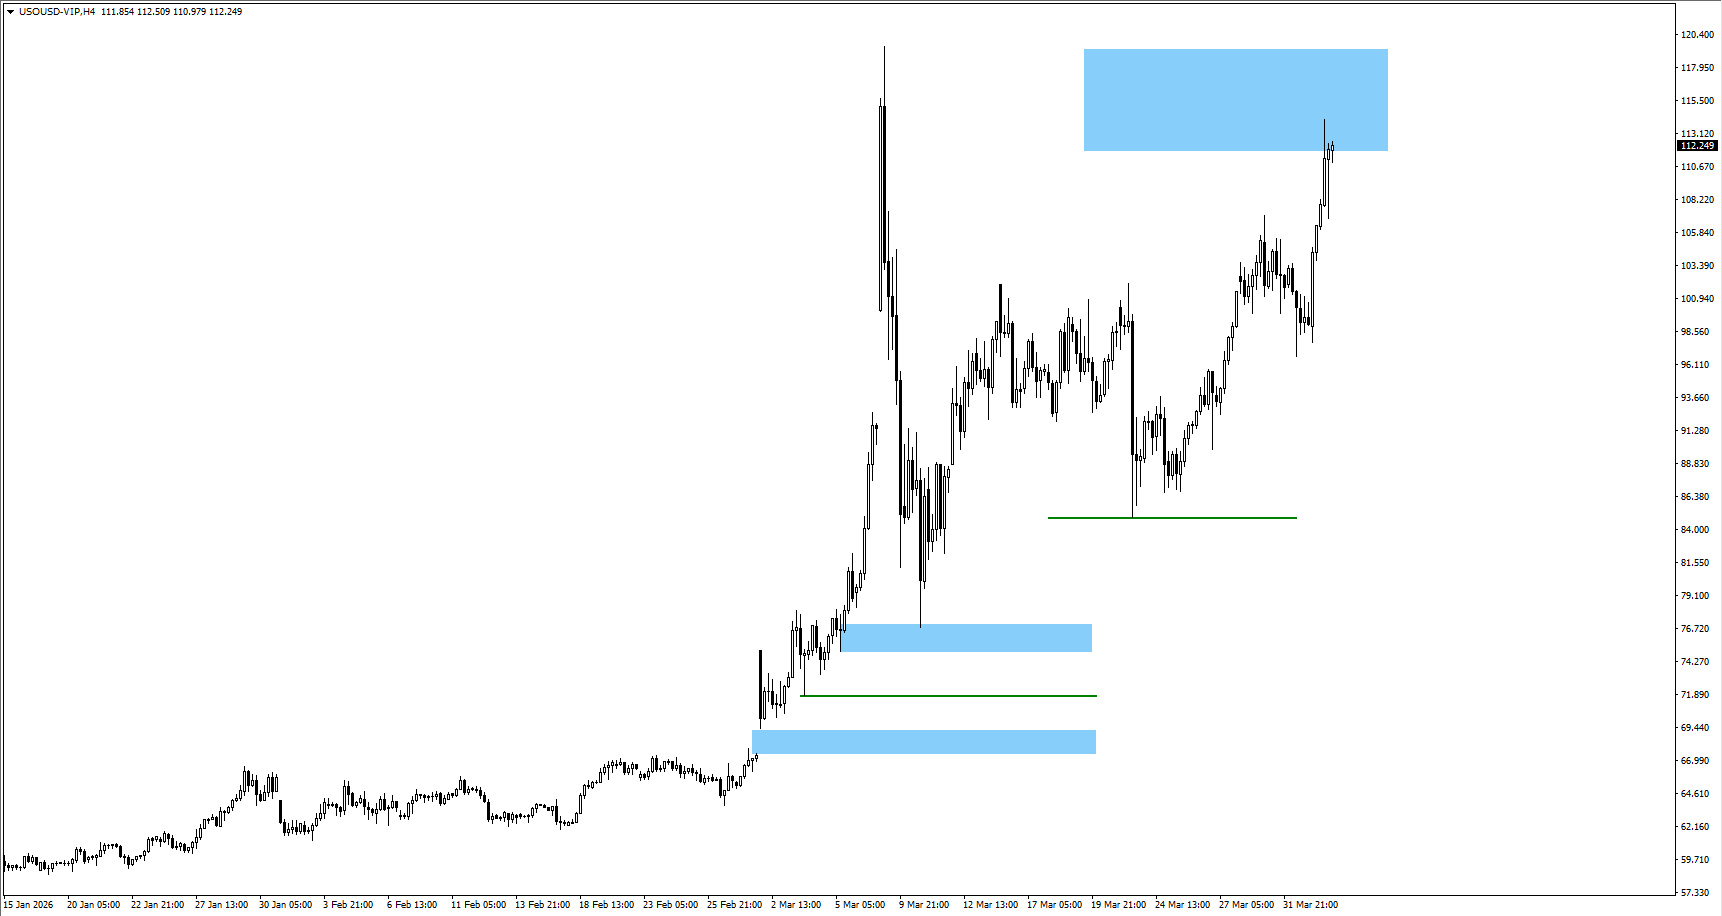
USOil
Price stays elevated with supply fears tied to Hormuz and the Tuesday deadline.
A de-escalation headline can trigger a fast retracement, but it needs follow-through.
If crude holds above $110 into CPI, inflation risk stays live across assets.
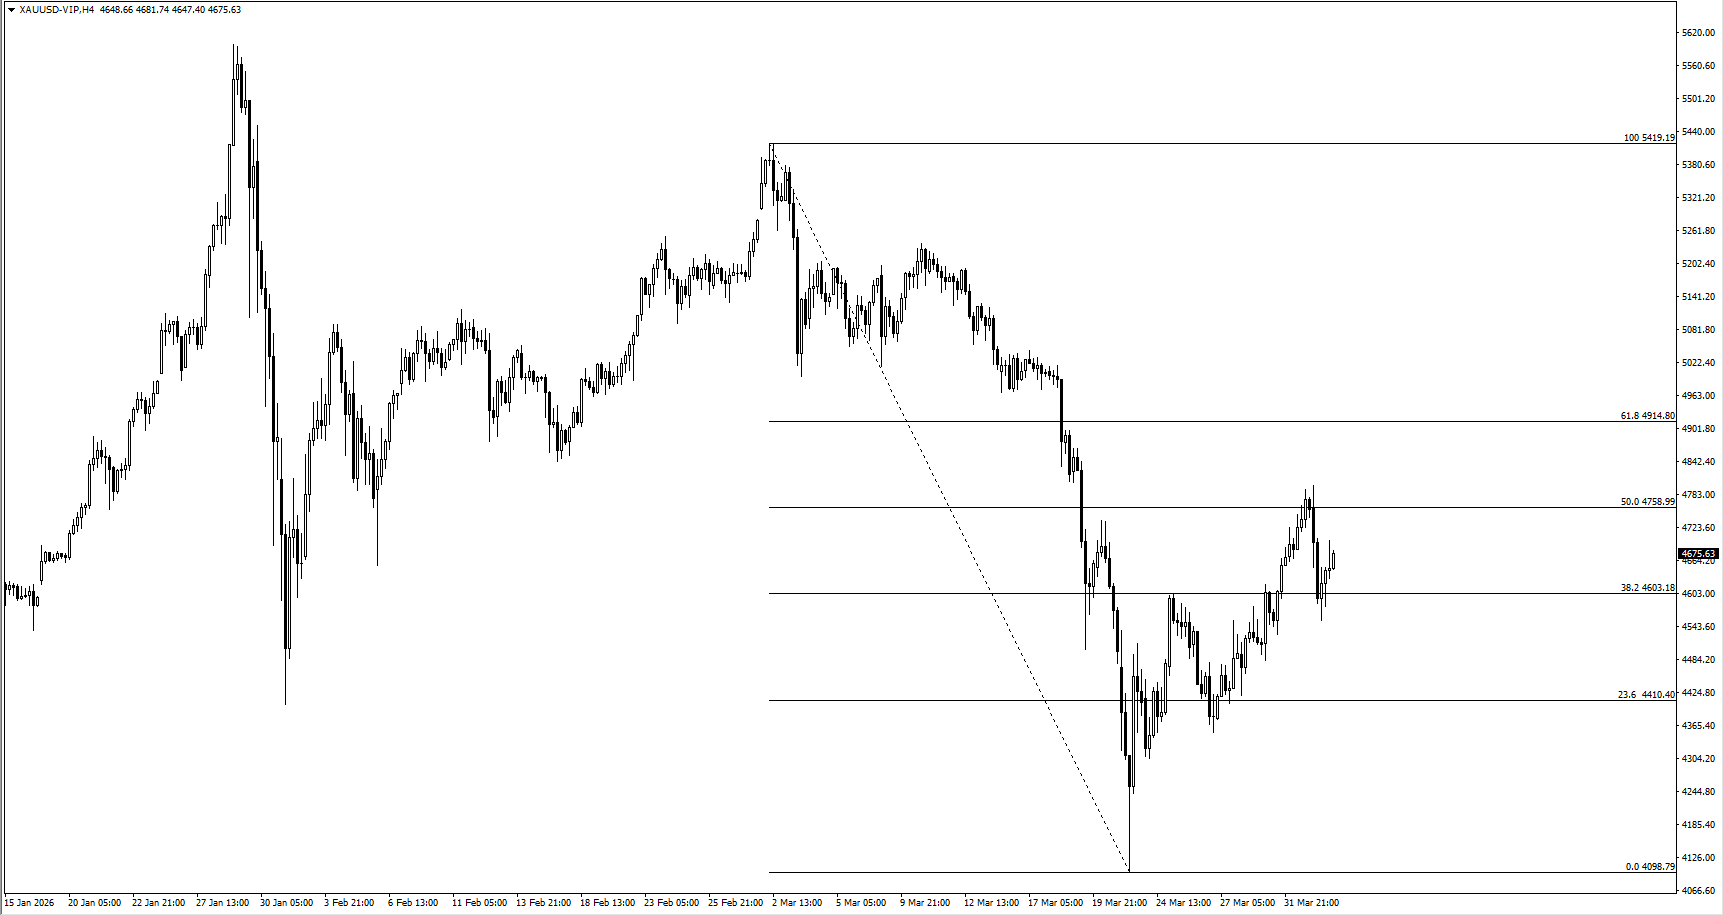
XAUUSD
Gold softened as USD strength and yields reduced rate-cut hopes.
Tuesday headlines matter because oil drives the inflation hedge impulse.
CPI can quickly change demand if it validates broader inflation pressure.
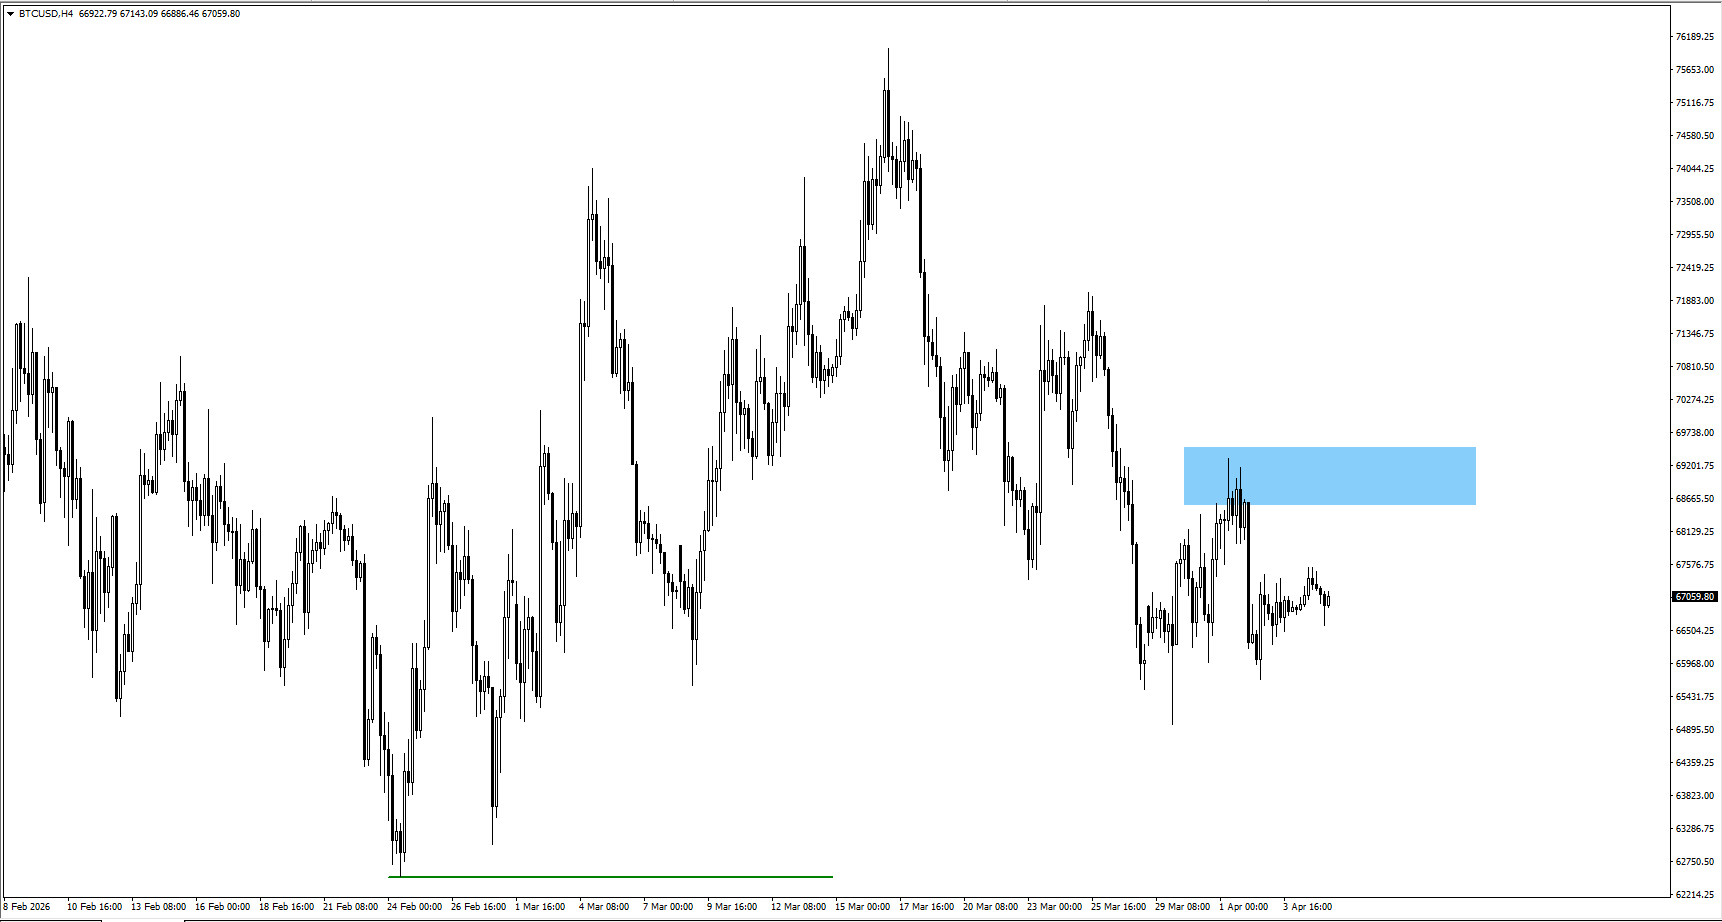
BTCUSD
BTCUSD remains headline-sensitive as macro risk swings liquidity appetite.
A softer inflation tone after CPI would be a tailwind if oil also eases.
A renewed oil spike tends to tighten conditions and pressure risk exposure.
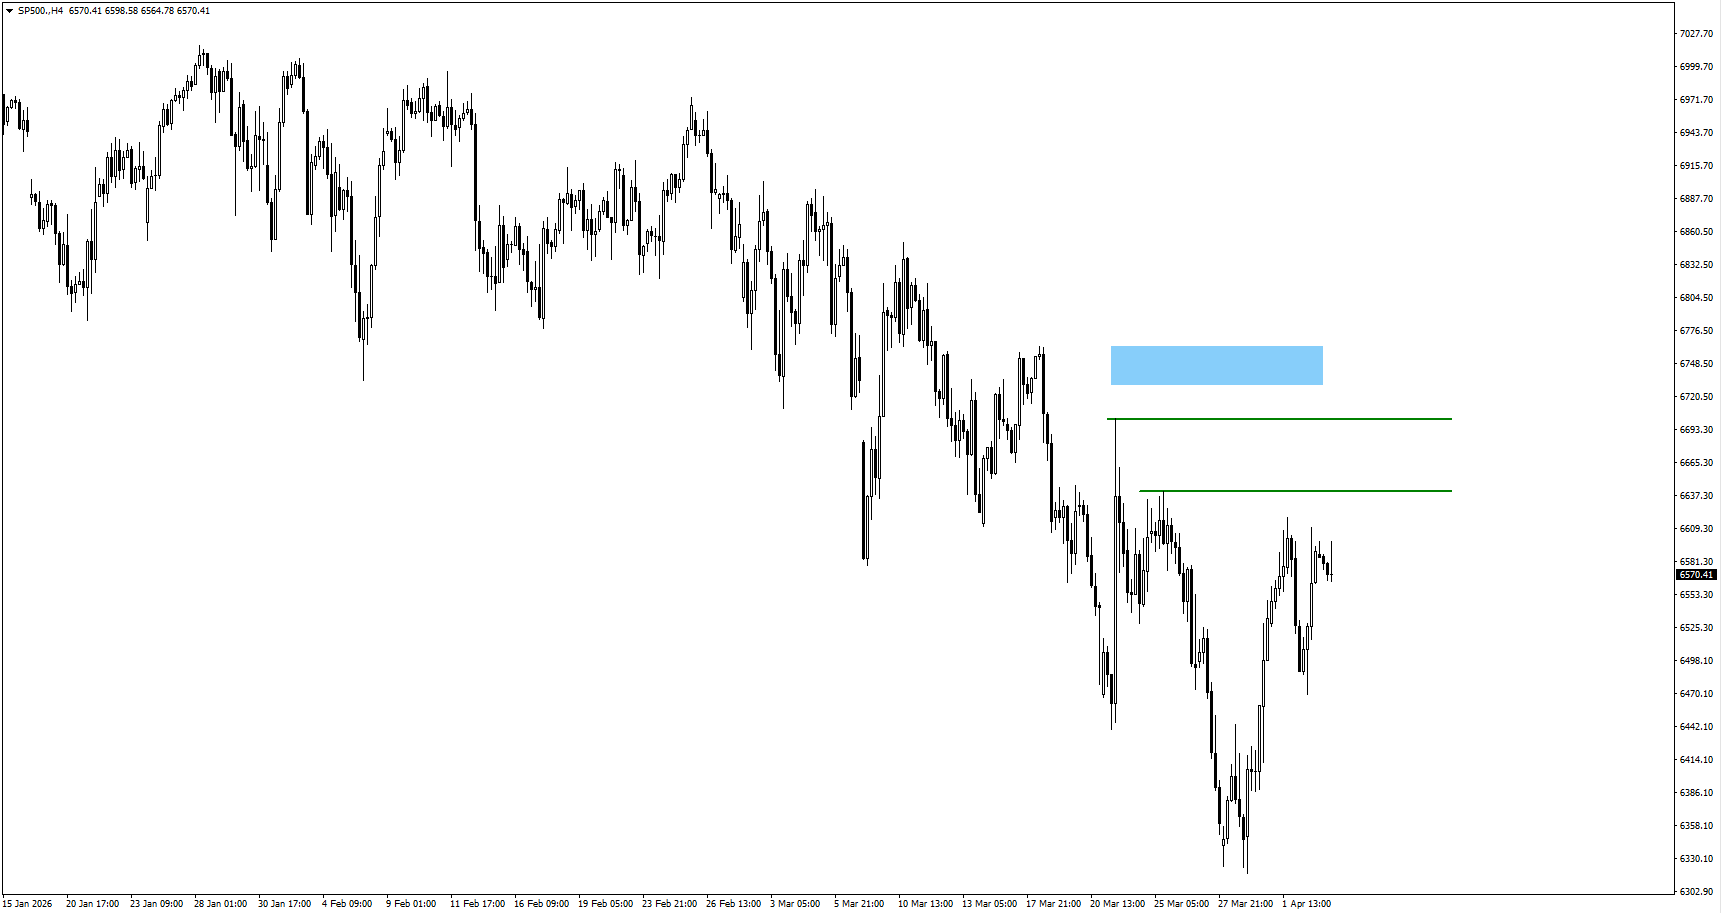
SP500
Rebound attempts face a simple ceiling while crude stays high and CPI looms.
A relief path starts with oil cooling after Tuesday’s peace talk outcome.
Hot CPI can revive the higher-for-longer trade and cap equity follow-through.
Bottom Line
This week still runs through the same sequence: oil first, then inflation, then rates. Tuesday’s 8pm EST Iran peace talks are the first real trigger because they can unwind or extend the crude risk premium that is driving the broader cross-asset tone.
If oil stays elevated into Thursday’s Core PCE and Friday’s CPI, markets will find it harder to price a clean easing path, which keeps USDX supported and caps confidence in SP500 and higher-beta risk.
If headlines cool and inflation data comes in calmer than feared, the market gets room to pivot toward relief, but the burden of proof sits with crude and the inflation prints.
Create a live VT Markets account today to access our platform features, including market insights and educational content.
Trader Questions
What Is The Market Actually Pricing Around The Iran Peace Talks?
Markets are pricing the risk premium in crude first. If the talks reduce supply anxiety, USOil can retrace and SP500 can breathe. If they fail, elevated oil keeps inflation expectations firm and supports USDX.
Why Do Core PCE And CPI Matter More When Oil Is High?
Higher oil feeds headline inflation quickly and can spill into inflation expectations. Core PCE helps show whether underlying price pressure is cooling or staying sticky. If both Core PCE and CPI run firm, traders tend to push back rate-cut bets and keep the dollar bid.
How Can Traders Read The Cross-Asset Signal Without Overthinking It?
Start with USOil, then check USDX, then SP500. If oil stays high and USDX stays firm, conditions are still defensive and risk rallies struggle to follow through. If oil cools and USDX softens, SP500 and BTCUSD usually get cleaner upside air.
What Are The Key Levels Traders Usually Watch This Week?
Traders will keep an eye on whether BTCUSD can accept above 71,000, whether USDX can hold around the 100 area, and whether USOil can stay supported near 112. XAUUSD tends to react most sharply after CPI when the market reprices inflation and rates.
Start trading now – Click here to create your real VT Markets account
US natural gas futures are around $2.84 per MMBtu, still close to their lowest level since August 2025.
The EIA reported a 36 Bcf injection for the week ending March 27, versus a five-year average 4 Bcf withdrawal for the same week.
Middle East tension is lifting oil and LNG risk, but US gas remains cushioned because domestic fundamentals stay loose and export terminals are already running near capacity.
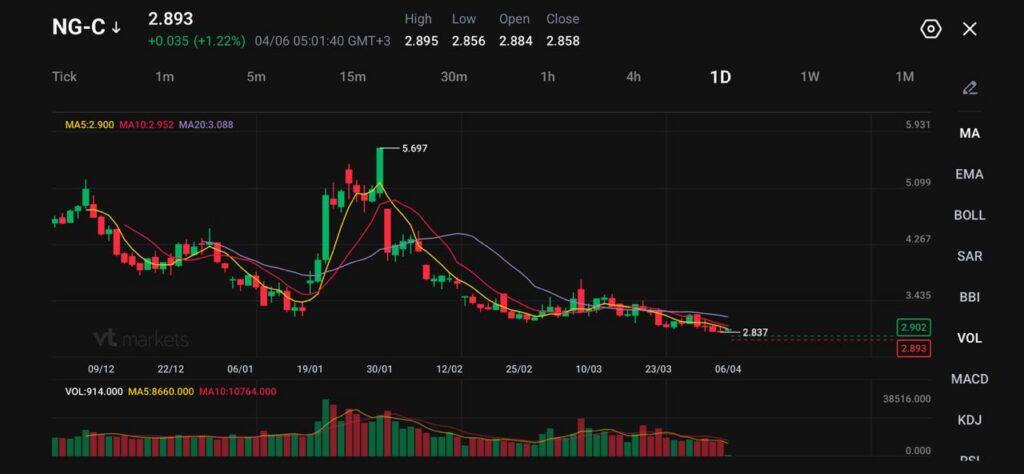
US natural gas is trying to bounce, but the broader tone remains soft. NG-C trades at 2.893, up 0.035 or 1.22%, while broader pricing sits around $2.84 to $2.89 per MMBtu. Even with the small uptick, futures are still sitting close to the weakest levels since August 2025.
Turkey is weighing whether to raise electricity and natural gas prices, sources say, as surging global energy costs risk increasing the burden of state subsidies https://t.co/SilfHtCNWS
Spring weather is doing most of the work. Mild temperatures are cutting heating demand just as the market shifts from winter withdrawals into refill season. That soft demand backdrop is strong enough to overpower a large part of the geopolitical premium.
A cautious near-term view still favours a heavy market unless weather turns hotter or supply tightens more clearly.
Storage Data Keeps Balance Loose
The latest storage report reinforced the bearish setup. Working gas in storage rose by 36 Bcf in the week ending March 27, taking inventories to 1,865 Bcf. For the same week, the five-year average shows a 4 Bcf withdrawal.
That contrast is the key point. At this stage of the calendar, the market would usually still be drawing gas from storage. Instead, inventories are already building. That tells traders supply is outrunning current demand by a wide enough margin to keep pressure on prices.
Japan’s order for hundreds of Tomahawk missiles from the US is under threat as the American-Israeli war with Iran burns through inventories https://t.co/dsmJd3eWBz
That is why natural gas has struggled to rally even while broader energy markets remain tense.
Iran Risk Matters Less for Henry Hub Than for Oil
The geopolitical threat is still real. Trump warned that the US could strike Iranian infrastructure if the Strait of Hormuz is not reopened, and that has kept oil and global LNG markets on edge.
Henry Hub reacts differently. Oil is directly exposed to Hormuz. US natural gas is much less exposed because domestic production remains abundant and LNG export terminals are already operating near practical limits.
A purchase agreement between Commonwealth LNG and Japan’s top liquefied natural gas buyer, Jera, has been terminated, according to a document filed with the US Department of Energy https://t.co/nvea5tc3Sc
A global gas shock can lift sentiment, but it does not automatically create room for materially higher US exports when the export system is already close to full.
That caps the international spillover into US gas pricing.
A cautious forecast still allows for short-lived spikes on war headlines, but the market needs a domestic tightening signal before it can hold them.
Export Constraints Are Limiting the Upside Response
The export ceiling is what keeps the market grounded. A disrupted Hormuz route threatens a large share of global crude, products, and LNG flows, which supports international gas prices. US natural gas still cannot fully capture that upside when liquefaction capacity is already near max.
More than four-dozen empty Qatari liquefied natural gas tankers are idling across Asia, as the nation’s export plant remains shut and the Strait of Hormuz largely closed because of the war in the Middle East https://t.co/I021MHMatG
Without a meaningful new export outlet, extra overseas demand does not translate into the same kind of runaway move seen in crude. Domestic balances still matter more than foreign panic.
That leaves US gas in a different category from oil. Oil is trading on the shipping shock directly. Natural gas is trading with weather, storage, and export bottlenecks first, then adding a modest geopolitical premium on top.
Technical Analysis
Natural gas (NG) is trading near 2.89, hovering just above recent lows as the market continues to struggle for direction following its sharp decline from the 5.69 peak earlier in the year. Price action remains subdued, with the latest candles reflecting weak rebounds and a lack of sustained buying interest.
The recent low around 2.83–2.84 is holding for now, but the broader structure still shows a series of lower highs and lower lows, keeping pressure on the downside.
From a technical standpoint, the trend remains bearish. Price is trading below all key moving averages, with the 5-day (2.90) and 10-day (2.95) acting as immediate resistance, while the 20-day (3.08) continues to slope downward, reinforcing the underlying weakness. The compression of price near recent lows suggests consolidation, but without a clear reversal signal, this appears more like a pause within a broader downtrend.
Key levels to watch:
Support: 2.84 → 2.80 → 2.70
Resistance: 2.95 → 3.10 → 3.40
In the near term, price is consolidating just above 2.84, a level that has provided recent support. A break below this zone could trigger another leg lower toward 2.80 and potentially 2.70 if selling accelerates.
On the upside, 2.95 is the first level to reclaim. A move above this could lead to a short-term recovery toward 3.10, though any upside is likely to remain corrective unless price breaks and holds above the 3.40 region.
Overall, natural gas remains under sustained bearish pressure, with weak rallies and persistent selling defining the structure. Unless buyers can reclaim key resistance levels, the bias stays tilted to the downside, with consolidation near current levels likely preceding the next directional move.
What Traders Should Watch Next
The next move depends more on domestic balance than on foreign headlines. Weather comes first, then the next EIA storage report, then any change in LNG feedgas flows.
If injections keep running this far above normal, the market can stay pinned near the lows even with oil and global LNG under pressure. If hotter forecasts arrive or output slips enough to tighten balances, natural gas can recover from the $2.84 to $2.89 area. If mild weather persists and storage continues to build early, the market may remain trapped near the recent floor at around 2.837.
Learn more about trading Energies on VT Markets here.
Trader FAQs
Why is US Natural Gas Weak Even With Iran Risk in the Background?
US natural gas is trading more off domestic fundamentals than Middle East headlines. Mild weather has reduced heating demand, storage is building early, and LNG export capacity is already near full use. That combination has limited the risk premium.
What is the Main Reason Prices Are Near Their Lowest Since August 2025?
The biggest reason is loose supply-demand balance. The market is moving out of winter with weak weather demand, while inventories are already rising instead of falling.
What Did the Latest Storage Report Show?
The latest EIA data showed a 36 Bcf injection for the week ending March 27, compared with a five-year average 4 Bcf withdrawal for the same period. That is a much looser result than normal for this time of year.
Why Does a 36 Bcf Injection Matter So Much?
It shows supply is comfortably outpacing demand. At this stage of the calendar, traders would usually expect storage to still be drawing down or at least building more slowly.
Why is Natural Gas Not Rallying Like Oil?
Oil is directly exposed to Hormuz disruption. US natural gas is less exposed because domestic production is strong and LNG export terminals are already operating near maximum capacity. Global gas stress helps sentiment, but it does not translate into unlimited extra US demand.
Start trading now – Click here to create your real VT Markets account