Molly Brooks of TD Securities says uncertainty centres on how many rate cuts the Fed will make, and when
TD Securities expects the Federal Reserve to keep interest rates unchanged for longer. That keeps markets focused on when cuts will start, and how many will follow. Current pricing implies 2bp of cuts in March 2026 and 5bp in April 2026. April pricing could still move higher.
Since 2025, market pricing has mostly lined up with FOMC outcomes, with errors of no more than 2bp. Over the past 5 years, when the Fed left rates unchanged, the average gap between market pricing and the decision was 0.6bp.
In Spain, January’s annual consumer price index came in below forecasts at 2.3%, versus 2.4% expected
Spain’s consumer price index rose 2.3% year on year in January. That was below the 2.4% expected.
The data suggests inflation eased slightly versus forecasts. The release did not include further details.
Spain’s lower-than-expected January inflation (2.3%) suggests price pressures in the Eurozone may be cooling faster than markets expected. This supports the view that the European Central Bank (ECB) could shift to a more dovish stance sooner. For us, that means reviewing positions that are sensitive to ECB rate policy.
This report also follows last week’s data showing Germany’s manufacturing PMI still in contraction, at 48.2. The ECB remains focused on bringing headline inflation—2.7% in December 2025—back to its 2% target. Softer inflation in a major member like Spain strengthens the case for rate cuts.
In the coming weeks, we should consider positioning for lower rates later on the curve. Options include interest rate swaps that benefit from falling rates, or call options on government bonds such as German Bunds. Markets currently price about a 40% chance of a rate cut by the third quarter; this data could push that probability higher.
This shift could also weaken the euro, since lower rate expectations reduce a currency’s appeal. We could look at EUR/USD put options, with strikes below the current spot, to hedge or to position for a decline. A similar setup in the second half of 2025—after softer inflation data from France—was followed by a 2% drop in the euro over the next month.
We should also remember the false signals from mid-2025, when falling energy inflation was offset by sticky services inflation. The key near-term focus is the flash HICP inflation estimate for the full Eurozone, due in about two weeks. That release will help confirm whether Spain’s cooling is local or part of a broader trend.
Spain’s monthly harmonised consumer prices fell 0.8% in January, below forecasts of a 0.7% decline
Spain’s Harmonised Index of Consumer Prices (HICP) fell by 0.8% month on month in January.
This was below the expected fall of 0.7% for the month.
This morning’s data shows Spanish consumer prices fell more than expected in January. That supports our view that disinflation across the Eurozone is building. It also pushes back against the European Central Bank’s (ECB) cautiously hawkish tone in late 2025. The Eurozone’s January 2026 inflation flash estimate was already just below the 2% target. A weaker Spanish reading suggests the final Eurozone figure could come in even lower.
As a result, we expect the ECB to shift in a more dovish direction in the coming weeks. Traders may want to position for lower rates by buying Euribor-linked futures. There is a clear precedent: in 2014, persistently low inflation led the ECB into a more aggressive easing cycle than markets expected.
At the same time, policy is moving in the opposite direction in the United States. January job data still points to economic strength, which supports the Federal Reserve staying on hold. This widening gap should weigh on the euro. We view buying EUR/USD put options as a sensible way to benefit from this trend. The last time we saw a similar policy split in mid-2025, the euro fell by more than 3% over the following month.
For equities, lower borrowing costs are supportive. That makes European stocks more appealing and could draw more capital into the region. Buying call options on broad European indices, such as the Euro Stoxx 50, is one way to gain exposure to potential upside as policy becomes more accommodative.
Spain’s annual harmonised consumer inflation was 2.4% in January, below forecasts of 2.5%
Spain’s Harmonised Index of Consumer Prices (HICP) rose 2.4% year on year in January. This was slightly below the 2.5% forecast.
The update suggests inflation came in a bit cooler than expected. No other details were included.
Eurozone Disinflation Trend
Spain’s softer January inflation print (2.4%) supports the broader disinflation trend across the Eurozone. It also lines up with the latest Eurozone flash estimate, which showed headline inflation easing to 2.6%. Together, these readings add weight to the view that price pressures are starting to fade. As a result, markets are becoming more confident that the European Central Bank will start cutting rates. Interest rate swaps now price in more than a 60% chance of a 25 basis point cut by the June meeting. Expectations are shifting toward easier policy as the main market theme. For us, this argues for positioning for lower yields using interest rate futures. We are considering building long exposure through products such as Euro Schatz futures. This is a straightforward way to express the view that the ECB will respond to weakening inflation in the months ahead. We also expect the euro to weaken, as the rate gap with the U.S. may widen. The price action seen in 2024—when rate-cut expectations began to build—offers a clear example of how this can pressure the currency. We see buying euro put options against the dollar as a cost-effective way to position for a move lower.Equity Options Strategy
This backdrop can also support European equities. However, with volatility still low, outright long positions can be risky. The VSTOXX index is trading near 14.5, which makes long-dated call options on indices like the Euro Stoxx 50 more appealing. This approach keeps upside exposure to a potential rally while limiting downside risk. Create your live VT Markets account and start trading now.During European trade, GBP/USD is steady near 1.3600 support, maintaining a bullish bias within an ascending channel
GBP/USD traded near 1.3600 during European hours on Friday. The pair has moved quietly for four straight days. On the daily chart, it is still inside an ascending channel. Support sits near the lower boundary around 1.3580.
The 14-day RSI is 51, which is close to neutral after falling from overbought levels. The pair is below the nine-day EMA at 1.3632, but it remains above the rising 50-day EMA at 1.3524.
Near Term Technical Outlook
If the price closes back above 1.3632, near-term bullish pressure may build. Key resistance levels are 1.3869 (the highest since September 2021, reached on 27 January), then the channel top near 1.4150, and 1.4248 (the highest since April 2018). If the pair stays below the nine-day EMA, it may keep consolidating. A drop below 1.3580 would put 1.3524 in focus, followed by support near 1.3350. The Pound Sterling dates back to 886 AD and is the UK’s currency. It is the fourth most traded FX unit. It makes up about 12% of transactions and averaged $630 billion a day in 2022. GBP/USD accounts for 11% of FX activity, GBP/JPY 3%, and EUR/GBP 2%. GBP/USD is now trading around 1.2850, far below the 1.3600 area tested in early 2025. The ascending channel discussed then has clearly broken over the past year. This suggests the earlier bullish structure has failed, and the pair is now in a different market phase.Macro Backdrop And Volatility
The drivers of monetary policy for the pound are similar, but the backdrop has changed. UK inflation for January 2026 came in at 3.1%, well above the Bank of England’s target. This keeps pressure on the BoE to hold rates steady. At the same time, UK GDP growth was flat at 0.0% in Q4 2025. Together, these signals increase policy uncertainty. This mix of sticky inflation and weak growth is pushing implied volatility higher in GBP/USD options. Derivatives traders may look at strategies that benefit from larger moves, such as long straddles. These can be useful ahead of the next BoE rate decision in March, because they can profit from a sharp move in either direction and help hedge current uncertainty. In hindsight, 2025 data marked a high point before the slowdown set in. The UK trade balance has also weakened, with the deficit widening in the latest December 2025 report. This remains a headwind for sterling and helps explain why the pair could not hold the earlier highs. Using the same technical approach as before, the pair is now trading well below its 50-day moving average, which sits near 1.2910. This level is acting as firm resistance. That is a bearish shift from 2025, when the average provided support. If the pair cannot regain this moving average in the coming weeks, it would support a bearish view. Create your live VT Markets account and start trading now.USD/CAD rises for a third day, nearing the 1.3600s as the dollar strengthens ahead of US CPI
USD/CAD rose for a third day and hit a four-day high near 1.3630 in early European trading. The move followed a rebound from 1.3500 and came as the US dollar edged higher.
The US dollar stayed slightly stronger after Wednesday’s Nonfarm Payrolls report lowered expectations for a Federal Reserve rate cut in March. Lower crude oil prices also weighed on the Canadian dollar, lifting USD/CAD ahead of US consumer inflation data.
Technical Levels And Momentum
The 100-hour simple moving average is falling at 1.3576, but the price is still above it. The RSI is 68, which is close to overbought. Resistance is at 1.3641, the 61.8% Fibonacci retracement of last week’s drop. The next resistance level is 1.3678, the 78.6% Fibonacci retracement. The MACD is near the zero line with a flat histogram. A break higher could target 1.3700, while a move below 1.3576 would weaken the bullish bias. The technical analysis was produced with help from an AI tool. USD/CAD is extending its rebound from the 1.3500 area and is trading in the mid-1.3600s this Friday. The move reflects a stronger US dollar and a weaker Canadian dollar. The main drivers are different economic outlooks and falling oil prices.Options Strategy Into CPI
The US dollar strengthened after the January 2026 Nonfarm Payrolls report showed job gains of 215,000, well above expectations. This reduced hopes for a Federal Reserve rate cut in March. At the same time, WTI crude oil slipped below $70 a barrel on concerns about slower global demand, which tends to hurt the oil-linked Canadian dollar. This pattern also appeared in the second half of 2025, when strong US data pushed back rate-cut expectations and supported the US dollar. This backdrop creates a potential opportunity ahead of the US Consumer Price Index (CPI) report. If inflation comes in above expectations, it could reinforce a more hawkish Fed stance and push USD/CAD above first resistance at 1.3641. Traders may consider near-term call options with a strike near 1.3650, aiming for a move toward 1.3700. The technical picture supports this bullish view, with price holding above the 100-hour moving average near 1.3576. This level is an important area to watch for risk management on long positions. A break below it would suggest the near-term upward momentum is fading and could point to a more neutral outlook. Create your live VT Markets account and start trading now.Nordea analysts say US strength has peaked, investors are overweight US assets, and a weaker dollar is lifting the euro
Nordea analysts say the recent period of strong US economic performance may have reached its high point. They also say foreign investors are still heavily invested in US assets. That combination could weaken the US dollar further, which would support the euro and push EUR/USD higher over time.
They add that even after a sharp drop over the past year, the US dollar is not weak by historical standards. They also note that low term premiums suggest foreign investors have not fully reduced their US exposure.
Foreign Allocation And Dollar Rebalancing
They give a simple rebalancing example. If foreign investors cut their allocation to US assets from 50% to 40% while the US still runs a current-account deficit, foreigners cannot all sell those assets to US buyers. They say the adjustment would require a roughly 20% fall in the relative value of US assets. They argue that part of the dollar’s strength over the past two decades came from weaker conditions in Europe after the European debt crisis. They point to austerity and small deficits as key factors. They say this could change as Europe increases spending on defence and infrastructure. They add that higher investment can lift growth. With unemployment already low, it could also increase inflation pressure and push interest rates higher. They say this would make the euro more attractive as an alternative to the US dollar. Based on recent data, we believe the long-running trend of US economic outperformance is likely ending. January’s US advance GDP estimate showed growth slowing to 1.5%. At the same time, Eurozone flash PMI surprised to the upside at 51.5. That points to a real shift in momentum. Traders should consider positioning for a continued rise in EUR/USD, as the economic backdrop is now improving faster in Europe.Positioning For A Stronger Euro
Even after the dollar’s notable decline through 2025, it is still strong by historical standards. That leaves room for more downside. US Treasury data for December 2025 showed a fourth straight month of net foreign selling of US assets. This supports the view that global investors are reducing an overweight position. This kind of structural shift supports strategies such as longer-dated EUR/USD call options aimed at a multi-month move. The story of European weakness that shaped the past decade is also changing. New joint investment in defence and energy infrastructure, accelerated by developments in the past two years, is starting to support growth and tighten labour markets. This can make inflation more persistent and could keep the European Central Bank more hawkish than the Federal Reserve. In this framework, reducing exposure to US assets can happen only if those assets fall in relative value, which implies a weaker dollar. Markets showed a version of this last year: the Dollar Index (DXY) fell nearly 9% in 2025 even though the US still ran a current-account deficit. The easier path for the pair still looks higher, which makes strategies like EUR/USD bull call spreads a cost-effective way to position for more upside in the weeks ahead. Create your live VT Markets account and start trading now.Wynn Resorts posts Q4 revenue of $1.87bn, up 1.5% year on year, as EPS falls to $1.17
Wynn Resorts reported revenue of $1.87 billion for the quarter ended December 2025, up 1.5% year over year. Earnings per share (EPS) were $1.17, down from $2.42 a year earlier.
Revenue came in 0.67% above the Zacks Consensus Estimate of $1.85 billion. EPS was 12.17% below the consensus estimate of $1.33.
Las Vegas table drop was $667.57 million versus an estimate of $671.2 million. Table games win was $173.84 million versus $161.94 million, and slot machine win was $129.52 million versus $131.97 million.
Macau VIP table games win at Wynn Palace was $148.5 million versus $160.01 million. Wynn Macau operating revenue was $371.33 million versus $370 million, up 2.1% year over year, while Wynn Palace was $596.36 million versus $614.32 million, up 5.9%.
Encore Boston Harbor operating revenue was $210.19 million versus $210.69 million, down 1.2% year over year. Las Vegas operating revenue was $688.11 million versus $667.42 million, down 1.6% year over year.
Las Vegas casino revenue was $178.28 million versus $177.77 million, down 6.2%, while Encore Boston Harbor casino revenue was $152.02 million versus $156.78 million, down 3.1%. Las Vegas rooms revenue was $222.92 million versus $221.8 million, down 2.5%, and food and beverage was $191.71 million versus $182.13 million, up 3.8%.
The biggest takeaway is the EPS miss. It suggests profit pressure even though revenue rose slightly. The -12.17% EPS surprise will likely outweigh the small revenue beat in the weeks ahead. We believe this could put downward pressure on the stock price.
The U.S. business shows warning signs. Operating revenue fell year over year in both Las Vegas and Boston. This matches recent Las Vegas Convention and Visitors Authority data showing visitor growth stalled in the final quarter of 2025, ending a multi-year recovery trend. The drop in casino revenue is especially concerning for the core U.S. business.
Macau delivered top-line growth, but the details suggest weaker momentum. Wynn Palace revenue missed estimates, and the VIP segment also fell short. VIP play is a key, high-margin driver. Adding to this, January 2026 data from Macau’s Gaming Inspection and Coordination Bureau showed city-wide gaming revenue rose only 4.5%. That missed the 6% consensus forecast, driven by a softer-than-expected start to the Lunar New Year holiday period.
With profit pressure and softer trends in both the U.S. and Macau, we are positioning for downside, or at least limited upside. Derivative traders may want strategies that benefit if the stock falls, such as buying put options or using bear call spreads. These trades can also help hedge against a decline over the next several weeks.
This setup looks similar to mid-2025, when another earnings report showed slowing growth and the stock fell more than 8% in two weeks. In addition, recent Federal Reserve comments point to slower U.S. discretionary spending through 2026. That adds a broader headwind and supports the risk that luxury and travel stocks like Wynn could lag.
Silver trades near $76.60 in Europe after an 11.5% rebound, but still heads for a third straight weekly drop
Silver rose to about $76.60 per troy ounce in early European trading on Friday, after dropping 11.5% in the previous session. Even with the rebound, it was on track for a third straight weekly decline as volatility stayed high.
Thursday’s selloff had no clear single cause. But losses in stocks and cryptocurrencies pointed to broad, forced selling across markets. Systematic and algorithm-driven trading flows may also have amplified the move.
Inflation Data And Fed Expectations
Markets are watching upcoming US inflation data for clues on Federal Reserve policy. Headline CPI is expected at 2.5% (down from 2.7%), while core CPI is seen at 2.5% (down from 2.6%). The CME FedWatch tool showed nearly a 92% chance the Fed would keep rates unchanged in March, up from 82% a week earlier. Markets were also pricing in about two 25-basis-point rate cuts by year-end, with the first cut expected in June. Safe-haven demand eased after Donald Trump said talks with Iran could continue for up to a month. That lowered near-term fears of military action, as the US signaled it would keep pursuing a diplomatic path on Iran’s nuclear programme. At this point in 2025, silver was extremely volatile. Prices bounced back to around $76.50 after a sharp, unexplained 11.5% plunge. That fall was part of a broader market-wide liquidation. It also showed how systematic trading flows can overwhelm fundamentals without warning. With no clear catalyst, uncertainty for traders was high.Positioning And Strategy For 2026
In February 2025, markets were betting that cooling inflation would let the Fed start cutting rates, with the first move expected in June. But core CPI stayed above 2.8% through Q3 2025. The Fed then kept rates steady much longer than investors expected, which limited silver’s upside for most of the year. As a result, silver spent much of 2025 trading in a range. A stronger dollar—driven by the Fed’s more hawkish stance—kept pressure on the metal. Industrial demand helped set a floor, especially demand from the solar sector, where silver use rose about 5% year over year. Geopolitical tension with Iran briefly supported prices, but the situation cooled and did not provide lasting support. Now the setup looks clearer than the chaotic backdrop of last year. January 2026 CPI fell to a two-year low of 2.4%, and the Fed has signaled a more defined path toward easing. CME FedWatch pricing now shows a 75% chance of a first rate cut by May 2026. This shift suggests investors may want to position for potential upside in silver, since lower interest rates reduce the opportunity cost of holding a non-yielding asset. Unlike last year’s forced liquidations, today’s volatility may be more directional. Building exposure through long call options or bull call spreads could be a sensible way to target gains while limiting risk. Industrial demand also remains a strong tailwind. Global manufacturing PMI data for January 2026 showed expansion for a third straight month, supported by green energy initiatives. This demand backdrop may help support prices and reduce downside risk for bullish derivative strategies in the weeks ahead. Create your live VT Markets account and start trading now.Dividend Adjustment Notice – Feb 13 ,2026
Dear Client,
Please note that the dividends of the following products will be adjusted accordingly. Index dividends will be executed separately through a balance statement directly to your trading account, and the comment will be in the following format “Div & Product Name & Net Volume”.
Please refer to the table below for more details:
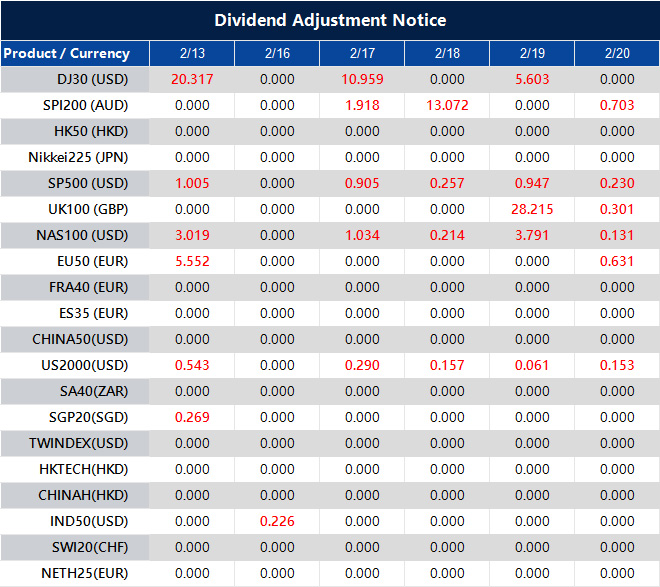
The above data is for reference only, please refer to the MT4/MT5 software for specific data.
If you’d like more information, please don’t hesitate to contact [email protected].


