USD/CAD rises for a third day, nearing the 1.3600s as the dollar strengthens ahead of US CPI
USD/CAD rose for a third day and hit a four-day high near 1.3630 in early European trading. The move followed a rebound from 1.3500 and came as the US dollar edged higher.
The US dollar stayed slightly stronger after Wednesday’s Nonfarm Payrolls report lowered expectations for a Federal Reserve rate cut in March. Lower crude oil prices also weighed on the Canadian dollar, lifting USD/CAD ahead of US consumer inflation data.
Nordea analysts say US strength has peaked, investors are overweight US assets, and a weaker dollar is lifting the euro
Nordea analysts say the recent period of strong US economic performance may have reached its high point. They also say foreign investors are still heavily invested in US assets. That combination could weaken the US dollar further, which would support the euro and push EUR/USD higher over time.
They add that even after a sharp drop over the past year, the US dollar is not weak by historical standards. They also note that low term premiums suggest foreign investors have not fully reduced their US exposure.
Foreign Allocation And Dollar Rebalancing
They give a simple rebalancing example. If foreign investors cut their allocation to US assets from 50% to 40% while the US still runs a current-account deficit, foreigners cannot all sell those assets to US buyers. They say the adjustment would require a roughly 20% fall in the relative value of US assets. They argue that part of the dollar’s strength over the past two decades came from weaker conditions in Europe after the European debt crisis. They point to austerity and small deficits as key factors. They say this could change as Europe increases spending on defence and infrastructure. They add that higher investment can lift growth. With unemployment already low, it could also increase inflation pressure and push interest rates higher. They say this would make the euro more attractive as an alternative to the US dollar. Based on recent data, we believe the long-running trend of US economic outperformance is likely ending. January’s US advance GDP estimate showed growth slowing to 1.5%. At the same time, Eurozone flash PMI surprised to the upside at 51.5. That points to a real shift in momentum. Traders should consider positioning for a continued rise in EUR/USD, as the economic backdrop is now improving faster in Europe.Positioning For A Stronger Euro
Even after the dollar’s notable decline through 2025, it is still strong by historical standards. That leaves room for more downside. US Treasury data for December 2025 showed a fourth straight month of net foreign selling of US assets. This supports the view that global investors are reducing an overweight position. This kind of structural shift supports strategies such as longer-dated EUR/USD call options aimed at a multi-month move. The story of European weakness that shaped the past decade is also changing. New joint investment in defence and energy infrastructure, accelerated by developments in the past two years, is starting to support growth and tighten labour markets. This can make inflation more persistent and could keep the European Central Bank more hawkish than the Federal Reserve. In this framework, reducing exposure to US assets can happen only if those assets fall in relative value, which implies a weaker dollar. Markets showed a version of this last year: the Dollar Index (DXY) fell nearly 9% in 2025 even though the US still ran a current-account deficit. The easier path for the pair still looks higher, which makes strategies like EUR/USD bull call spreads a cost-effective way to position for more upside in the weeks ahead. Create your live VT Markets account and start trading now.Wynn Resorts posts Q4 revenue of $1.87bn, up 1.5% year on year, as EPS falls to $1.17
Wynn Resorts reported revenue of $1.87 billion for the quarter ended December 2025, up 1.5% year over year. Earnings per share (EPS) were $1.17, down from $2.42 a year earlier.
Revenue came in 0.67% above the Zacks Consensus Estimate of $1.85 billion. EPS was 12.17% below the consensus estimate of $1.33.
Las Vegas table drop was $667.57 million versus an estimate of $671.2 million. Table games win was $173.84 million versus $161.94 million, and slot machine win was $129.52 million versus $131.97 million.
Macau VIP table games win at Wynn Palace was $148.5 million versus $160.01 million. Wynn Macau operating revenue was $371.33 million versus $370 million, up 2.1% year over year, while Wynn Palace was $596.36 million versus $614.32 million, up 5.9%.
Encore Boston Harbor operating revenue was $210.19 million versus $210.69 million, down 1.2% year over year. Las Vegas operating revenue was $688.11 million versus $667.42 million, down 1.6% year over year.
Las Vegas casino revenue was $178.28 million versus $177.77 million, down 6.2%, while Encore Boston Harbor casino revenue was $152.02 million versus $156.78 million, down 3.1%. Las Vegas rooms revenue was $222.92 million versus $221.8 million, down 2.5%, and food and beverage was $191.71 million versus $182.13 million, up 3.8%.
The biggest takeaway is the EPS miss. It suggests profit pressure even though revenue rose slightly. The -12.17% EPS surprise will likely outweigh the small revenue beat in the weeks ahead. We believe this could put downward pressure on the stock price.
The U.S. business shows warning signs. Operating revenue fell year over year in both Las Vegas and Boston. This matches recent Las Vegas Convention and Visitors Authority data showing visitor growth stalled in the final quarter of 2025, ending a multi-year recovery trend. The drop in casino revenue is especially concerning for the core U.S. business.
Macau delivered top-line growth, but the details suggest weaker momentum. Wynn Palace revenue missed estimates, and the VIP segment also fell short. VIP play is a key, high-margin driver. Adding to this, January 2026 data from Macau’s Gaming Inspection and Coordination Bureau showed city-wide gaming revenue rose only 4.5%. That missed the 6% consensus forecast, driven by a softer-than-expected start to the Lunar New Year holiday period.
With profit pressure and softer trends in both the U.S. and Macau, we are positioning for downside, or at least limited upside. Derivative traders may want strategies that benefit if the stock falls, such as buying put options or using bear call spreads. These trades can also help hedge against a decline over the next several weeks.
This setup looks similar to mid-2025, when another earnings report showed slowing growth and the stock fell more than 8% in two weeks. In addition, recent Federal Reserve comments point to slower U.S. discretionary spending through 2026. That adds a broader headwind and supports the risk that luxury and travel stocks like Wynn could lag.
Silver trades near $76.60 in Europe after an 11.5% rebound, but still heads for a third straight weekly drop
Silver rose to about $76.60 per troy ounce in early European trading on Friday, after dropping 11.5% in the previous session. Even with the rebound, it was on track for a third straight weekly decline as volatility stayed high.
Thursday’s selloff had no clear single cause. But losses in stocks and cryptocurrencies pointed to broad, forced selling across markets. Systematic and algorithm-driven trading flows may also have amplified the move.
Inflation Data And Fed Expectations
Markets are watching upcoming US inflation data for clues on Federal Reserve policy. Headline CPI is expected at 2.5% (down from 2.7%), while core CPI is seen at 2.5% (down from 2.6%). The CME FedWatch tool showed nearly a 92% chance the Fed would keep rates unchanged in March, up from 82% a week earlier. Markets were also pricing in about two 25-basis-point rate cuts by year-end, with the first cut expected in June. Safe-haven demand eased after Donald Trump said talks with Iran could continue for up to a month. That lowered near-term fears of military action, as the US signaled it would keep pursuing a diplomatic path on Iran’s nuclear programme. At this point in 2025, silver was extremely volatile. Prices bounced back to around $76.50 after a sharp, unexplained 11.5% plunge. That fall was part of a broader market-wide liquidation. It also showed how systematic trading flows can overwhelm fundamentals without warning. With no clear catalyst, uncertainty for traders was high.Positioning And Strategy For 2026
In February 2025, markets were betting that cooling inflation would let the Fed start cutting rates, with the first move expected in June. But core CPI stayed above 2.8% through Q3 2025. The Fed then kept rates steady much longer than investors expected, which limited silver’s upside for most of the year. As a result, silver spent much of 2025 trading in a range. A stronger dollar—driven by the Fed’s more hawkish stance—kept pressure on the metal. Industrial demand helped set a floor, especially demand from the solar sector, where silver use rose about 5% year over year. Geopolitical tension with Iran briefly supported prices, but the situation cooled and did not provide lasting support. Now the setup looks clearer than the chaotic backdrop of last year. January 2026 CPI fell to a two-year low of 2.4%, and the Fed has signaled a more defined path toward easing. CME FedWatch pricing now shows a 75% chance of a first rate cut by May 2026. This shift suggests investors may want to position for potential upside in silver, since lower interest rates reduce the opportunity cost of holding a non-yielding asset. Unlike last year’s forced liquidations, today’s volatility may be more directional. Building exposure through long call options or bull call spreads could be a sensible way to target gains while limiting risk. Industrial demand also remains a strong tailwind. Global manufacturing PMI data for January 2026 showed expansion for a third straight month, supported by green energy initiatives. This demand backdrop may help support prices and reduce downside risk for bullish derivative strategies in the weeks ahead. Create your live VT Markets account and start trading now.Dividend Adjustment Notice – Feb 13 ,2026
Dear Client,
Please note that the dividends of the following products will be adjusted accordingly. Index dividends will be executed separately through a balance statement directly to your trading account, and the comment will be in the following format “Div & Product Name & Net Volume”.
Please refer to the table below for more details:
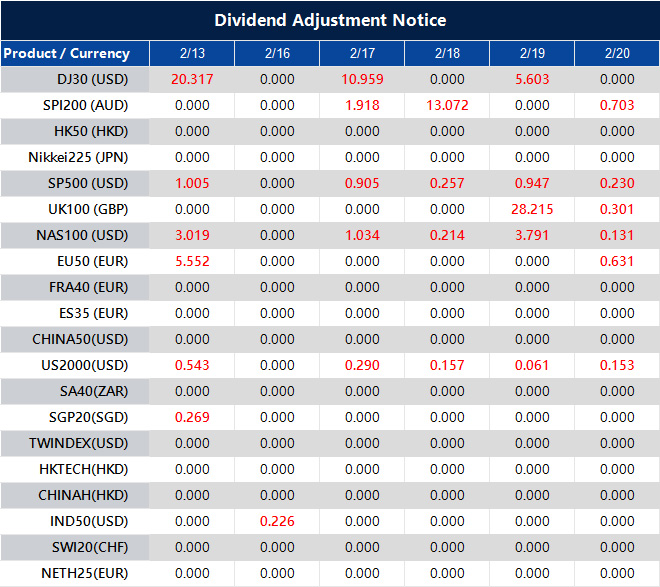
The above data is for reference only, please refer to the MT4/MT5 software for specific data.
If you’d like more information, please don’t hesitate to contact [email protected].
Commerzbank expects February composite PMI to reach 51.5, lifting the euro as manufacturing recovers and the ECB remains supportive
Commerzbank expects the Eurozone composite PMI to rise to 51.5 in February, helped by stronger manufacturing sentiment. It is keeping its 0.9% growth forecast for 2026.
The bank expects the industrial PMI to rise to 50 in February. It links this to easier policy, higher German government spending, a small increase in household spending, and a smaller-than-expected hit from US tariffs.
Eurozone Growth Outlook
It expects the ECB to keep key interest rates unchanged for the rest of the year. It also says a rate cut is more likely than a rate rise, because core inflation is moving below 2%. The article says it was created with an AI tool and reviewed by an editor. With next week’s Eurozone PMI data due, we expect the composite index to rise to about 51.5. A move above 50 would point to a return to modest growth. The main driver is a better outlook for manufacturing. This rise matters because GDP growth was mostly flat in the final quarter of 2025. Data from January 2026 showed an unexpected rebound in German factory orders. That supports the view that industrial sentiment is improving. It also follows worries in the second half of 2025 about the effects of US tariffs.Market Strategy Implications
The European Central Bank is expected to keep key interest rates steady for the near future. That should help stabilize markets. With January core inflation at 1.8%, below target, the next move is more likely a rate cut than a hike. This setup may limit large Euro gains, which could make range-trading strategies more appealing. For stocks, gentle growth and a steady central bank are generally supportive. Traders may look at call options on major European indices. Implied volatility is low, which can make these options cheaper. This would mark a shift from the more defensive stance seen through much of 2025. With a predictable central bank and a slow, steady recovery, overall volatility may trend lower. That environment can favor selling options premium on the Euro or equity indices. These strategies rely on the idea that price swings will stay limited in the coming weeks. Create your live VT Markets account and start trading now.Lloyd Chan says the dollar held steady after strong payrolls, while CPI shapes expectations for rate repricing
The US Dollar stayed firm after a stronger-than-expected US nonfarm payrolls report, but it failed to keep rising. Markets questioned how much further investors can reprice US interest rates in a more hawkish direction.
Focus has now shifted to the US CPI release, which traders see as the next key driver for rates and FX markets. MUFG’s US strategist expects January core CPI at 0.25% month-on-month and 2.6% year-on-year, while Bloomberg consensus looks for 2.5% year-on-year for both headline and core CPI.
Dollar Focus Turns To CPI
If CPI prints above expectations, it could trigger more hawkish repricing of the Federal Reserve’s rate path and support the Dollar. If CPI meets consensus or comes in softer, markets may stick with expectations for around two Fed rate cuts this year, which would limit Dollar gains. The article says it was produced with help from an artificial intelligence tool and reviewed by an editor. We are in a familiar spot, similar to this time in 2025: the dollar is steady, but it lacks a clear direction. The January CPI data is now the main event, and markets are looking to it for a catalyst. This report will be important in shaping expectations for the Federal Reserve’s next step after it paused its rate-cutting cycle. As with the strong jobs report we discussed in early 2025, January’s solid gain of 195,000 nonfarm payrolls has supported the dollar but has not sparked a big rally. One reason is that core inflation has remained sticky. The Fed’s preferred PCE measure averaged 2.8% in the final quarter of last year. Because of this, the market doubts the central bank can turn much more hawkish from here.Options Markets Brace For CPI
For derivatives traders, this backdrop points to a focus on volatility ahead of the CPI release. A core CPI reading above the expected 0.3% month-over-month could lead to a sharp repricing. That could make long dollar call options, or short positions in EUR/USD puts, more appealing. It would also put the currently priced-in 50% chance of a June rate cut under pressure. On the other hand, a CPI reading that is in line with expectations or softer would support the market’s view that the Fed is still on track to begin easing by mid-year. In that case, implied volatility in currency options could fall, which would favor option-selling strategies such as strangles. The dollar’s upside would likely stay limited as attention shifts back to a slowing growth outlook. Create your live VT Markets account and start trading now.UOB says gold and other metals sold off sharply as AI fears, algorithmic trading and profit-taking followed rallies
Gold and other precious metals dropped sharply as wider markets turned risk-off due to concerns about AI. Heavy trading activity, including algorithmic trading, likely added to the speed of the fall.
Bullion fell as much as 4.1%, while silver dropped 11%. Copper on the London Metal Exchange fell 2.9%.
Precious Metals Selloff Accelerates
By the New York close, spot gold was down 3.2% to USD4,920.37/oz and silver was down 11% to USD75.15/oz. Platinum and palladium also declined, and copper on the LME slipped 2.2%. The report also pointed to profit-taking after a strong rally in precious metals. It notes the article was produced with the help of an AI tool and reviewed by an editor. Gold is seeing a fast, steep selloff, driven by broad fear about the future of Artificial Intelligence. The CBOE Volatility Index (VIX), a key gauge of market fear, jumped more than 45% in the past 24 hours to 32.5. That is the highest level since the market stress in late 2024. This type of panic can trigger automated programs to sell across many assets, which helps explain the sudden drop. For derivatives traders, this surge in volatility makes options very expensive. One near-term idea is to sell premium to benefit from elevated fear. However, this is high risk if the selloff continues. Watch implied volatility in gold options. If it starts to ease, it may signal the worst of the panic is passing.Gold Silver Ratio Signals Risk Off
Silver falling 11% while gold fell about 4% is an important signal. It pushed the gold-to-silver ratio above 65. That suggests traders are selling industrial and speculative assets faster than safe havens. This is typical risk-off behavior. Because silver is tied more closely to industry, it often falls harder when traders fear slower growth. A similar, but smaller, profit-taking move happened in summer 2025 after a long rally, followed by a consolidation period. This move looks like a larger washout of long positions built during the recent run toward $5,000. Traders should now watch whether gold can hold support near $4,800, a key level of activity last month. Create your live VT Markets account and start trading now.Oversupply worries prompt sellers, leaving WTI crude near $62.50 in early European trading
WTI, the US crude oil benchmark, traded near $62.50 in early European trading on Friday. Prices came under pressure as oversupply worries continued.
In its monthly report on Thursday, the IEA said global oil demand growth this year is likely to be weaker than it previously expected. It also forecast that total supply will be higher than demand.
Us Inventory Data Adds Pressure
US inventory data added to the downside. The EIA said US crude stockpiles rose by 8.53 million barrels in the week ending 6 February. This followed a 3.455 million barrel drop the week before. Geopolitical news offered some support. The Wall Street Journal reported on Wednesday that the US is considering seizing tankers carrying Iranian crude. It also said the US may send a second aircraft carrier strike group to the Middle East if nuclear talks with Iran fail. Traders are watching US-Iran relations for clues on what comes next. This focus could keep price swings elevated. In early 2025, WTI traded around $62.50 during a similar tug-of-war between weak supply and demand and rising geopolitical risk. That conflict is even stronger today. The market is still struggling to find a clear direction, and the same forces remain in focus for traders.Persistent Oversupply Versus Geopolitical Risk
Oversupply concerns have stayed in place and continue to weigh on oil prices. The IEA’s January 2026 report kept the same message, forecasting that global supply will exceed demand growth for a third straight quarter. US crude inventories have also risen in four of the last six weeks. The latest EIA report showed a 4.2 million barrel build, which has added pressure. At the same time, the Iran-related geopolitical risk premium remains strong and is helping limit further declines. The collapse of talks in Vienna last month has kept markets nervous. That raises the chance of shipping disruptions in the Middle East. This risk is a key reason why prices have not fallen more sharply, despite heavy supply. In this setting, a volatility approach may make more sense than a simple bullish or bearish bet. Implied volatility on WTI options has risen to nearly 40%, up from an average of 32% in the last quarter of 2025. That suggests the market expects a large move. Strategies such as long straddles or strangles may work well because they aim to profit from a big price move in either direction. For traders who are bearish because of the supply data, buying puts is a direct way to position for a drop. But geopolitics can move fast. One way to reduce cost is to fund those puts by selling out-of-the-money calls. This creates a risk-reversal or collar structure and helps protect against a sudden spike if Middle East tensions rise. Create your live VT Markets account and start trading now.Compiled data show that gold prices in the Philippines rose as bullion increased in Friday’s trading session
Gold prices in the Philippines rose on Friday, based on FXStreet data. Gold was priced at PHP 9,306.92 per gram, up from PHP 9,160.19 on Thursday.
Gold rose to PHP 108,554.30 per tola from PHP 106,842.70 a day earlier. Other listed prices were PHP 93,069.37 for 10 grams and PHP 289,476.60 per troy ounce.


