WTI trades near $64.80, slipping below $65 after earlier gains as US crude inventories rose last week
WTI slipped on Thursday after gaining more than 1% in the prior session. It traded near $64.80 during Asian hours. Prices came under pressure after EIA data showed US crude inventories rose by 8.53 million barrels last week.
Total crude stockpiles climbed to 428.8 million barrels, about 3% below the five-year average for this time of year. Prices found some support from rising US–Iran tensions and plans for more talks, although the time and location have not been confirmed.
The US President said a second aircraft carrier could be sent to the Middle East if no agreement with Iran is reached. The comments came as Washington and Tehran prepare to resume discussions.
US labour data showed Nonfarm Payrolls increased by 130,000 in January, following a revised 48,000 gain in December. This beat the 70,000 forecast. The Unemployment Rate edged down to 4.3% from 4.4%.
OPEC kept its demand growth forecasts unchanged: 1.38 million bpd for 2026 and 1.34 million bpd for 2027. It also left its view on non-OPEC supply unchanged. The IEA will publish its monthly report later today, which may indicate a global surplus.
WTI is hovering around $85 a barrel, as the market weighs mixed supply and demand signals. This looks a lot like early 2025, when prices were stuck near $65. The latest EIA report added pressure after it showed an unexpected 4.2 million barrel rise in US crude inventories last week.
In 2025, a much larger 8.53 million barrel build triggered a similar pullback, pointing to strong short-term supply. When inventories rise like this, traders may look at short-dated put options to benefit from near-term weakness. A comparable run of inventory builds also came before the price correction in Q4 2023.
Even so, we think major downside may be limited by today’s geopolitical risk premium. That was also true in 2025, when US–Iran tensions helped support prices. New reports of friction in the Strait of Hormuz are a reminder that any disruption could quickly push prices higher. Because of this risk, holding some long call options can be a sensible hedge against a sudden spike.
Demand also appears steady, which should help put a floor under prices, similar to what we saw a year ago. The January 2026 jobs report showed Nonfarm Payrolls rose by 195,000, while the unemployment rate held at a low 3.9%. A strong labour market supports demand for transport fuels and suggests consumption is holding up.
We are also watching the major agency reports for clearer direction, as we did last year. OPEC’s latest monthly report kept its 2026 demand growth forecast at 1.2 million bpd, pointing to solid economic activity in Asia. The IEA is set to release its outlook tomorrow, and markets expect it to again warn of a possible global surplus due to rising non-OPEC supply.
Silver pulls back toward $82.00 in Asian trade; 38.2% Fibonacci support guides the next move after earlier gains
Silver (XAG/USD) fell in Thursday’s Asian session, easing back from Wednesday’s weekly high near $86.30. It is trading in the mid-$82.00s, down more than 2.5% on the day, and is still moving within the range seen since the start of the week.
The price recently failed near the 38.2% Fibonacci retracement of the decline from the all-time high and then turned lower. The MACD remains above the Signal line and above zero, but the gap is narrowing as the histogram shrinks. The RSI is at 50.89, which also points to a neutral, range-bound market.
On the 4-hour chart, the 200-period SMA is rising near $87.42, but price is still trading below it. The 38.2% retracement at $85.87 is the first key resistance level. If price breaks above it, the next upside target is the 50% retracement at $92.59.
If resistance holds, price could drift down toward the 23.6% retracement at $77.56. A sustained move above the 200-period SMA would strengthen the technical outlook.
Based on silver’s recent price action, the market appears to be consolidating around $82.00. The failure to push through $85.87 shows hesitation and leaves a clear trading range that options traders can use over the next few weeks.
For traders looking for an upside move, the key signal is a clean, sustained break above $85.87. One possible approach is to buy call options with strikes just above this level (for example, $86 or $87) to benefit from a potential move toward $92.59. This provides upside exposure while keeping risk limited to the premium paid.
At the same time, weakening upside momentum in the indicators may support bearish setups. If price stays capped below the 200-period moving average, traders could consider buying put options or using bear put spreads. These positions would gain if price drops back toward the $77.56 support area.
Looking back from today’s viewpoint in February 2026, the hesitation seen in 2025 makes sense given the economic data at the time. The backdrop is different now. Recent government data shows manufacturing output rose 4.2% last quarter, which supports silver’s industrial demand. That strength suggests that similar pullbacks today may attract buyers sooner than they did then.
History also shows that when industrial demand for silver is strong, technical support levels tend to hold more reliably. For example, during the 2022–2023 manufacturing expansion, silver rarely stayed below its 200-day moving average for long. This supports the case for selling cash-secured puts during deeper pullbacks in the current environment.
In addition, the latest Commitment of Traders report shows large speculators increased net-long silver futures positions by 12% over the past month. That is a clear shift from the mostly neutral positioning seen through much of 2025. This improvement in institutional sentiment could help silver break through resistance levels that previously held.
USD/CAD rises toward 1.3580 in Asia as strong US jobs data boosts the US dollar
USD/CAD edged up to around 1.3580 in Asian trading on Thursday. The US Dollar strengthened against the Canadian Dollar after US jobs data beat expectations. Markets now turn to Friday’s US CPI inflation report.
In January, the US economy added 130,000 jobs versus a 70,000 forecast. The unemployment rate dipped to 4.3% from 4.4%. These results lowered expectations for another Federal Reserve rate cut by mid-year, which supported the US Dollar.
Us Cpi In Focus
Friday’s CPI report is expected to show headline and core inflation at 2.5% year on year in January. Both are also forecast to rise 0.3% month on month. A softer print could pressure the US Dollar. Geopolitical risk could push oil prices higher. That often supports the Canadian Dollar because Canada is a major oil exporter. The Canadian Dollar is also sensitive to Bank of Canada policy, inflation, domestic growth data, and the trade balance. The Bank of Canada targets inflation within 1–3% and adjusts interest rates to manage prices. It can also use quantitative easing or tightening. Oil price changes can shift the trade balance, while data like GDP, PMIs, jobs, and sentiment can change expectations for growth and policy. With USD/CAD holding near 1.3580, the key near-term catalyst is tomorrow’s US CPI report. The strong January jobs report has already pushed markets toward a more hawkish Fed outlook. Still, October 2025 CPI surprised to the downside and triggered a sharp reversal. With consensus calling for 2.5% annual inflation, strategies that benefit from a large move either way—such as a long straddle—may be worth considering ahead of the release.Policy Divergence And Positioning
Policy divergence between the US and Canada remains a central trading theme. The gap between US and Canadian 2-year yields has widened to more than 50 basis points. This favors the US Dollar as investors chase higher returns. Using futures to keep a core long USD/CAD position may make sense, since the Fed appears firmer than the Bank of Canada, which is still dealing with softer Canadian growth data from late 2025. Oil prices also need close monitoring because crude is a major driver of the Canadian Dollar. WTI has been trying to break above $85 per barrel on renewed Middle East supply concerns. That could limit further USD/CAD gains. Traders who are long USD/CAD may want to hedge by buying out-of-the-money put options, in case a sudden jump in oil strengthens the loonie. Volatility spikes in 2025 show how data surprises can drive large intraday swings. Implied volatility for USD/CAD weekly options has risen ahead of Friday’s CPI, suggesting the market expects a move. This can make selling far out-of-the-money options appealing for premium income, but it is best suited to traders with a high risk tolerance. Over the longer term, the stronger US economy relative to Canada points to a structurally higher USD/CAD. US GDP growth for Q4 2025 was a solid 2.9%, well above Canada’s 1.1%. Longer-dated call options can express this bullish view while limiting upfront capital. Create your live VT Markets account and start trading now.China’s central bank fixed USD/CNY at 6.9457, up from 6.9438 and above Reuters’ 6.9153 forecast
The People’s Bank of China (PBOC) set the USD/CNY central rate for Thursday at 6.9457.
This compares with the previous day’s fix of 6.9438 and a Reuters estimate of 6.9153.
Policy Signal From The Fix
The People’s Bank of China sent a clear signal with this much weaker-than-expected fixing. It suggests officials are willing—perhaps even eager—to allow a weaker yuan to support the economy. The key point today is the large gap versus the market estimate. This move also fits with recent weak data. The Caixin Manufacturing PMI for January slipped to 49.8, which points to a mild contraction. Export growth data from late 2025 also surprised to the downside, falling 1.2% year over year. A weaker currency can help by making exports cheaper and more competitive globally. The wide interest rate gap between the US and China is adding more pressure. US 10-year Treasury yields are holding near 4.2%, while China’s 10-year government bond yields are around 2.5%. That difference encourages money to flow toward the higher-yielding dollar. This backdrop supports further upside in USD/CNY. For derivatives traders, this unexpected guidance likely means higher implied volatility in the weeks ahead. Option premiums may rise as uncertainty grows around how fast the yuan could weaken. Volatility strategies like long straddles may benefit, although the market bias remains toward a weaker yuan. It is also worth remembering the turbulence after the surprise devaluation in 2015, which was followed by a long period of yuan weakness. Today’s move is more controlled, but it may still mark a policy shift that could lead to a similar trend at a slower pace. Because of that history, it is hard to treat this as a one-off.Trade Positioning And Options Skew
As a result, positioning should lean toward further yuan weakness versus the dollar. One approach is to buy USD/CNY call options or call spreads to target a move toward 7.00. Risk reversals will be important to watch, as they may show strong demand for USD calls and confirm the market’s bearish view on CNY. Create your live VT Markets account and start trading now.EUR/USD trades sideways below 1.1900 as contrasting Fed and ECB outlooks support it during the Asian session
EUR/USD could not extend its overnight rebound from 1.1835–1.1830. It traded in a tight range in Asia on Thursday. The pair was near 1.1875, little changed on the day, and close to the one-week high set on Tuesday.
After Wednesday’s strong US Nonfarm Payrolls report, markets scaled back expectations for faster Federal Reserve easing. Comments from Kansas City Fed President Jeffrey Schmid also supported the dollar. He warned that more rate cuts could keep inflation higher for longer. This helped the US dollar hold above a nearly two-week low and kept pressure on EUR/USD.
Fed Cuts And Dollar Support
Markets still expect at least two 25 bps Fed cuts in 2026. However, worries about the Fed’s independence and a broadly positive risk mood reduced demand for the safe-haven dollar. The euro is supported by expectations that the European Central Bank will keep rates unchanged for the rest of the year. There is no major Eurozone data due on Thursday. US Weekly Initial Jobless Claims are due later. Focus then shifts to Friday’s US consumer inflation data. These figures are likely to shape expectations for the Fed’s rate path and drive the next move in EUR/USD. EUR/USD remains stuck in a range, and we see little reason to take a strong directional view before tomorrow’s US inflation report. Yesterday’s strong jobs report, which showed 280,000 new jobs in January, gives the Fed room to stay cautious. That is why the dollar is finding support and keeping the pair below 1.1900.Trading Plans Around CPI
The key tension is that markets are pricing in two Fed cuts this year, while Fed officials still sound reluctant. This caution is understandable. Inflation stayed stubborn through much of 2025, with the annual rate averaging about 3.7%. That makes tomorrow’s inflation report critical to confirm whether disinflation is continuing. On the other side, the ECB appears firmly on hold, which supports the euro. Eurozone inflation was 2.9% in January, still too high to justify rate cuts. This policy gap is helping prevent a sharp drop in EUR/USD. With the pair range-bound, we should consider options strategies that can benefit from a large post-data move. Buying a strangle, for example, positions us to benefit from a volatility spike in either direction. This is a sensible approach ahead of a major data release. If tomorrow’s inflation is hotter than expected, we should be ready to buy EUR/USD puts. That would likely push back rate-cut expectations and strengthen the dollar. If inflation is softer, it would support the case for cuts, making EUR/USD calls more attractive. The market will likely react quickly to any surprise versus the expected 0.3% monthly rise. Over the next few weeks, we should be prepared for the 1.1830–1.1900 range to break. Inflation data will likely set the tone by confirming or challenging the market’s view on two cuts. We will use the market’s reaction to set a new directional bias for the rest of the quarter. Create your live VT Markets account and start trading now.Japan’s top currency diplomat, Mimura, says officials are closely monitoring exchange rates amid renewed yen volatility and growing urgency
Atsushi Mimura, Japan’s Vice Finance Minister for International Affairs and the country’s top foreign exchange official, said authorities are watching currency moves very closely. He said Japan is staying alert as the yen becomes volatile again.
Mimura did not comment on any specific exchange-rate levels. He also said Tokyo is in close contact with US authorities.
Market Warning Signals
At the time of writing, USD/JPY was trading near 153.24. The pair was up 0.02% on the day. Officials are clearly unhappy with the yen’s weakness as USD/JPY trades above 153. This kind of verbal warning is usually the first step. It is meant to make traders think twice before pushing the pair much higher. It also hints that policymakers may have an informal “line” near current levels. This looks similar to what happened in 2024. Back then, authorities spent more than 9 trillion yen in April and May to support the currency after USD/JPY moved above 160. That shows two things: their tolerance for yen weakness can be high, but they are also willing to act fast when needed. For derivatives traders, this urgency means more uncertainty—and that shows up in higher implied volatility. One-month implied volatility for USD/JPY has jumped to 9.5%, up from around 7% last month. In plain terms, the market is expecting a higher chance of sudden, sharp moves. That also makes options more expensive to buy.Rates Differential Still Dominates
Downside protection is likely to get pricier. In particular, USD/JPY put options may rise in cost relative to calls. This means traders are paying more to protect against a quick drop caused by intervention. As a result, strategies such as selling call spreads to help pay for put options may look more attractive as costs rise. Even so, intervention threats are pushing against strong fundamentals. The Bank of Japan’s policy rate is near 0.1%, while the U.S. Federal Reserve keeps rates above 3.5%. That wide gap still encourages traders to sell the low-yielding yen. Any official action would be fighting this large interest-rate difference. Create your live VT Markets account and start trading now.Gold edges above $5,050 as US-Iran tensions linger despite strong jobs data, with markets awaiting the CPI release
Gold traded slightly higher near $5,060 in early Asian trading on Thursday, holding above $5,050. It rose even after strong US jobs data. Traders are now focused on Friday’s US CPI inflation report.
Safe-haven demand supported gold as tensions between the US and Iran continued. Donald Trump said he wants talks with Iran to continue after meeting Benjamin Netanyahu. He also warned he may act against Tehran if no nuclear deal is reached.
Gold Market Caught Between Safe Haven Demand And Dollar Strength
US Nonfarm Payrolls rose by 130,000 in January, above the 70,000 forecast. December payrolls were 48,000 after a small downward revision. The unemployment rate fell to 4.3% from 4.4%, while markets had expected it to stay at 4.4%. Kansas City Fed President Jeff Schmid said rates may need to stay restrictive to bring inflation down. He added that he is not seeing much slowdown in the data. Markets are watching Friday’s CPI release. Headline and core CPI are both expected to be 2.5% year on year in January. Gold is being pulled in two directions. Ongoing US-Iran tensions are keeping safe-haven demand strong and helping support prices. At the same time, a stronger US dollar—backed by firm labour data—is weighing on gold. This push and pull could lead to higher volatility, especially with CPI due on Friday. Some traders may prefer options strategies that benefit from a big move, such as a straddle. In this setup, positioning for movement may matter more than picking a direction.Inflation Print Could Drive Next Big Move
Inflation has been hard to control in recent years, and surprise readings have often forced the Fed to stay tighter than markets expected. In the real world, the December 2023 CPI report showed core inflation at 3.9%, a reminder of how stubborn price pressures can be. If Friday’s CPI comes in above the 2.5% forecast, it would support the Fed’s restrictive stance and could push gold sharply lower. However, the geopolitical premium keeping gold above $5,000 is also important. History shows that during periods of rising global tension, safe-haven buying can outweigh economic data. For example, during the early stages of the Russia-Ukraine conflict in 2022, gold rallied more than 10% in just a few weeks. If US-Iran talks break down, headlines could quickly become the main driver and lift gold further, even if US data stays strong. The strong jobs report—130,000 new payrolls versus 70,000 expected—also gives the Federal Reserve more reason to keep rates high. Recent Fed comments support that view, noting limited signs of slowing. This environment can cap gains for a non-yielding asset like gold, even if inflation cools. For now, the key risk is Friday’s CPI report. After that, traders will need to weigh the inflation trend against changes in the geopolitical situation. A flexible approach—able to switch from trading data to trading headlines—will likely be essential. Create your live VT Markets account and start trading now.In January, the UK’s RICS house price balance beat forecasts, reaching -10% versus -11% expected
The Royal Institution of Chartered Surveyors (RICS) UK house price balance for January was **-10%**. This was slightly better than expectations of **-11%**.
A negative balance means more survey respondents reported house prices **falling** than **rising**. The figure is still within the forecast range.
Uk Housing Downturn Shows Signs Of Stabilizing
January’s housing data is still negative, but it suggests the UK property downturn is starting to lose pace. The **-10%** reading is a clear improvement versus expectations and may signal that the worst of the price correction seen through 2025 is now behind us. That lowers the risk of a major economic shock coming from housing. This is supportive for the British Pound. If the housing market is holding up, the Bank of England has less pressure to deliver large rate cuts. With inflation still sticky and ending last year at **2.9%**, this report gives the BoE more room to keep rates on hold. One approach could be buying **GBP call options** versus currencies where central banks look more dovish. Rate markets may also be pricing the timing and size of future cuts too aggressively. The sharp hiking cycle of 2023–2024 is over, but a steadier housing market points to a slower, more cautious easing path. Selling **short-term interest rate futures** could be one way to position for the BoE staying cautious longer than markets expect. There may also be opportunities in UK equity derivatives, especially those linked to domestic sectors such as **housebuilders** and **banks**. This upside surprise, along with Bank of England data showing **mortgage approvals rising for three straight months**, could help re-rate the sector. In the coming weeks, it may be worth considering **call options on a home construction ETF** or exposure to the more UK-focused **FTSE 250** via futures or options.Potential Positioning Across Rates Fx And Equities
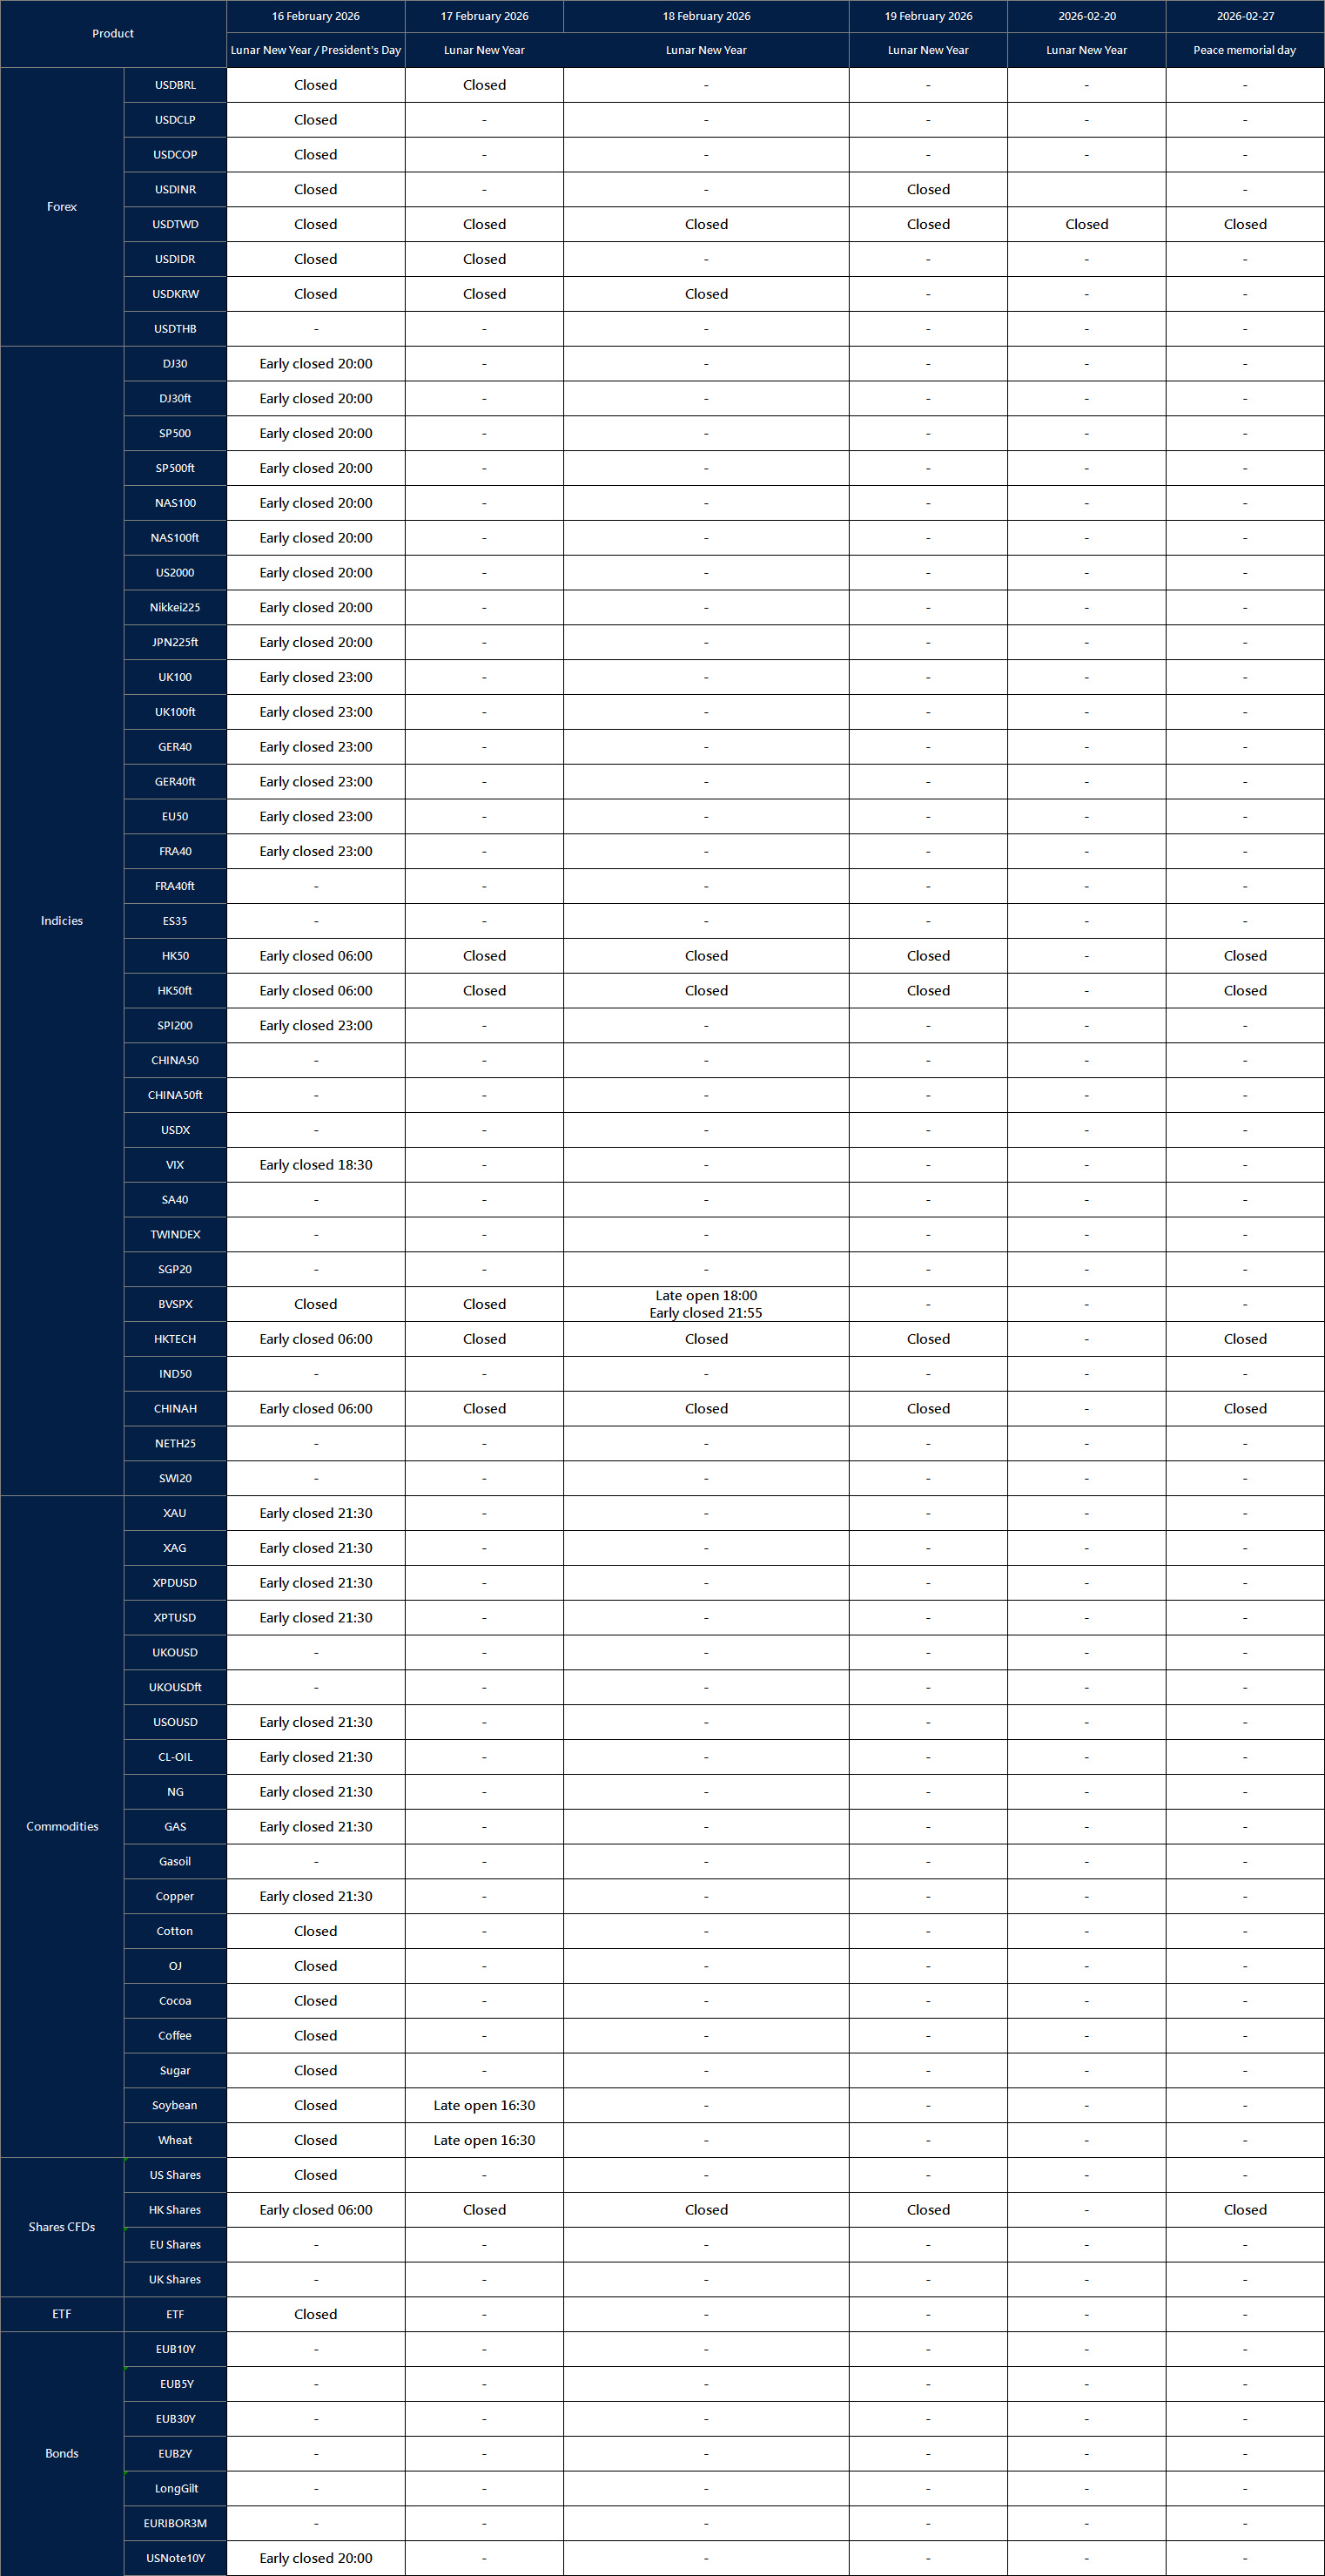
Create your live VT Markets account and start trading now.Holiday Trading Adjustment Notice – Feb 12 ,2026
Dear Client,
Affected by international holidays, the trading hours of some VT Markets products will be adjusted. Please check the following link for the affected products:
Holiday Trading Adjustment Notice
Note: The dash sign (-) indicates normal trading hours.
Friendly Reminder:
The above data is for reference only, please refer to the MT4/MT5 software for specific data.
If you’d like more information, please don’t hesitate to contact [email protected].
Before the session, sterling pulled back from multi-year highs amid a dovish BoE stance and UK political uncertainty
Sterling slipped slightly on Wednesday after hitting four-year highs. The move came as the Bank of England (BoE) sounded more dovish and UK politics added uncertainty. The BoE held rates, but the Monetary Policy Committee (MPC) vote split 5-4, with four members calling for an immediate 25 basis point cut.
The BoE said inflation could reach 2% sooner than expected. Markets are now pricing in 50 basis points of rate cuts in 2026. UK politics also drew attention after Anas Sarwar called on Prime Minister Keir Starmer to resign over the Peter Mandelson scandal, although later support from the cabinet helped calm the situation.
Thursday brings the UK’s preliminary GDP data for Q4 2025. Consensus expects 0.2% quarter-on-quarter (up from 0.1% in Q3) and 1.2% year-on-year (down from 1.3%). December industrial and manufacturing production figures are also due. These releases follow the BoE’s decision to cut its 2026 GDP forecast to 0.9% from 1.2%.
On Friday, MPC member Pill is scheduled to speak, and the delayed US January CPI report is due. Headline inflation is expected at 2.5% year-on-year, with core inflation seen at 0.3% month-on-month. GBP/USD traded at 1.3627, down 0.12%, below 1.3869 but above the 50-day EMA (1.3516) and 200-day EMA (1.3312).
Support is seen at 1.3585 to 1.3620, then 1.3516 and 1.3380 to 1.3400. Resistance is at 1.3735 and 1.3869. The Stochastic Oscillator (14, 5, 5) read 47.10/52.91.
The latest BoE meeting has created real uncertainty. The 5-4 vote, with four members pushing for an immediate cut, signals a clear dovish shift. That shift is now weighing on Sterling. This makes trading harder because the weaker Pound is moving against a US Dollar that is also starting to soften.
With UK GDP for the final quarter of 2025 due today, we should be ready for a downside surprise, especially after the BoE lowered its 2026 growth forecast. One-week implied volatility in the options market has already risen above 8%, showing that traders expect a sharp move after this release and tomorrow’s US inflation data. With volatility this high, holding a simple directional trade carries extra risk.
Because the upcoming data could lead to a big move either way, a long-volatility trade such as a straddle may make sense. This would benefit from a large move in either direction, whether driven by a weak UK GDP result or a softer US CPI print. The goal is to capture a breakout, not to guess the direction.
Another approach is for those who think support near 1.3600 will hold. In that case, selling put options with a strike below 1.3550 could generate income. A similar pattern appeared in late 2023: the UK fell into a technical recession, but the currency still found a floor. However, if price breaks below support in a clear way, buying puts becomes a better hedge against deeper losses.
Over the next few weeks, the market pricing of 50 basis points of cuts in 2026 will likely limit any major Sterling rally. If Pill sounds more hawkish on Friday, markets may reassess in the short term, but the broader dovish pressure remains. For that reason, we should be careful about chasing GBP/USD strength above 1.3800.


