Gold prices in the Philippines rose on Monday, based on data compiled by FXStreet. Gold was priced at PHP 9,218.90 per gram, up from PHP 9,187.04 on Friday.
Gold increased to PHP 107,527.40 per tola from PHP 107,155.90 per tola on Friday. The listed prices were PHP 92,188.98 for 10 grams and PHP 286,738.80 per troy ounce.
Philippine Gold Price Update
FXStreet converts international gold prices into Philippine pesos using USD/PHP and local units. Prices are updated daily at the time of publication and are for reference, as local rates may differ slightly.
Central banks are the largest holders of gold. They added 1,136 tonnes worth around $70 billion to reserves in 2022, according to the World Gold Council, the highest annual purchase since records began.
Gold often moves inversely to the US Dollar and US Treasuries, and can also move opposite to risk assets such as equities. Its price can be influenced by geopolitical risks, recession concerns, interest rates, and US Dollar movements.
We are seeing gold hold its recent gains, which is what we expect with the US Dollar showing some weakness. However, the market is now focused on the upcoming Federal Reserve meeting next week, which could introduce significant volatility. This makes the current price levels a critical pivot point for the coming weeks.
Gold Market Outlook
Underlying support for gold remains strong due to central bank activity, which we saw accelerate throughout 2025. Following last year’s trend, Q1 2026 data confirms that emerging economies have continued to be net buyers, adding over 290 tonnes to global reserves. This steady demand creates a buffer against sharp sell-offs.
The primary risk for gold is the potential for higher interest rates, which increases the opportunity cost of holding a non-yielding asset. After the rate cuts we saw in late 2025, inflation has remained stubborn, hovering around 3.1% according to the latest CPI report. If the Fed signals that rates will stay higher for longer, gold could face immediate downward pressure.
Given the uncertainty, we see value in options that benefit from a large price swing. Implied volatility on gold futures is currently near the lower end of its 12-month range, making strategies like a long straddle relatively cheap. This approach allows a trader to profit whether gold breaks sharply higher on dovish Fed commentary or falls on a hawkish surprise.
For traders with a bullish bias, we suggest using debit call spreads to get upside exposure with a defined risk. One could buy a June call option and simultaneously sell a higher-strike call to lower the initial cost. This strategy provides a profitable window if gold rallies but protects capital if the interest rate outlook weighs on the metal.
Singapore’s industrial production rose 10.1% year on year in March. This was up from -0.1% in the previous period.
The change marks an increase of 10.2 percentage points compared with the prior reading. The data compares March output with the same month a year earlier.
This unexpected 10.1% surge in industrial production is a powerful bullish signal for the Singaporean economy. After the weakness we saw through much of 2025, this data suggests a sharp V-shaped recovery is underway, catching many off guard. We believe this dramatically alters the economic outlook for the second quarter of 2026.
The rebound was likely driven by the critical electronics sector, especially semiconductors. Global semiconductor sales already showed a 3.1% year-over-year increase in February 2026, and this Singapore data confirms the recovery in the global tech cycle is accelerating significantly. This robust performance in high-value manufacturing points directly to higher GDP growth forecasts.
For currency traders, we should expect the Singapore Dollar to strengthen considerably against the US Dollar. This strong data puts immense pressure on the Monetary Authority of Singapore (MAS) to tighten its policy, possibly even before its next scheduled meeting in October. We should consider buying SGD call options to position for this expected appreciation over the next several weeks.
In equity markets, the Straits Times Index (STI) is now poised for a significant rally. We saw a similar dynamic in the post-pandemic rebound of 2021, where strong manufacturing numbers preceded months of sustained gains for the index. We recommend buying STI futures or call options to capitalize on the renewed confidence in the local economy.
Written on April 27, 2026 at 8:25 am, by josephine
Singapore’s industrial production rose by 10.1% year on year in March. This was up from -0.1% in the previous reading.
The change marks an increase of 10.2 percentage points between the two periods. The figures refer to year-on-year growth for March.
Implications For Growth Forecasts
The March industrial production figure, showing a leap to 10.1% growth from a negative reading, is a major upside surprise for the Singaporean economy. This data points to a much stronger growth momentum than anyone had priced into the market. We must now anticipate that official GDP forecasts for the first and second quarters of 2026 will be revised significantly higher.
This unexpectedly strong data gives the Monetary Authority of Singapore (MAS) a clear reason to adopt a more hawkish stance in the coming months. Therefore, we should be positioning for a stronger Singapore Dollar. We can express this view by buying SGD call options or entering long SGD futures contracts against currencies where growth is looking less certain, such as the US dollar.
This economic strength isn’t happening in a vacuum, as recent reports showed global semiconductor sales grew by 15% in the first quarter of 2026. This directly supports Singapore’s crucial electronics manufacturing sector, which is a primary component of its industrial output. The industrial production number confirms Singapore is a key beneficiary of this global tech rebound.
For equities, this is a clear bullish signal for the Straits Times Index (STI). We should consider buying STI index futures or call options to capture the expected market rally. Stocks in the manufacturing and industrial sectors are likely to outperform the broader market in the near term.
We remember the market volatility in mid-2025 when manufacturing data similarly surprised forecasters, leading to a sharp repricing of interest rate expectations. Historically, the MAS has shown it is not afraid to tighten policy ahead of schedule when growth data is this strong. We should expect a similar rapid adjustment in market sentiment over the next few weeks.
Rates Volatility And Strategy
The probability of an earlier-than-expected policy tightening will put upward pressure on short-term interest rates. This means we should monitor interest rate swaps for opportunities, as the market begins to price in a more aggressive MAS. The data surprise will also increase implied volatility, making options strategies that benefit from this, such as straddles on the SGD, potentially profitable.
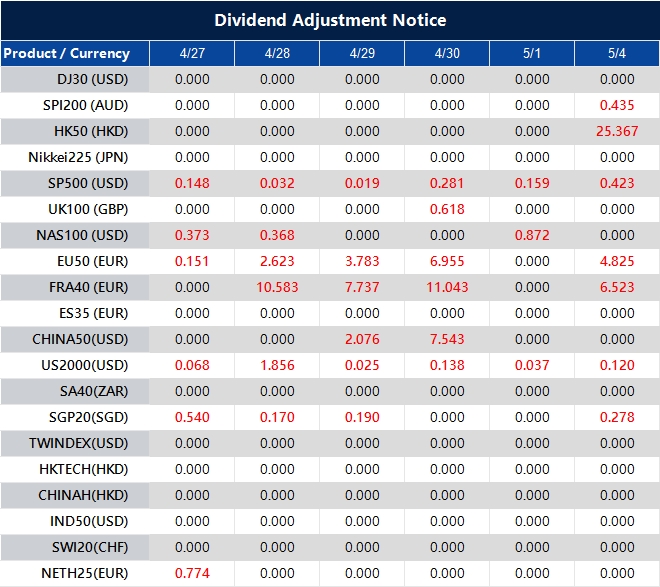
Please note that the dividends of the following products will be adjusted accordingly. Index dividends will be executed separately through a balance statement directly to your trading account, and the comment will be in the following format “Div & Product Name & Net Volume”.
Please refer to the table below for more details:
The above data is for reference only, please refer to the MT4/MT5 software for specific data.
If you’d like more information, please don’t hesitate to contact [email protected].
Singapore’s industrial production rose 4.7% month on month in March. This followed a fall of 7.2% in the previous month.
The latest reading shows a clear rebound from the prior decline. No further breakdown or sector detail was provided in the data shared.
Industrial Production Rebound Signals Stronger Momentum
The jump in Singapore’s March industrial production to 4.7% is a significant reversal from the prior month’s -7.2% contraction. This data signals a strong rebound, likely driven by the crucial electronics sector. We should anticipate that this positive surprise will bolster confidence in the local economy.
We see this as a clear signal to favor the Singapore dollar in the coming weeks. Bullish positions on the SGD, perhaps through call options against the US dollar, now look attractive. The Monetary Authority of Singapore maintained its neutral policy stance in its April meeting, and this strong data reduces the chance of any future easing, providing support for the currency.
For equity derivatives, this strengthens the case for long positions on the Straits Times Index (STI). Buying STI futures or out-of-the-money call options could capture the expected upward momentum, as recent analyst upgrades now place Q2 GDP growth forecasts around 2.5%. The index has already climbed over 2% since the data was released, showing immediate market reaction.
Beyond the index, we should look at options on individual manufacturing and bank stocks that have high correlations to economic growth. While this news creates short-term volatility, a sustained recovery trend could present opportunities to sell volatility in the medium term. The recent rally in bank stocks like DBS further validates this sector-specific strength.
Context From Last Years Manufacturing Headwinds
This rebound is particularly noteworthy when we remember the challenges of 2025. From our perspective last year, the manufacturing sector faced persistent headwinds and contracted for three consecutive quarters due to a global slowdown. The current data suggests we are decisively breaking from that negative trend.
The Nikkei 225 rose 1.38% to close at 60,537.36, finishing above 60,000 for the first time.
The Topix climbed 0.5% to 3,735.28, while the Nikkei has gained 18.6% so far this year.
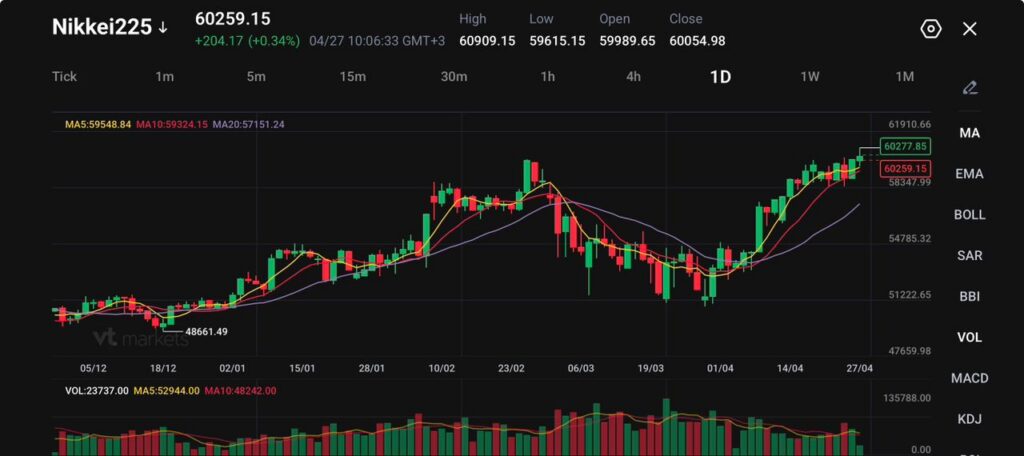
The chart shows Nikkei225 at 60,259.15, up 204.17 points, or 0.34%, with 60,000 now acting as the main sentiment line.
Japan’s Nikkei 225 has done what many traders were watching for: it closed above the key 60,000 mark for the first time. The benchmark index rose 1.38% to finish at 60,537.36, while the broader Topix climbed 0.5% to 3,735.28. The move puts the Nikkei up 18.6% so far this year.
The rally shows how far the market has leaned into Japan’s AI, semiconductor, automation, and robotics story. Wall Street gave Tokyo a strong lead after major US indexes closed at record highs on Friday. Intel beat its earnings estimate, helped by surging demand in the artificial intelligence sector, while the Philadelphia SE Semiconductor Index extended its record run of gains to 18 consecutive sessions.
The S&P 500 and Nasdaq hit record closing highs, bolstered by optimism for possible negotiations between the US and Iran to end the war and a surge in Intel shares that extended the rally in semiconductor stocks https://t.co/rZ2obcfCs6pic.twitter.com/Reh06DEhai
That helped Japanese tech and factory automation names lead the move. Keyence and Fanuc surged by their daily trading limit, nearly 16%, after both companies reported better-than-expected profit after Friday’s close. SMC also joined the top gainers, rising 7.1%, after reports said activist fund Palliser Capital had made a sizeable investment in the factory automation company.
The Rally Is Strong, But Narrow
The headline close looks powerful, but the market breadth tells a more careful story. There were 94 advancers in the Nikkei index against 130 decliners. That means the rally came from a tight group of heavyweights rather than a broad market advance.
This matters for the next move. A narrow rally can keep climbing when large index names attract global flows, especially in a price-weighted index such as the Nikkei 225. But it also means traders should watch for sharp profit-taking if the leaders stall.
Rohm showed that stock-specific risk remains high. The chipmaker fell 9.19% after Denso said it was considering withdrawing its takeover offer.
Denso is set to withdraw its proposal to take over semiconductor maker Rohm, as the two sides were unable to see eye to eye on an offer, Nikkei reported https://t.co/iaBSw4piDQ
Reports over the weekend said Denso had struggled to win Rohm’s support for the tie-up, which could shift focus back to Rohm’s talks with Toshiba and Mitsubishi Electric-linked chip operations.
Iran Proposal Helps Risk Appetite Recover
The Nikkei fell into negative territory shortly after the open, but then rallied after reports said Iran had given the United States a new proposal to end the war and reopen the Strait of Hormuz. The offer was reportedly delivered through Pakistani mediators and would push nuclear talks to a later stage while focusing first on reopening maritime access.
That helped risk appetite because the Strait of Hormuz remains central to the inflation trade. If the strait reopens, oil risk may cool, import pressure may ease, and Japanese manufacturers may face less pressure from energy and logistics costs.
Japan core inflation accelerates after five months as Iran war pushes energy prices higher https://t.co/M5OAqt2dIa
Still, the relief trade does not remove the risk. Discussions to settle the two-month-long conflict stalled over the weekend, and higher oil prices still pose a threat to Japan’s resource-dependent economy. Japan’s record bull run faces pressure from Middle East conflict, supply-chain stress, and higher energy prices, even as early earnings reports have held up better than feared.
BOJ Risk Has Not Gone Away
The Bank of Japan adds another layer to the trade. The BOJ is likely to hold rates at its April 27 to 28 meeting, with sources saying the central bank may wait because the Middle East conflict has made the outlook harder to read. The current policy rate sits at 0.75%, and markets have largely priced out an April hike, while traders still look for signs of a possible move as early as June.
The Bank of Japan is widely expected to keep interest rates unchanged on Tuesday, setting up a communication challenge for Governor Kazuo Ueda as the foundering yen hovers near levels that have prompted past interventions https://t.co/ug5eYKrYYI
This creates a mixed setup for equities. A cautious BOJ can support stocks by keeping liquidity conditions easier for longer. But a weaker yen can raise import costs, especially if oil stays high. That can squeeze margins for companies that cannot pass on costs.
For now, equity traders appear willing to reward earnings strength and AI demand. The risk is that a hawkish BOJ tone, a fresh oil spike, or a stronger yen could trigger a fast reset after such a steep rally.
Technical Analysis
Nikkei 225 is trading near 60,259, pushing back toward the upper end of its range as the index extends its recovery from the March lows. Price action remains constructive, with a clear sequence of higher lows and steady upside continuation as buyers maintain control.
From a technical standpoint, the bias is firmly bullish in the near term. Price is holding above all key moving averages, with the 5-day (59,548) and 10-day (59,324) trending upward and acting as immediate support. The 20-day (57,151) sits well below and continues to slope higher, reinforcing the strength of the current uptrend.
Key levels to watch:
Support: 59,500 → 59,300 → 57,150
Resistance: 60,900 → 61,900 → 63,000
The index is currently testing the 60,900 resistance zone, which aligns with recent highs and marks a key breakout level. A clean move above this area could extend the rally toward 61,900, with further upside potential if momentum remains strong.
On the downside, 59,500 is acting as immediate support. A break below this level could lead to a short-term pullback toward 59,300, though such a move would likely remain corrective as long as price holds above the rising 20-day average.
Overall, the Nikkei 225 is trending higher with sustained momentum, now approaching a critical resistance area. The near-term focus is on whether buyers can clear 60,900 to confirm continuation, or if the index pauses and consolidates after the recent run.
Cautious Forecast
The near-term bias stays constructive while the Nikkei225 holds above 60,000 and the 59,548.84 to 59,324.15 moving-average band. Strong earnings from Japanese automation names and continued AI demand can keep buyers active on dips.
A move above 60,909.15 would support a test of 61,910.66. Failure to hold 60,000 would warn that traders are locking in gains after the 18.6% year-to-date rise. A deeper pullback below 59,324.15 could shift attention back toward 58,347.99 and 57,151.24, especially if Middle East talks stall or the BOJ sounds less patient than expected.
The Nikkei 225 rose above 60,000 for the first time as strong earnings optimism outweighed concern over the Middle East conflict.
The benchmark Nikkei 225 Index gained 1.38% to close at 60,537.36, while the broader Topix climbed 0.5% to 3,735.28.
How Much Has The Nikkei Gained This Year?
The Nikkei has gained 18.6% so far this year.
The rally has been driven by strong demand for AI, semiconductor, automation, and robotics-related stocks, helped by record highs on Wall Street and strong results from key Japanese firms.
Which Stocks Led The Nikkei Higher?
Keyence and Fanuc led the move after both companies reported better-than-expected profit after Friday’s close.
Shares of factory automation provider Keyence and industrial robot maker Fanuc surged by their daily trading limit, nearly 16%. SMC also rose 7.1% after reports said activist fund Palliser Capital had made a sizeable investment in the company.
Why Did AI Stocks Support Japan’s Market?
AI stocks supported Japan’s market after Intel beat its earnings estimate, helped by surging demand in the artificial intelligence sector.
The Philadelphia SE Semiconductor Index also extended its record run of gains to 18 consecutive sessions, which lifted sentiment across Japanese semiconductor, robotics, and factory automation stocks.
How Did Middle East News Affect The Nikkei?
The Nikkei briefly fell into negative territory after the open, but then rallied after reports said Iran had given the United States a new proposal to end the war.
The report helped ease concern over the Strait of Hormuz and supported risk appetite. Traders viewed the proposal as a possible step toward reducing oil supply risk and calming pressure on global markets.
Start trading now – Click here to create your real VT Markets account
USD/CHF stayed weak for a second day, trading near 0.7840 in Asian hours on Monday after falling towards 0.7850. The US Dollar kept losing ground even as demand for safe-haven assets rose.
Pressure on the US Dollar may ease as a ceasefire comes under strain. Israel and Hezbollah increased attacks despite a US-brokered extension intended to pause fighting for three weeks.
Ceasefire Talks And Iran Tensions
US President Donald Trump cancelled a delegation to Pakistan that could have discussed Iran directly. On Saturday, he told Jared Kushner and Steve Witkoff to skip the trip, saying Iran “offered a lot, but not enough”, while Iranian President Masoud Pezeshkian said Iran will not enter “imposed negotiations under threats or blockade.”
Bloomberg reported on Monday that Iran sent the US a proposal to reopen the Strait of Hormuz and end the war, including delaying nuclear talks. The plan also called for extending the ceasefire to work towards a lasting end to fighting.
SNB Chairman Martin Schlegel said the central bank remains open to policy changes and FX intervention. He reaffirmed willingness to buy foreign currencies to weaken the Swiss Franc, and cited more uncertainty, muted near-term growth, and rising inflation as energy costs increase.
We saw significant tension in late 2025 as geopolitical risk, evidenced by the VIX trading above 25, created safe-haven demand for the Swiss Franc. However, the Swiss National Bank’s clear intention to intervene against CHF strength proved to be the more dominant force. Derivative traders should now focus on strategies that benefit from the SNB capping any major upside in the franc, such as selling out-of-the-money call options.
The subsequent climb in USD/CHF from near 0.7850 to its current level around 0.8500 shows this policy in action. Data released for Q1 2026 confirmed a notable increase in the SNB’s foreign currency reserves, a clear sign of their active market intervention. This history suggests that selling CHF strength on rallies remains a viable strategy, as the central bank has demonstrated its resolve.
Rate Differentials And Volatility Risk
While the US Dollar was weak in late 2025, the focus has since shifted back to interest rate differentials. Recent US core PCE inflation data for March 2026 came in at 2.9%, reinforcing the view that the Federal Reserve will be slower to cut rates than the SNB. This policy divergence supports a structurally higher USD/CHF, making long dollar positions against the franc attractive on any significant dips.
Despite the current calm, the underlying Middle East tensions from last year have not been fully resolved, as shown by sporadic naval incidents near the Strait of Hormuz in early 2026. This means sudden spikes in volatility remain a significant risk. Traders should therefore consider buying cheap, long-dated options to hedge against an unexpected flare-up in conflict that could rapidly strengthen the franc before the SNB can react.
Gold prices rose in the United Arab Emirates on Monday, based on FXStreet data. Gold was priced at AED 557.88 per gram, up from AED 556.14 on Friday.
The price per tola increased to AED 6,507.02 from AED 6,486.75 on Friday. FXStreet also listed AED 5,578.96 for 10 grams and AED 17,352.07 per troy ounce.
How Fxstreet Calculates Uae Gold Prices
FXStreet calculates UAE gold prices by converting international prices using the USD/AED exchange rate and local measurement units. Prices are updated daily at the time of publication and are for reference, as local rates may differ slightly.
Central banks added 1,136 tonnes of gold worth around $70 billion to reserves in 2022, according to the World Gold Council. This was the highest annual total since records began, with countries including China, India and Turkey increasing reserves.
Gold is often described as a store of value and is used in jewellery. Its price can be affected by the US Dollar, US Treasuries, interest rates, geopolitical instability and recession concerns.
The recent small increase in gold prices reflects a broader trend we are watching closely, which is tied to the weakening of the US Dollar. The dollar index has fallen over 2% in the last month after the latest US inflation data for March 2026 came in at 2.8%, slightly below consensus forecasts. This has fueled market expectations that the Federal Reserve may begin its rate-cutting cycle as early as this summer.
Central Bank Demand And Market Positioning
Underlying this move is the continued strong demand from central banks, which provides a solid floor for the price. The latest World Gold Council data for the first quarter of 2026 showed global central banks added a net 290 tonnes to their reserves, the most aggressive start to a year since 2023. This persistent buying, especially from emerging market banks, shows a strategic global shift away from dollar-denominated assets.
This is a notable change from the sentiment we saw in the second half of 2025, when gold prices faced significant headwinds. We remember the sharp correction gold experienced when the Fed signaled one final rate hike in September 2025 to combat stubborn services inflation. The current environment feels completely different, as slowing economic indicators now point toward monetary easing.
Looking at the derivatives market, positioning among speculative traders supports this bullish outlook. Recent Commitments of Traders (COT) reports from the CFTC show that net long positions held by managed money in gold futures have increased for five consecutive weeks. This indicates that hedge funds are increasingly betting on further price appreciation in the near term.
For traders, this suggests that long-dated call options are becoming an attractive strategy to capture potential upside while managing risk. The Cboe Gold ETF Volatility Index (GVZ) has actually decreased slightly in recent weeks, making option premiums relatively cheaper than they were a few months ago. This presents an opportunity to build bullish positions, such as call spreads, to capitalize on a potential move towards last year’s highs.
GBP/USD rose from near the 1.3500 level and reached a more than one-week high in Asian trading on Monday. It traded just below the mid-1.3500s, up 0.10% on the day.
The US Dollar weakened after reports that Iran gave the US a new proposal on reopening the Strait of Hormuz and ending the war. Lower oil prices reduced inflation concerns and eased expectations for a hawkish Federal Reserve, adding pressure on the dollar.
Pound Supported By Policy And Technical Signals
Expectations of further Bank of England policy tightening this year supported the pound. The pair had pulled back from the 1.3600 area, described as a two-month peak, and then stabilised ahead of the 200-day simple moving average and the 38.2% Fibonacci retracement of the January–March fall.
The move above the 50% retracement level kept the upward bias intact. RSI was near 59 and MACD stayed in positive territory.
Resistance sat near the 61.8% retracement at 1.3608. Support levels were 1.3523, then 1.3437 and 1.3332, with 1.3161 as a further downside level.
The technical analysis was produced with help from an AI tool.
Option Strategies For A Move Higher
Given the expected weakening of the US dollar and strength in the pound, we should consider strategies that profit from a rise in GBP/USD toward the 1.3600 area. Buying call options with a strike price near 1.3550 would provide direct exposure to this upward move with a defined risk. A more conservative approach would be a bull call spread, which would lower the upfront cost of the trade.
Looking back at this forecast from early 2025, we recall the temporary optimism regarding US-Iran relations that briefly softened the dollar. This geopolitical development was a primary driver for the pound’s rally at that time. However, we now know that those peace hopes faded by the second quarter of 2025, which ultimately put a ceiling on this particular currency move.
The bets on Bank of England policy tightening were well-founded, as we saw them raise the Bank Rate in May of 2025 to combat inflation. UK inflation statistics from that period, which we can now see averaged 4.2% in the first half of 2025, provided the fundamental support for a stronger pound. This data confirms why the pound was able to gain ground against other currencies.
Conversely, the market’s hope for a less aggressive Federal Reserve was premature. US inflation data for the first quarter of 2025 came in stubbornly high, with core CPI averaging 3.8%, preventing the Fed from signaling any policy pivot. This underlying US economic strength is why the dollar’s weakness was short-lived and the GBP/USD rally eventually stalled below 1.3700.
For traders, the technical levels mentioned were crucial for executing positions. The 1.3608 resistance level was the clear target for taking profits on long positions initiated around the 1.3500 handle. The support at 1.3437 acted as a vital line in the sand; a breach of this level would have been our signal to exit bullish trades.
Gold prices in Pakistan rose on Monday, based on FXStreet data. Gold was priced at PKR 42,356.48 per gram, up from PKR 42,198.95 on Friday.
Gold increased to PKR 494,037.70 per tola from PKR 492,200.30 per tola on Friday. Listed prices were PKR 423,564.80 for 10 grams and PKR 1,317,438.00 per troy ounce.
Pakistan Gold Price Snapshot
FXStreet converts international gold prices into Pakistani rupees using USD/PKR and local measurement units. Prices are updated daily at the time of publication and are for reference, as local rates may differ.
Gold is used as a store of value and a medium of exchange, and is also used in jewellery. It is often treated as a safe-haven asset and as a hedge against inflation and currency weakness.
Central banks hold the most gold and may buy it to diversify reserves. They added 1,136 tonnes worth about $70 billion in 2022, according to the World Gold Council.
Gold often moves inversely to the US Dollar and US Treasuries, and can also move against risk assets such as shares. Price drivers include geopolitics, recession risks, interest rates, and US Dollar strength.
Market Drivers And Trading View
With the US Dollar Index slipping to 104.2 from its recent highs, we see an immediate opportunity in gold. This inverse relationship is a core market driver, and the dollar’s recent weakness provides a tailwind for precious metals. The market is clearly favoring assets priced against the dollar.
This dollar movement is heavily influenced by expectations for future interest rates. The latest US CPI data for March 2026 came in at a subdued 2.8%, increasing market bets that the Federal Reserve will initiate a rate cut by the third quarter. Lower interest rates decrease the opportunity cost of holding non-yielding assets like gold, making it more attractive.
We are also seeing continued strong demand from central banks, a trend that has persisted since the record buying we observed back in 2022. The World Gold Council’s most recent report indicated that central banks, particularly in Asia, collectively added over 290 tonnes in the first quarter of 2026. This consistent institutional buying provides a solid price floor and signals underlying strength in the market.
Geopolitical tensions also remain a factor, with ongoing trade negotiations and maritime disputes creating market uncertainty. During turbulent times, gold serves its classic role as a safe-haven asset. Looking back at how gold performed during the instability of 2025, we see a clear pattern of it acting as a hedge against volatility in riskier assets like equities.
Given these factors, derivative traders should consider establishing bullish positions. Buying call options on gold futures, perhaps targeting the resistance levels seen late last year, could offer significant upside. This strategy allows for participation in gold’s potential rally while defining risk in the coming weeks.