Silver (XAG/USD) rose for a second day, trading near $76.00 per troy ounce during Asian hours on Monday. Demand increased as safe-haven buying picked up after US–Iran talks stalled.
US President Donald Trump cancelled a planned delegation to Pakistan, which is mediating talks with Iran. Trump told Jared Kushner and Steve Witkoff not to travel, saying Iran “offered a lot, but not enough”.
Geopolitical Tensions Drive Safe Haven Demand
Trump said, “If they want to talk, they can come to us, or they can call us.” Iranian President Masoud Pezeshkian said Iran would not enter “imposed negotiations under threats or blockade.”
Traffic through a strategic waterway remains largely restricted due to Iran’s controls and a US naval blockade. This has supported crude oil prices and raised concerns about supply disruption.
Higher energy prices can add to inflation pressure and keep central banks cautious, which may cap gains in non-interest-bearing silver. The US Federal Reserve is expected to hold rates steady at its April meeting, with gradual cuts anticipated under incoming Chair Kevin Warsh.
With silver near $76.00, we are seeing a classic conflict between geopolitical fear and monetary policy. The stalled US-Iran talks are providing strong safe-haven support for the metal. However, the resulting spike in energy prices is creating a significant headwind through fears of a hawkish Federal Reserve.
The immediate outlook suggests high volatility, making long-volatility strategies like straddles on silver options attractive. We saw a similar situation back in early 2022 when the conflict in Ukraine sent precious metals soaring over 10% in a matter of weeks. The CBOE Silver Volatility Index (VXSLV) is currently trading above 35, a level not seen since that period, indicating traders are pricing in significant price swings.
Positioning And Fed Risk Ahead
For those betting on further escalation, buying call options on the July futures contract offers leveraged upside with defined risk. A breakdown in talks or further restrictions in the strategic waterway could easily push silver towards the $80 mark. Open interest in out-of-the-money calls has surged nearly 40% in the last week, showing this is already becoming a popular trade.
Conversely, the upcoming Federal Reserve meeting is a major risk, and purchasing put options could be a prudent hedge against a sharp decline. We only need to look back to the 2022-2023 hiking cycle to see how a hawkish Fed can pressure non-yielding assets, even amid inflation. If incoming Chair Warsh signals a firm stance against energy-driven inflation, we could see a rapid unwinding of speculative long positions.
The key is to watch the rhetoric from both Washington and Tehran, as any sign of de-escalation could trigger a sharp sell-off. The latest Commitment of Traders report shows managed money holds its largest net-long position in silver in over two years. This makes the market vulnerable to a sudden reversal if the geopolitical risk premium evaporates before the Fed meeting.
EUR/USD recovered early losses and traded slightly higher near 1.1730 in Monday’s Asian session. The move came as the US Dollar weakened, with the US Dollar Index (DXY) down 0.06% to about 98.45.
DXY opened around 99.35 after the US cancelled a visit to Islamabad for further Iran peace talks. The cancellation came as Iran’s foreign minister Seyed Abbas Araghchi visited Pakistan to resume discussions.
Geopolitical Developments And Market Impact
Iran presented a proposal to the US to reopen the Strait of Hormuz and end the war, according to Axios as cited by Bloomberg. The proposal included delaying nuclear talks until after any US blockade of the Strait of Hormuz is lifted, in the context of an almost two-month-long conflict.
Volatility is expected this week as the Federal Reserve and the European Central Bank announce policy on Wednesday and Thursday. EUR/USD remains above the 20-day EMA at 1.1696, with RSI at 54.9.
Resistance sits at 1.1749, then 1.1828, 1.1941, and near 1.2085. Support levels include 1.1696, 1.1670, 1.1572, and around 1.1413.
As of today, April 27, 2026, we are watching the EUR/USD trade near 1.0850, a level far below what we saw in a similar setup back in 2025. That year, the pair was trading much higher around 1.1730, but the market was also tense ahead of major central bank meetings. The fundamental drivers of volatility, central banks and geopolitics, remain the same today.
We recall how in 2025, tensions between the US and Iran over the Strait of Hormuz caused a sharp, but temporary, spike in the US dollar. Today, while that specific issue has faded, we are now focused on trade disputes in the Asia-Pacific region which could trigger similar safe-haven dollar buying. This shows how geopolitical risk can quickly shift market sentiment, making headline-driven volatility a key factor.
Central Banks And Policy Divergence
The upcoming Federal Reserve and European Central Bank meetings this week are the market’s primary focus, just as they were then. However, the economic data is now much different; recent reports from earlier this month showed US inflation holding firm at 2.8%, while Eurozone inflation has cooled to 2.1%. This growing divergence suggests the Fed has more reason to maintain a restrictive policy than the ECB.
Given this policy divergence, we are looking at buying EUR/USD put options with a strike price around 1.0800 to position for a potential downward move. These options would provide downside exposure if the Fed signals a more hawkish stance than anticipated. A break below this level could open the way for a slide towards the year’s low of 1.0720.
Volatility is expected to rise sharply around the announcements, and the Cboe EuroCurrency Volatility Index has already ticked up to 8.2 in anticipation. For traders who expect a big move but are unsure of the direction, a long straddle strategy involving buying both a call and a put option could be effective. This would allow a trader to profit from a significant price swing, regardless of whether it is up or down.
We remember from the 2025 incident how fast the market can turn on a single piece of news. Therefore, any long positions should be protected with stop-loss orders below the immediate support at 1.0820. The key is to manage risk carefully, as a surprise from either central bank could easily overwhelm the technical picture.
The US Dollar Index (DXY) traded slightly lower at about 98.45 in early Asian trading on Monday, falling below 98.50. The move followed reports that Iran sent the United States a proposal linked to reopening the Strait of Hormuz.
Bloomberg reported that the proposal includes reopening the strait and steps to end the war, with nuclear talks delayed. It also called for extending a ceasefire so both sides can work towards a permanent end to the fighting.
Us Iran Proposal And Market Reaction
On Sunday, US President Donald Trump told Jared Kushner and Steve Witkoff not to travel to Pakistan, which is mediating talks. Trump said Iran “offered a lot, but not enough.”
Markets are also focused on the Federal Reserve rate decision on Wednesday. The Fed is expected to keep the federal funds rate between 3.50% and 3.75%, where it has been since January.
Deutsche Bank analysts said a shift in expected Fed policy towards a more hawkish stance, driven by persistent oil-related inflation, could lift the DXY. The US Dollar is the most traded currency, making up over 88% of global foreign exchange turnover, or about $6.6 trillion per day, based on 2022 data.
We remember how the US Dollar Index reacted last year to news about the Strait of Hormuz, dropping below 98.50 on the mere possibility of a deal. As of today, April 27, 2026, the DXY is stronger, sitting near 103, but that sensitivity to geopolitical shocks remains a key risk. Traders should therefore be cautious, perhaps buying volatility through options on currency ETFs to protect against any sudden Mideast headlines.
Oil Risk And Hedging Ideas
The memory of 2025 serves as a reminder of how tightly oil is linked to these tensions. With Brent crude currently trading around $87 a barrel, a figure supported by ongoing OPEC+ production discipline that has kept global inventories tight, any disruption could cause a significant price spike. We see value in long-dated call options on oil futures or energy sector funds, which act as a direct hedge against a potential conflict flare-up.
The Federal Reserve’s position has changed dramatically since last year when rates were holding steady in the 3.50% to 3.75% range. Today, the central bank has already started a cautious easing cycle, with the federal funds rate now at 4.50% as inflation has cooled to a stubborn 3.4% annually. This shift means we are no longer watching for hikes but for the pace of future cuts.
Given this new environment, the primary derivatives play on the Fed is about the path of interest rates. The market is currently pricing in two more quarter-point cuts by the end of this year, which we believe may be too optimistic given recent inflation data. Therefore, positioning in options on Fed Funds futures that would profit from a slower pace of cuts than anticipated could be a prudent strategy for the coming weeks.
Iran sent the US a proposal aimed at reopening the Strait of Hormuz and ending the war, according to Bloomberg citing an Axios report on Monday. The report cited a US official and two sources familiar with the matter.
The proposal included extending a ceasefire to allow work towards a permanent end to the fighting. It also set out that nuclear negotiations would be delayed.
Ceasefire And Nuclear Talks Linkage
Under the plan, nuclear talks would only begin after a US blockade of the Strait of Hormuz was lifted. Axios said Pakistani mediators delivered the proposal to the White House.
The report said it is unclear whether the US will consider the proposal. Market reaction showed WTI up 0.33% at $93.70 at the time of writing.
We remember the proposal last year to end the fighting and reopen the Strait of Hormuz after the US blockade sent prices climbing. That memory of WTI crude hitting $93.70 serves as a critical reference point for the market’s sensitivity to regional tensions. The core issues from 2025 were only postponed, not solved, leaving the market vulnerable.
The strategic importance of this waterway cannot be overstated, as we see about 21 million barrels of oil pass through it daily, representing roughly 21% of global consumption. With WTI currently trading around $84 per barrel as of late April 2026, any renewed hint of disruption could easily trigger a rapid 10-15% price spike. This underlying risk creates a significant upside bias in the market.
Options Market Signals And Positioning
Given this context, implied volatility in the crude oil options market is elevated compared to periods of calm. We saw the oil volatility index (OVX) surge during the 2025 blockade, and while it has since subsided, it remains well above its historical lows. This sustained premium indicates that the market is still pricing in the potential for a sudden supply shock.
Traders should consider buying long-dated call options to hedge against or speculate on a future flare-up. Strikes at $95 or $100, which seemed distant just months ago, are now a realistic possibility if diplomatic channels falter again. These positions offer a defined-risk way to capture the explosive upside potential from a repeat of last year’s events.
This tension is visible in the market’s structure, with a noticeable upside skew in options pricing. Out-of-the-money calls are trading at a significant premium to equivalent out-of-the-money puts, a clear signal that traders are more concerned about a price surge than a collapse. This skew itself presents trading opportunities for those structuring spreads.
For those with a higher risk tolerance who believe the situation will remain stable, selling cash-secured puts or credit spreads at lower strikes can be attractive. This strategy allows us to collect the rich volatility premium while betting that a worst-case scenario will be avoided. However, the risk of a sudden geopolitical shift makes this a far more dangerous position.
Recent data from the Energy Information Administration (EIA) shows that global commercial crude inventories are sitting just below their five-year average. This relative tightness in supply means the market has less of a buffer to absorb any disruption from the Strait of Hormuz. A shutdown, even for a few days, would have a much more immediate and severe impact on prices than it would have in a well-supplied environment.
AUD/USD rose for a second day, reaching about 0.7170 in the Asian session after a modest dip on Monday. The pair stayed within a range that has held for around two weeks.
The US Dollar remained weak as markets waited for this week’s FOMC meeting. A generally positive risk tone reduced demand for the Dollar.
Drivers Behind The Move
AUD/USD found support from the Reserve Bank of Australia’s hawkish stance, despite stalled US-Iran peace talks and tension around the Strait of Hormuz. These factors helped keep the pair bid during the session.
Technically, the recent sideways trading is described as bullish consolidation after a rally from the 100-day simple moving average, touched in March. Momentum indicators stayed positive, with the RSI above 60 and not overbought, and the MACD histogram in positive territory.
A move above 0.7185–0.7190 is needed to break the range and confirm further upside. On pullbacks, support is seen ahead of 0.7100, while a clear move below 0.7100 would point to a correction.
The article notes that the technical analysis was produced with help from an AI tool.
Trade Setups And Positioning
We see the AUD/USD showing positive signs, attracting buyers around the 0.7170 level. This move is supported by a hawkish Reserve Bank of Australia, especially after first-quarter inflation for 2026 came in at a firm 3.6%. This data reinforces the view that the RBA may keep rates higher for longer than other central banks.
A softer US Dollar is helping the Aussie’s advance ahead of this week’s critical FOMC meeting. With core inflation in the US still hovering around 2.8%, traders are hesitant to bet on a decisive policy signal from the Federal Reserve just yet. This uncertainty is weighing on the greenback and benefiting risk-sensitive currencies like the Aussie.
We also see fundamental support from key commodity prices, with iron ore holding steady above $115 per tonne. Furthermore, recent data showed China’s economy grew by a solid 5.3% in the first quarter of 2026, boosting confidence in Australia’s largest trading partner. This positive external environment provides a tailwind for the Australian dollar.
For derivatives traders, this sets up a potential play on a bullish breakout. Buying call options with a strike price just above the 0.7190 resistance could be a way to position for a sustained move higher. We remember from the volatility in 2025 that these ranges can break decisively once a catalyst like an FOMC meeting appears.
On the other hand, dips toward the 0.7100 mark may present opportunities to enter long positions or sell put options. Traders could consider selling cash-secured puts at or below this level to collect premium while defining an entry point. A firm break below that support would suggest this bullish view needs to be reassessed.
USD/CAD traded near 1.3660 during Asian hours on Monday, and stayed subdued for a second day. The pair fell as the Canadian Dollar gained support from higher oil prices, with Canada the largest crude exporter to the US.
WTI traded around $94.00 per barrel after a 2.4% fall the previous day. Oil rose amid supply concerns linked to stalled US–Iran peace talks.
Geopolitical Tensions And Oil Supply
US President Donald Trump told Jared Kushner and Steve Witkoff to skip a trip to Pakistan, which is mediating talks. Trump said Iran “offered a lot, but not enough”, while Iranian President Masoud Pezeshkian said Iran would not enter “imposed negotiations under threats or blockade”.
Traffic through a strategic waterway remained largely restricted due to Iran’s controls and a US naval blockade. This added to concerns about extended disruption and supported crude prices.
USD/CAD was also held down as the US Dollar fell for a second day. This came despite higher safe-haven demand as the ceasefire came under strain, with Israel and Hezbollah increasing attacks during a US-brokered three-week extension.
We are seeing a familiar tension in USD/CAD, which is currently hovering around 1.3700. The commodity-linked Canadian Dollar is drawing support from firm WTI crude prices, which are trading near $84.50 a barrel due to persistent geopolitical risks. This dynamic is creating a tug-of-war that derivative traders should watch closely.
Volatility Positioning In Usd Cad
Looking back at similar situations in 2025, we recall how stalled US-Iran talks and naval blockades sent oil prices and market volatility soaring. That period serves as a clear blueprint for how quickly geopolitical headlines can override economic data in the energy sector. These past events underscore the importance of monitoring supply-side risks originating from the Middle East.
Unlike last year’s scenario, however, the US Dollar is showing significant underlying strength today. This is largely due to the divergence in central bank policy, as US inflation remains persistent at 3.5%, keeping the Federal Reserve from cutting rates. Meanwhile, with Canadian inflation easing to 2.9%, the Bank of Canada is expected to lower rates sooner, which could weaken the CAD.
For derivative traders, this clash between strong oil and a strong US dollar suggests implied volatility in USD/CAD is likely undervalued. We believe positioning for a significant price move, rather than a specific direction, is prudent. Purchasing straddles or strangles could allow traders to profit from a breakout, whether oil prices push the pair down or interest rate policy drives it higher.
Traders should also focus on the crude oil market itself, as it is the primary catalyst. Open interest in WTI futures has climbed over 5% in the last month, showing that money is flowing into the market in anticipation of price swings. We are seeing notable activity in call options with strike prices above $90, indicating a hedge against further supply disruptions.
NZD/USD rose at the start of the week after rebounding on Friday from the 200-day simple moving average near 0.5840. It moved back towards 0.5900 in Asia as the US Dollar eased, but gains stayed limited amid geopolitical risk.
Improved equity sentiment reduced demand for the safe-haven US Dollar, supporting the pair for a second day. US Dollar weakness was restrained after US-Iran talks stalled and President Donald Trump cancelled envoys Steve Witkoff and Jared Kushner’s trip to Pakistan linked to Iran war talks.
Geopolitical Risk And Fed Expectations
Israel’s Prime Minister Benjamin Netanyahu ordered the military to attack Hezbollah targets in Lebanon. The US-Iran dispute over the Strait of Hormuz and supply disruption there raised inflation concerns and supported expectations of a more hawkish Federal Reserve, limiting further US Dollar losses.
Markets also awaited the two-day FOMC meeting outcome on Wednesday. The pair also drew support from expectations that the Reserve Bank of New Zealand may keep policy cautious or tighten to guide inflation towards its 2% midpoint within a 1% to 3% target band.
We remember the cautious mood back in 2025 when the NZD/USD pair struggled near the 0.5900 handle. Geopolitical tensions involving the US and Iran were a major factor at the time, fueling safe-haven demand for the US Dollar and capping any significant gains. This created a tight trading range that kept many traders on the sidelines.
As of today, April 27, 2026, the central bank policy divergence that was just beginning to be discussed is now the primary driver, with the pair trading near 0.6150. New Zealand’s latest quarterly inflation figures from Q1 2026 came in stubbornly high at 3.1%, keeping pressure on the RBNZ to hold its 5.50% rate. In contrast, US inflation has cooled to 2.8%, increasing market bets that the Federal Reserve will deliver at least two rate cuts before year-end.
Options Strategies And Key Risks
This widening rate differential makes long positions in the NZD/USD attractive. Traders should consider buying call options with a strike price around 0.6250 and a July 2026 expiry to capitalize on the expected upward momentum. This strategy offers a defined-risk way to profit from the Kiwi’s relative yield advantage over the greenback.
However, we must consider the lingering weakness in the Chinese economy, which remains a significant headwind for the Kiwi. China’s Q1 2026 GDP growth missed expectations, coming in at 4.8% and raising concerns about export demand from New Zealand. This could limit the upside, making outright long positions risky without careful management.
Given the supportive dairy prices, which saw the Global Dairy Trade index rise 1.5% in the most recent auction, there appears to be solid support for the pair. Therefore, selling put options with a strike near 0.6050 could be an effective strategy for collecting premium. This takes advantage of market volatility while expressing a view that any significant dips in the pair will be short-lived.
USD/JPY was little changed near 159.50 in early Asian trading on Monday. Trading was quiet ahead of interest rate decisions from the Bank of Japan (BoJ) and the US Federal Reserve (Fed).
Markets expect the BoJ to keep rates at 0.75% on Tuesday. Policymakers are weighing energy-led inflation against uncertainty linked to conflicts in the Middle East.
Yen Intervention Risk
Concerns about currency intervention may support the yen and limit USD/JPY gains. Japan’s Finance Minister, Satsuki Katayama, referred to a “high sense of urgency” about speculative moves and yen weakness linked to Middle East tensions.
The Federal Open Market Committee is expected to keep the federal funds rate in the 3.50% to 3.75% range. This would be the third meeting in a row with no change.
The meeting may be the final one for Jerome Powell, with Kevin Warsh nearing confirmation as his successor. Markets will watch the press conference for guidance on energy costs and the longer-term rate path.
With the USD/JPY pair sitting quietly near 159.50, we are seeing a classic pre-event holding pattern before the Bank of Japan and Federal Reserve meetings. This uncertainty has pushed one-month implied volatility in the pair up towards 9.5%, suggesting the options market is bracing for a significant move. For derivative traders, this period of calm is the time to position for the breakout that is likely to follow.
Fed Message And Volatility
On the US side, we see the Fed holding rates, but the key will be the tone of the press conference. Considering that core inflation figures from last quarter remained stubborn around 3.4%, policymakers have little room to sound dovish. Any hint that higher energy costs will delay rate cuts would be a hawkish signal, likely sending the dollar higher.
The biggest risk to a higher USD/JPY, however, remains intervention from Japanese authorities. We only have to remember the sharp, multi-yen drops that occurred in late 2022 to see how seriously officials take what they call speculative moves. This “high sense of urgency” creates a significant downside risk and makes holding outright long positions very dangerous.
Given these strong opposing forces, we believe a simple directional bet is not the best approach for the coming weeks. We are favoring long volatility strategies, such as buying a straddle, using options with about a one-month expiry to capture the move after both central banks have spoken. This allows us to profit from a large swing without having to correctly predict whether it will be up or down.
After the meetings, we will be closely watching the follow-through and any initial statements from incoming Fed chair Kevin Warsh. The market’s behavior in the days following the announcements will be more important than the initial knee-jerk reaction. This will help us structure our positions for the rest of the quarter.
Gold holds a tight range as XAUUSD traders wait for US Core PCE and GDP data.
Fed leadership risk returns as Kevin Warsh’s policy views reshape rate-cut expectations.
USDX remains the market’s gatekeeper for gold, Bitcoin and US equity sentiment.
SP500 trades near highs, but sticky inflation and oil strength could limit upside.
BTCUSD eyes 80000, with softer inflation needed to keep liquidity hopes alive.
Markets enter the new week with the Federal Reserve back at the centre of the macro story. Kevin Warsh’s confirmation hearing has shifted attention from a simple rate-cut debate to a broader question around Fed independence, inflation credibility and the next policy framework.
Warsh has argued that productivity gains from artificial intelligence could give the Fed more room to lower rates, but that does not make him a clean dove.
🎙️ Inflation is flaring, hiring is slowing — and the Fed is split. What will happen if Kevin Warsh takes over as Fed chair? Find out on this week's Econ World podcast https://t.co/aKXpltwx6jpic.twitter.com/2ijV3MW6Rj
His wider policy stance points toward a stricter 2% inflation target, reduced reliance on quantitative easing, a smaller balance sheet over time and less dependence on forward guidance.
US equity-index futures dropped and the dollar climbed after a breakdown in momentum toward a more peace talks between the US and Iran https://t.co/zmaUASuUkd
That mix leaves markets with a more complicated Fed story. Rate cuts remain possible, but aggressive easing may be harder to price if inflation stays firm and FOMC members remain cautious. For USDX, XAUUSD, SP500 and BTCUSD, this keeps every inflation and growth release more sensitive than usual.
Core PCE Becomes The Main Test For Gold And The Dollar
The Core PCE Price Index is the main event for XAUUSD this week. The March reading is forecast at 0.3% month-on-month, easing from 0.4% previously. A softer print would support the case for rate cuts later this year, while a hotter print would strengthen the dollar and make gold’s upside harder to sustain.
The last core PCE reading showed monthly inflation still running at 0.4%, while the annual core rate remained near 3.0%, above the Fed’s 2% target. That keeps the market sensitive to even small surprises in the data.
US equity-index futures dropped and the dollar climbed after a breakdown in momentum toward a more peace talks between the US and Iran https://t.co/zmaUASuUkd
For XAUUSD, the setup is clear. Softer inflation would help ease real-yield pressure and could keep buyers active near the lower end of the range. Stronger inflation would give USDX a fresh catalyst and could force another test of gold support.
The broader read is also important for SP500 and BTCUSD. Risk assets do not need weak data. They need inflation to be slow enough to preserve rate-cut hopes without signalling a sharper economic slowdown.
US GDP Will Shape The Soft-Landing Trade
US Advance GDP gives traders the second major checkpoint. The upcoming Q1 reading is forecast at 2.2%, up from the previous 0.5% rate. The prior fourth-quarter figure had already been revised lower, with real GDP growth slowing sharply from the third quarter’s 4.4% pace.
A stronger GDP number can support equities if inflation cools at the same time. That mix would keep the soft-landing trade alive and give SP500 buyers a reason to defend high levels. The risk comes from stronger growth paired with sticky inflation. That combination can reduce the urgency for Fed cuts and lift USDX.
Oil Keeps Inflation Pressure In The Background
Oil remains the market’s pressure point. US-Iran peace talks have stalled, while supply concerns around the Strait of Hormuz continue to support crude prices. Brent traded near $107.49, while WTI moved around $96.17, with both benchmarks coming off strong weekly gains.
Traffic through the Strait of Hormuz has remained at a near-complete halt, with neither Iran nor the US showing any sign of easing their blockades https://t.co/oUcWHYJqpr
This keeps inflation risk alive even before the US data lands. Higher oil prices can feed headline inflation, squeeze consumer spending and make the Fed’s job harder. That backdrop can support USDX through defensive flows, but it can also lift demand for gold as a hedge against policy and geopolitical stress.
Equities face the harder trade-off. SP500 can hold up if growth stays firm and earnings expectations remain steady, but higher oil prices can pressure margins and inflation expectations. If crude keeps climbing, the market may become less willing to chase all-time highs without stronger confirmation from the data.
The same logic applies to BTCUSD. Crypto can extend if liquidity expectations stay alive, but rising energy prices and a stronger dollar can quickly cool momentum.
Risk Appetite Needs A Softer Dollar To Extend
The week ahead comes down to whether the dollar gives risk assets room to breathe. SP500 and BTCUSD have both benefited from the idea that the Fed can still cut rates later in the year. XAUUSD has held support as traders hedge against inflation, geopolitical risk and policy uncertainty.
The next move depends on confirmation. Softer Core PCE, steady GDP and cooling oil would create a friendlier environment for gold, equities and Bitcoin. Hot inflation, firm growth and higher crude prices would point to a stronger dollar and more defensive positioning.
For now, the market is cautious rather than bearish. Traders are still willing to buy strength, but they are less willing to ignore data risk.
Key Symbols to Watch
XAUUSD
USDX
SP500
BTCUSD
USOil
Key Events of the Week
Date
Currency
Event
Forecast
Previous
Analyst Remarks
Tue, Apr 28
JPY
BOJ Policy Rate
0.75%
0.75%
Forward guidance can steer USDJPY near the 160 zone.
Wed, Apr 29
AUD
CPI y/y
4.80%
3.70%
A hotter print could revive RBA tightening pressure.
Thu, Apr 30
USD
Advance GDP m/m
2.20%
0.50%
Strong growth may limit Fed rate-cut pricing.
Thu, Apr 30
USD
Core PCE Price Index q/q
0.30%
0.40%
Softer inflation can weaken USDX and support gold.
For a full view of upcoming economic events, check out VT Markets’ Economic Calendar.
Key Movements of the Week
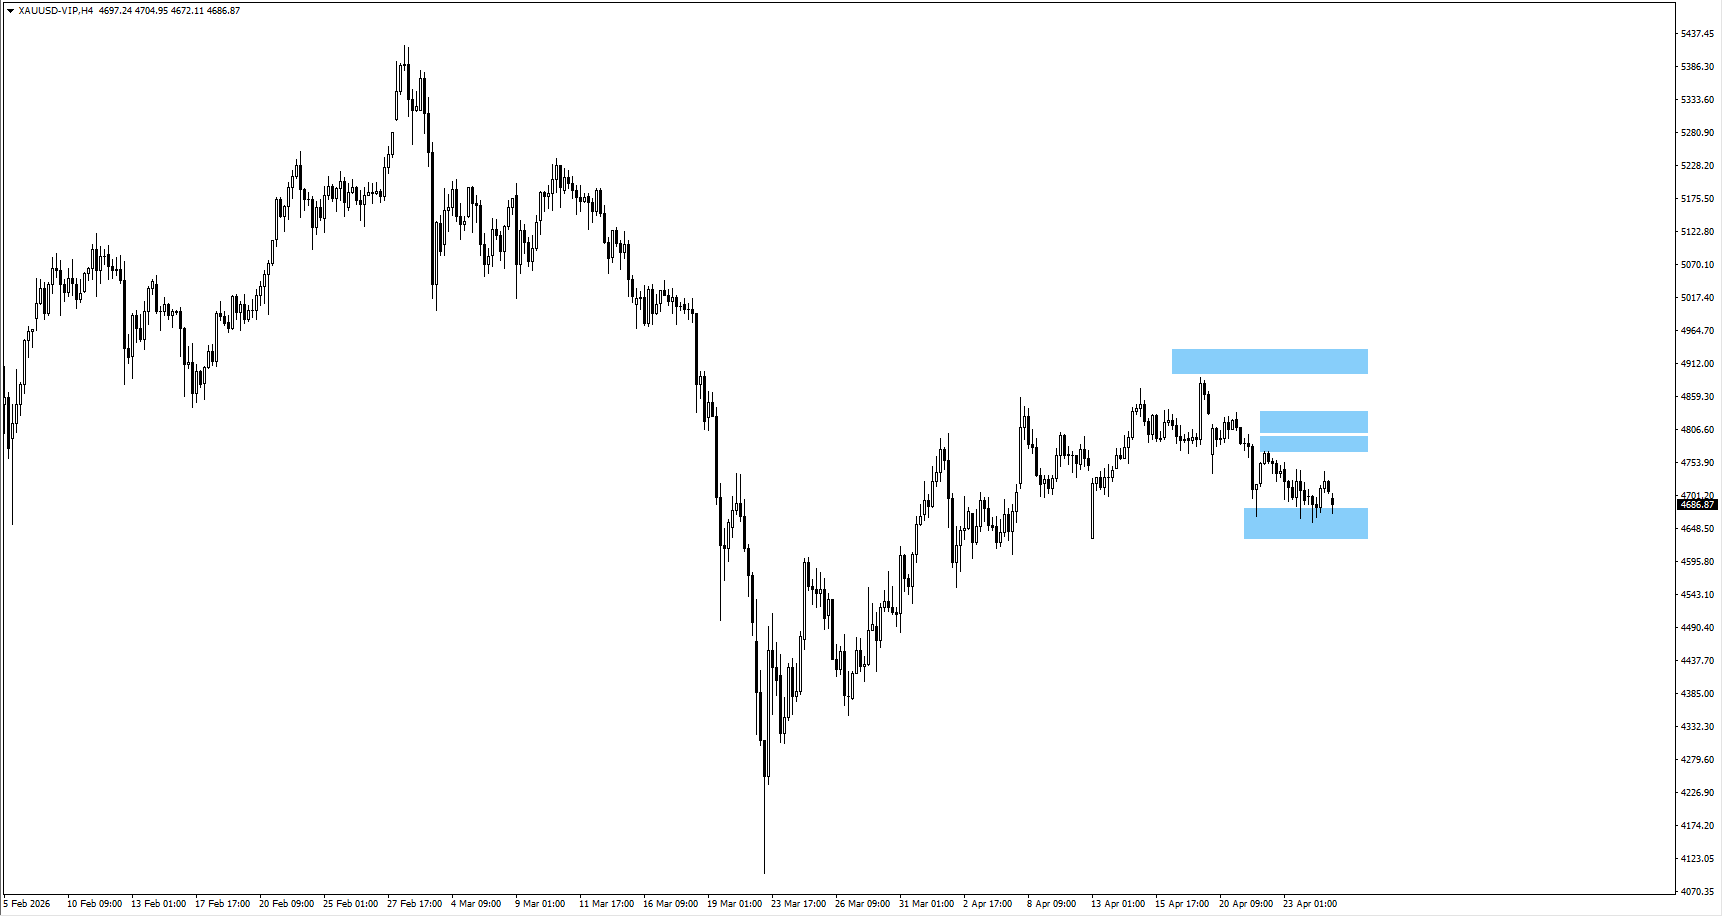
XAUUSD
Range-bound trade continues for XAUUSD after it rebounds from 4660, test of 4790, and rotation lower before Core PCE Price Index.
A softer Core PCE Price Index could keep XAUUSD supported near 4660 if USDX loses momentum.
Stronger US Advance GDP may lift yields and dollar demand, raising the risk of a XAUUSD break below 4633.39.
A move above 4790 would show XAUUSD buyers are moving beyond defensive positioning.
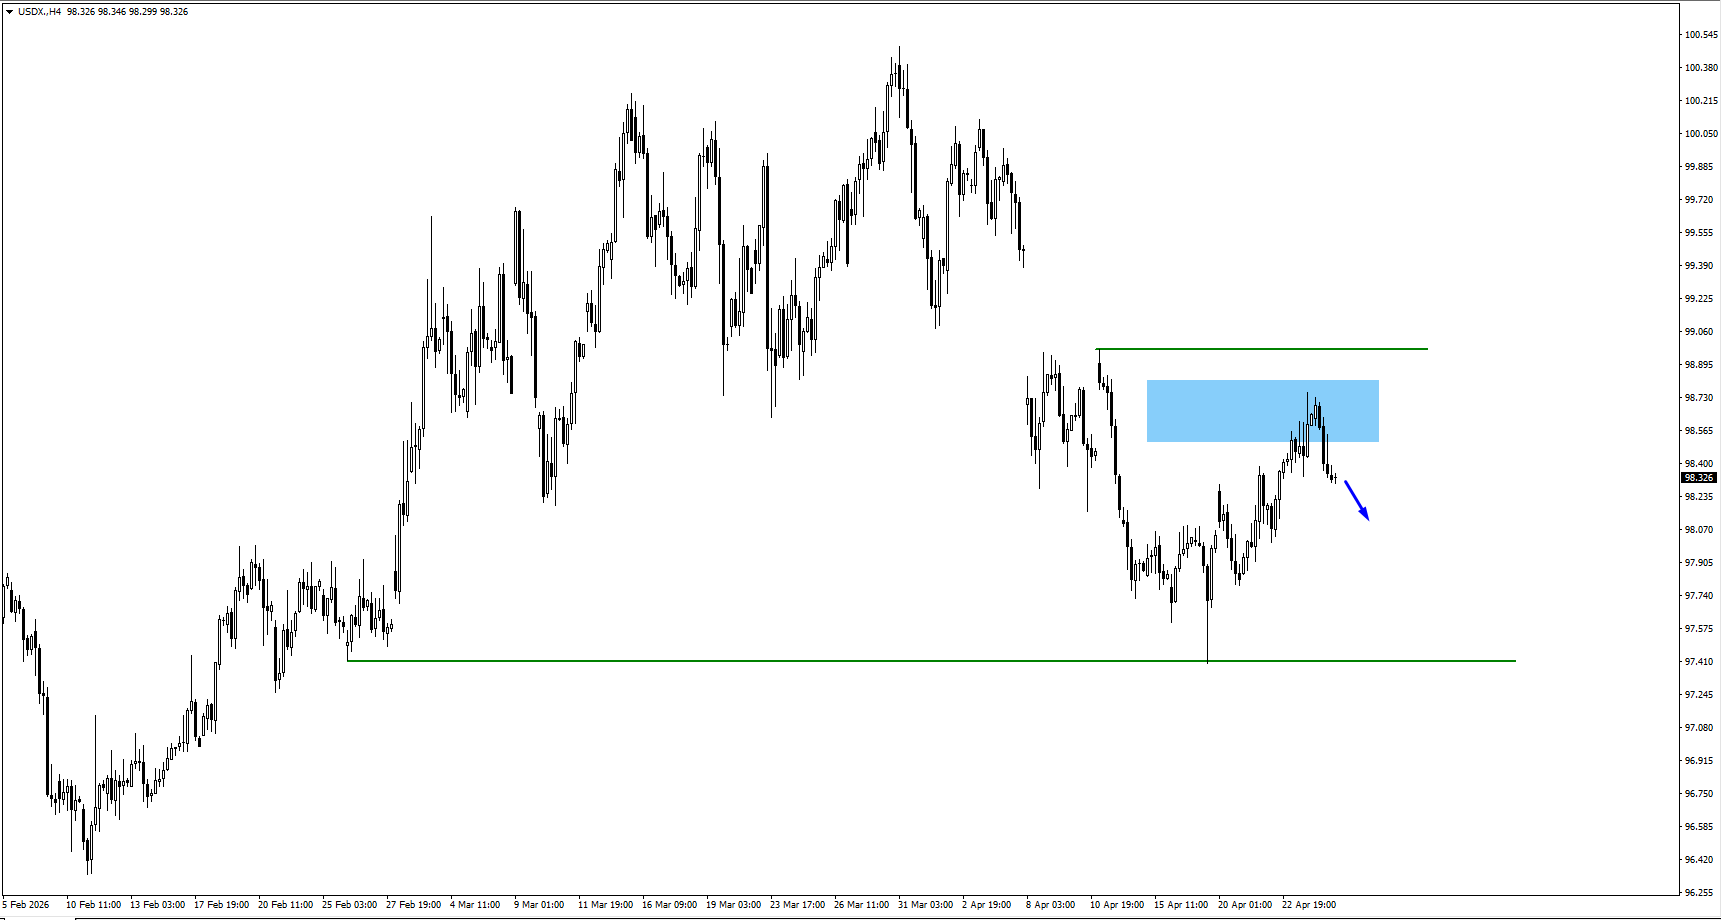
USDX
Dollar momentum remains limited after USDX traded lower from the 98.50 monitored area before US Advance GDP.
Price action around 98.15 will show whether USDX sellers can stay in control.
Softer Core PCE Price Index could pull USDX below 98.15 and open a move toward 97.399.
A break above 98.966 would warn that USDX demand is returning on stronger US data.
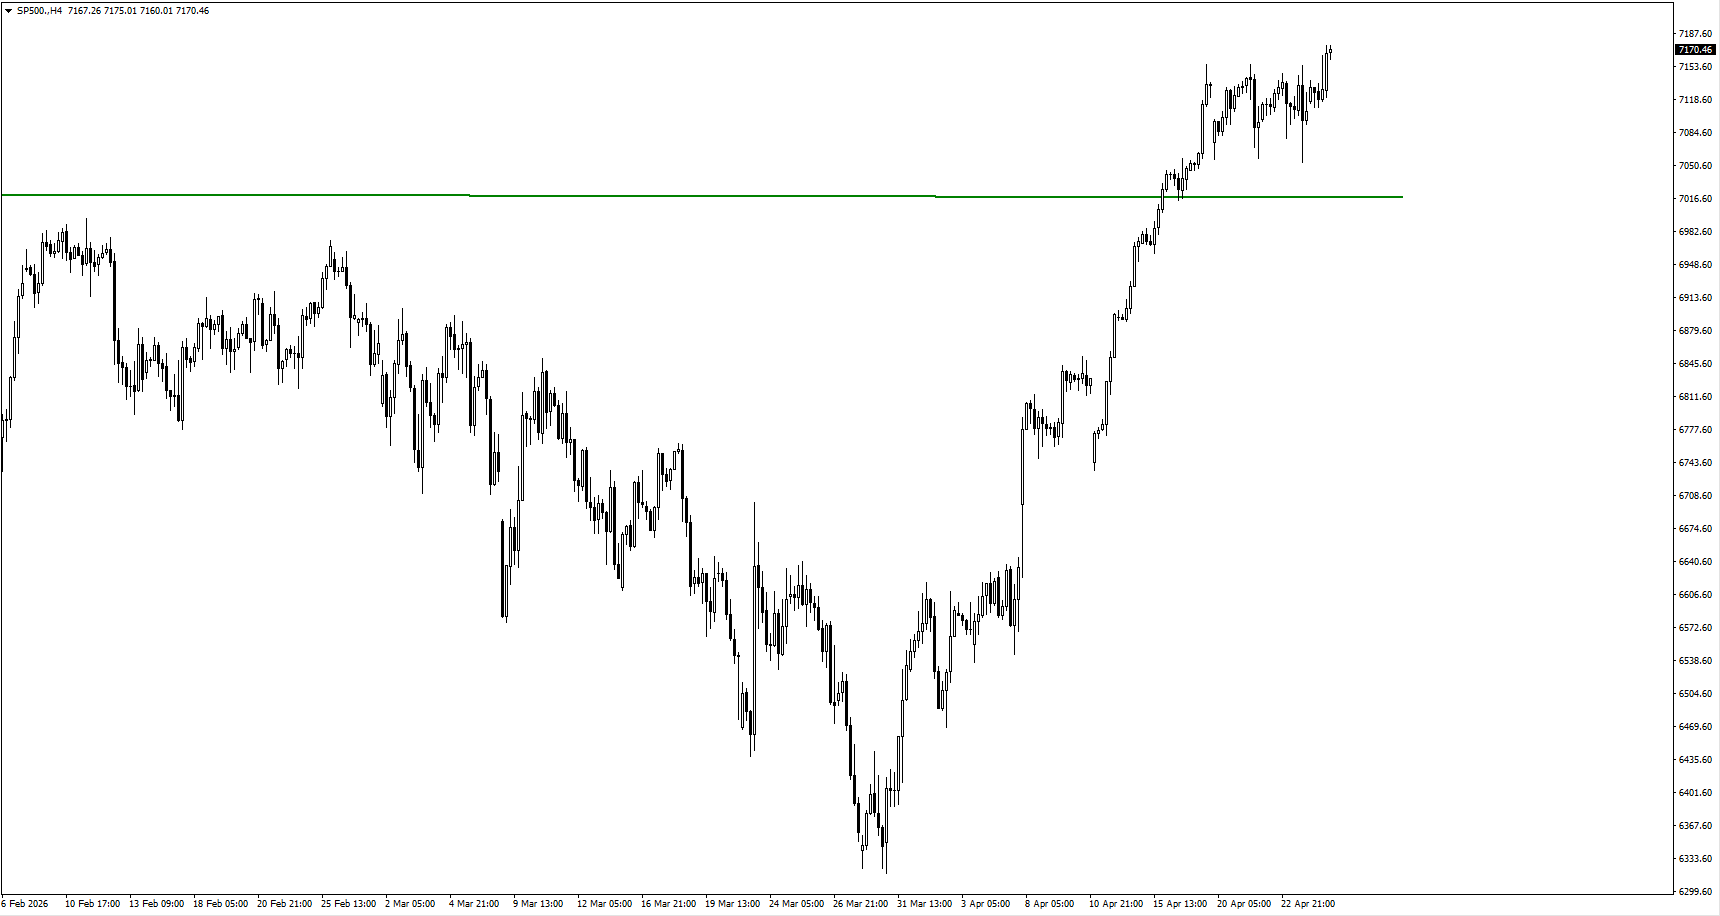
SP500
Risk appetite remains firm as SP500 trades near all-time highs before Core PCE Price Index.
Hotter US inflation could pressure SP500 and bring the 7053 swing low back into view.
Softer Core PCE Price Index and steady US Advance GDP would help SP500 keep the rally clean.
Oil strength may still cap SP500 upside if inflation expectations stay elevated.
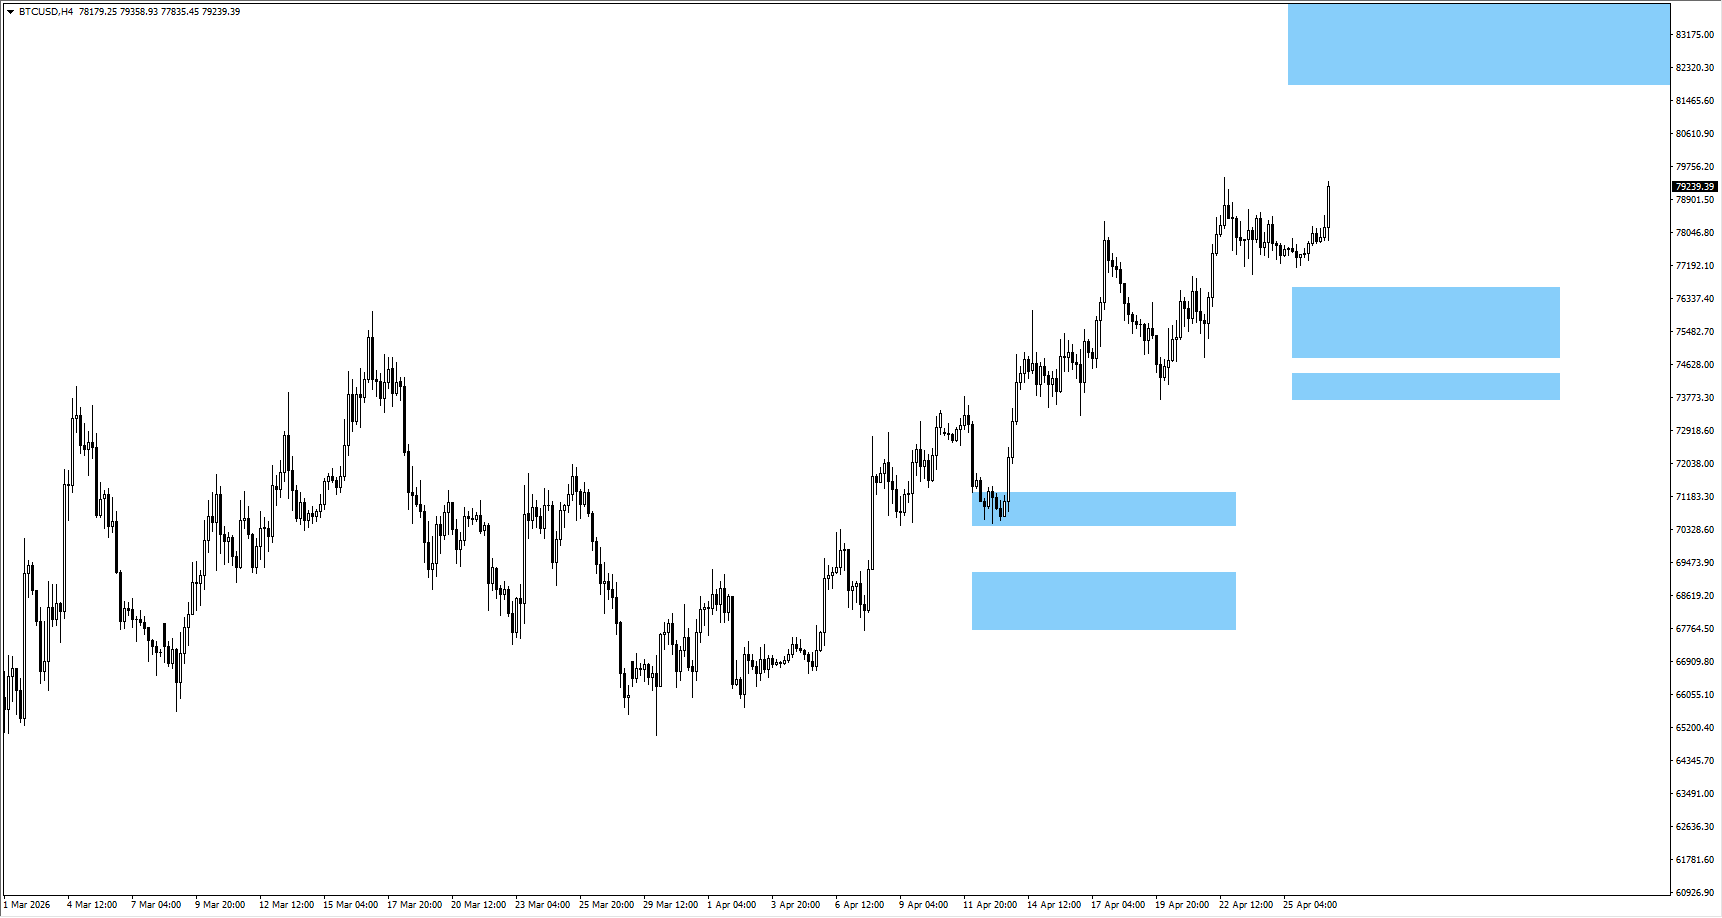
BTCUSD
Liquidity expectations continue to support BTCUSD as price trades higher toward 80000 before US GDP.
A weaker USDX after Core PCE Price Index could help BTCUSD target 82850.
Strong US data may trigger profit-taking near 80000 if BTCUSD traders cut rate-cut expectations.
A firm hold above 80000 would make 82850 the next cleaner continuation zone for BTCUSD.
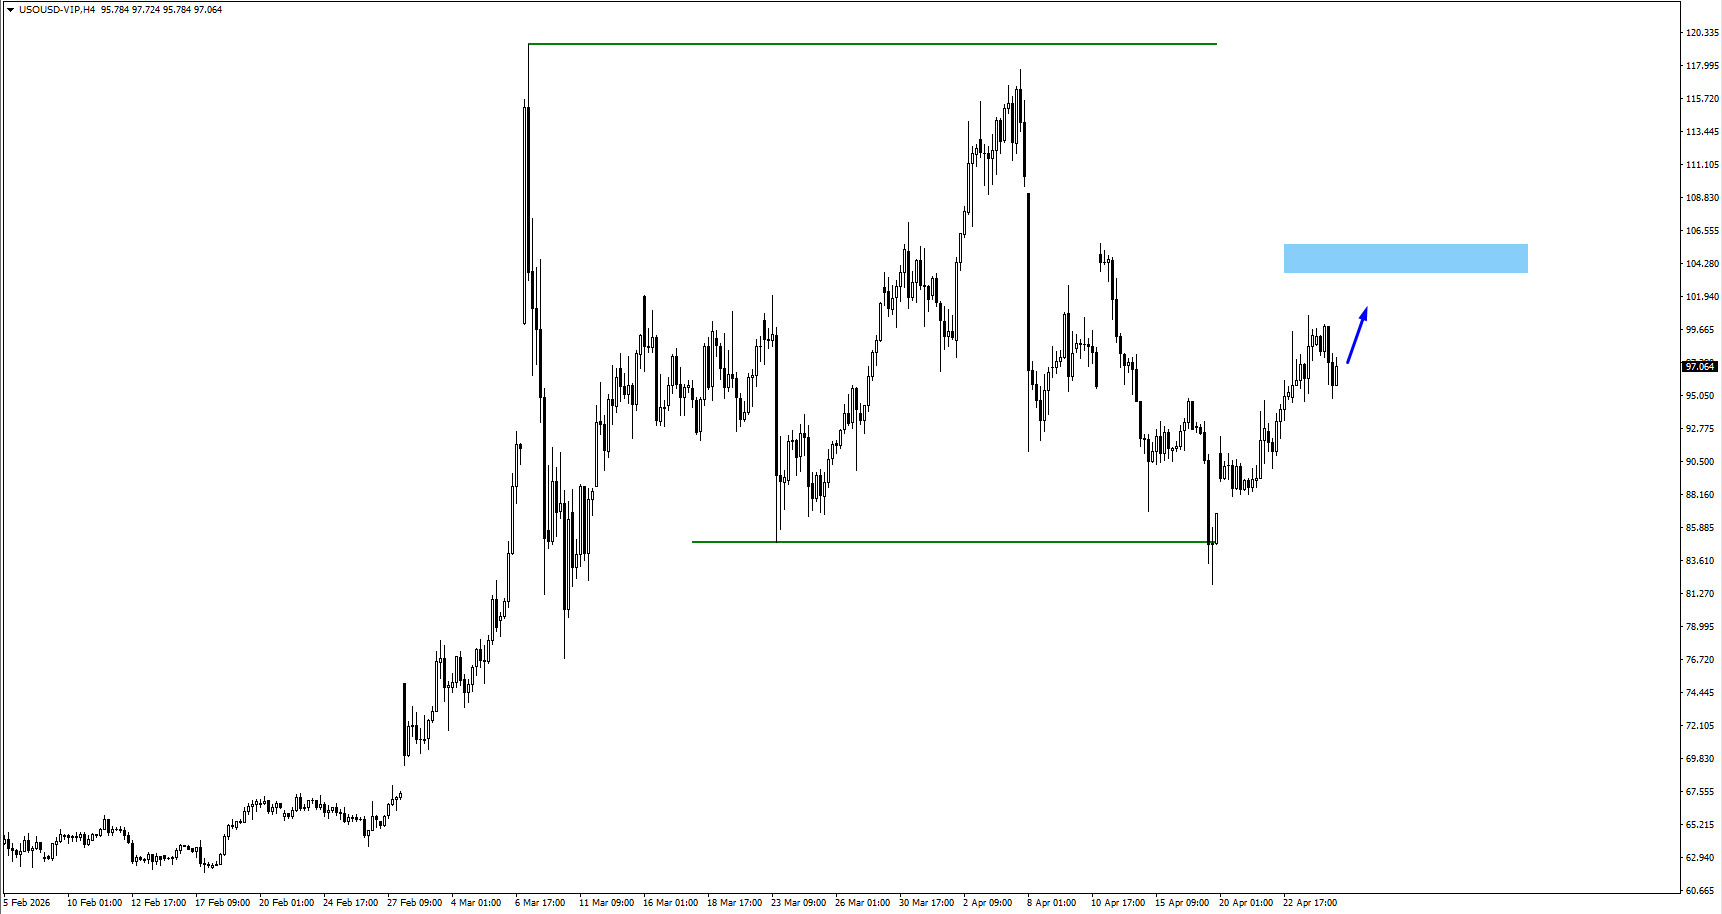
USOil
Supply risk continues to support USOil after weekend peace talks failed to materialise.
A move toward 103.75 remains possible if US-Iran tension keeps energy traders defensive.
Persistent USOil strength could complicate the Core PCE Price Index reaction by keeping inflation expectations sticky.
Cooling from 103.75 would give SP500 and BTCUSD more room to recover.
Bottom Line
The week ahead centres on whether US data confirms or challenges the market’s rate-cut narrative. Core PCE Price Index will drive the first reaction in USDX and XAUUSD, while US Advance GDP will test the soft-landing trade across SP500 and BTCUSD. Oil remains the inflation wildcard, and any further rise in crude can keep traders defensive even if the data offers temporary relief.
Create a live VT Markets account today to access our platform features, including market insights and educational content.
Trader FAQs
What Is Driving The Gold Price Outlook This Week?
XAUUSD is being driven by US Core PCE, US GDP, USDX direction and Fed leadership risk. Softer inflation could support gold, while hotter data may strengthen the dollar and pressure XAUUSD.
Why Does Core PCE Matter For Traders?
Core PCE is the Fed’s preferred inflation gauge, so it can reshape rate-cut expectations quickly. A lower reading may support SP500, BTCUSD and XAUUSD, while a hotter reading could lift USDX.
How Could Kevin Warsh Affect Fed Rate Expectations?
Kevin Warsh may support lower rates if productivity improves, but his stance still leans toward stricter inflation control. That makes aggressive rate-cut pricing harder if inflation remains above target.
What Could Move USDX This Week?
USDX will likely react to Core PCE, US Advance GDP and Fed leadership headlines. A break lower would help risk assets, while renewed dollar strength could pressure gold, equities and Bitcoin.
Can BTCUSD Continue Higher This Week?
BTCUSD can extend if softer inflation weakens USDX and keeps liquidity expectations alive. A firm hold above 80000 would keep 82850 in focus.
Start trading now – Click here to create your real VT Markets account
The People’s Bank of China set Monday’s USD/CNY central rate at 6.8579. This compares with Friday’s fix of 6.8674 and a Reuters estimate of 6.8282.
The PBoC’s main monetary policy aims are price stability, including exchange rate stability, and economic growth. It also works on financial reforms such as opening and developing the financial market.
Pboc Governance And Independence
The PBoC is owned by the state of the People’s Republic of China, so it is not autonomous. The Chinese Communist Party Committee Secretary, nominated by the Chairman of the State Council, influences the bank’s direction; Pan Gongsheng holds both this role and the governor post.
The PBoC uses tools including the seven-day reverse repo rate, the Medium-term Lending Facility, foreign exchange intervention, and the Reserve Requirement Ratio. The Loan Prime Rate is the benchmark rate and affects loan, mortgage, and savings rates, as well as the renminbi exchange rate.
China has 19 private banks. The largest are digital lenders WeBank and MYbank, backed by Tencent and Ant Group, and the policy allowing fully private domestic lenders began in 2014.
The People’s Bank of China (PBOC) set the yuan stronger than Friday’s fix but notably weaker than market estimates, signaling a managed depreciation. We see this as a carefully calibrated move to support the domestic economy without triggering alarm. This action suggests a bias towards allowing gradual currency weakness in the weeks ahead.
Macro Context And Policy Signal
The latest economic data gives context to this move, with China’s Q1 2026 GDP growth coming in at 4.8%, just below the official 5.0% target. Furthermore, March exports saw an unexpected year-over-year decline of 1.5%, putting pressure on authorities to boost competitiveness. This economic softness provides a clear incentive for the PBOC to guide the yuan lower against the US dollar.
Consequently, we anticipate the PBOC will use its policy tools, such as the Reserve Requirement Ratio (RRR), to support growth, possibly with a cut in the next month. Such a move would increase domestic liquidity but also add further downward pressure on the yuan. This widens the interest rate differential with the US, making yuan-denominated assets less attractive on a relative basis.
For derivative traders, this points toward positioning for a higher USD/CNY exchange rate. We believe buying call options on USD/CNY with strikes around the 6.95 level for the coming quarter is a prudent strategy. This approach provides exposure to potential yuan weakness while defining and limiting risk, which is vital given the PBOC’s history of intervention.
Looking back from our current perspective in 2026, we recall the market turmoil following the surprise devaluation in mid-2015. The PBOC’s current, more transparent and gradual approach suggests it is keen to avoid repeating the capital flight scare of that period. This reinforces our view of a controlled, rather than chaotic, depreciation.
Currently, one-month implied volatility for USD/CNH sits at a relatively low 4.5%, especially when compared to the brief spikes we saw in late 2025. This low volatility makes option strategies relatively cheap. Therefore, traders should consider call spreads to position for a gradual move higher in USD/CNY, offering a cost-effective way to profit from the expected trend.