EUR/USD stayed weak in Friday’s Asian session, trading around 1.1680–1.1675, just above a nearly two-week low set on Thursday. The pair remained under pressure after a three-day rise in the US Dollar.
A temporary ceasefire extension did not lead to progress in peace talks, with a US naval blockade of Iranian ports weighing on risk sentiment. Higher crude oil prices also raised inflation worries and supported expectations of a more restrictive US Federal Reserve stance, helping the Dollar.
Technical Picture On The Four Hour Chart
On the 4-hour chart, price hovered near the 200-period Exponential Moving Average, leaving the near-term tone neutral after the latest drop. However, Thursday’s move below the 38.2% Fibonacci retracement of the rise from the March swing low favoured sellers, while the RSI near 32 pointed to ongoing downside pressure.
The MACD remained slightly negative, suggesting limited bullish momentum despite the EMA area. Support levels were cited at the 50.0% retracement at 1.1648, then 1.1600 and 1.1532, ahead of 1.1445.
Resistance was seen at 1.1696 (38.2%), then 1.1755 (23.6%). The technical analysis section was produced with help from an AI tool.
The current weakness in EUR/USD, now trading near 1.0550, is being driven by familiar pressures. Renewed tensions in the Strait of Hormuz are reviving inflationary concerns, strengthening the US dollar as the market anticipates a more aggressive Federal Reserve. The fundamental picture is creating a significant headwind for the euro.
Fundamental Drivers And Strategy Outlook
We have seen Q1 2026 core CPI stubbornly hold at an annualized 3.1%, pushing futures markets to price in a nearly 75% probability of a Fed rate hike by July. This contrasts sharply with the European Central Bank, which is signaling a longer pause, widening the policy divergence between the two central banks. This gap in interest rate expectations is the primary force weighing on the pair.
Looking back from 2025, we saw a similar dynamic unfold in late 2021 when the pair broke down from the 1.1600s amid rising inflation and a hawkish Fed. That period, along with the slide below parity in 2022, taught us that these fundamental trends can exert sustained pressure. The historical precedent suggests that the path of least resistance remains to the downside.
For the coming weeks, buying EUR/USD put options provides a straightforward strategy to capitalize on expected weakness. A break below the 1.0500 support level could open the door for a test of the 1.0400 handle. Traders could also consider bear put spreads to define risk and reduce the initial premium outlay.
Any unexpected de-escalation of geopolitical tensions or a surprisingly soft US inflation report could trigger a short-term relief rally. We should watch the 1.0650 area as the first major resistance level on any bounce. However, the underlying trend suggests that any meaningful recovery is likely to be met with fresh selling pressure.
Gold prices in India fell on Friday, based on FXStreet data. Gold was priced at INR 14,169.53 per gram, down from INR 14,271.88 on Thursday.
Gold also declined to INR 165,273.20 per tola from INR 166,464.40 a day earlier. Other reference prices were INR 141,695.20 for 10 grams and INR 440,722.10 per troy ounce.
How FXStreet Calculates Indian Gold Prices
FXStreet derives Indian gold prices by converting international prices using USD/INR and applying local units. The figures are updated daily using market rates at the time of publication, and local prices may vary slightly.
Central banks are the largest holders of gold. World Gold Council data shows central banks added 1,136 tonnes of gold worth about $70 billion to reserves in 2022, the highest annual purchase since records began.
Gold often moves inversely to the US Dollar and US Treasuries, and can also move opposite to risk assets. Price drivers include geopolitical events, recession fears, interest rates, and shifts in the US Dollar because gold is priced in dollars (XAU/USD).
We’re seeing a slight dip in gold prices today, but this should be viewed against the powerful rally we saw through late 2024 and most of 2025. This short-term softness provides an opportunity to evaluate the larger forces at play. The metal’s role as a safe haven remains its most important quality in the current uncertain economic climate.
Key Factors Shaping The Gold Outlook
A primary support for gold continues to be aggressive purchasing by central banks. Looking back, we know they collectively added over 1,000 tonnes in 2023 and continued their strong buying through 2025 with purchases well over 800 tonnes. This ongoing demand from official institutions signals a sustained effort to diversify reserves away from the US Dollar.
The major question for us is how the U.S. Federal Reserve will act in the second half of this year. After a long pause, where rates were held high to combat the stubborn inflation we saw in 2025, markets are now pricing in a potential rate cut before year-end as economic growth slows. Any pivot to lower rates would be very supportive for gold, as it reduces the appeal of holding yielding government bonds.
Ongoing geopolitical instability and the unpredictable nature of global trade relations are also providing a solid foundation for gold. Risk aversion remains elevated, and investors are continuing to allocate funds to assets that can protect wealth during turbulent times. This has kept a steady bid under the market, preventing any significant sell-offs.
Given this backdrop, traders should consider positioning for renewed upside in gold over the next several weeks. Implied volatility on gold options has been rising, suggesting the market is anticipating a move, which makes buying call options an attractive strategy to capture potential gains. This allows for participation in a rally while defining risk, should the economic outlook change unexpectedly.
Gold prices in Malaysia fell on Friday, based on FXStreet data. Gold was MYR 595.13 per gram, down from MYR 599.33 on Thursday.
Gold was MYR 6,941.56 per tola, compared with MYR 6,990.50 a day earlier. Other listed prices were MYR 5,951.36 for 10 grams and MYR 18,510.05 per troy ounce.
How FXStreet Calculates Local Gold Prices
FXStreet converts international gold prices into Malaysian ringgit using the USD/MYR rate and local measurement units. The figures are updated daily at the time of publication and are for reference, as local prices may vary.
Central banks hold the most gold and added 1,136 tonnes worth about $70 billion in 2022, according to the World Gold Council. This was the highest annual total since records began, with China, India and Turkey among the countries increasing reserves.
Gold often moves inversely to the US Dollar and US Treasuries, and can also move opposite to risk assets. Geopolitics, recession fears, interest rates and the US Dollar can affect prices.
The small dip in gold prices should be viewed as a short-term fluctuation, not a change in the underlying trend. We see the broader economic environment becoming more favorable for the precious metal in the coming weeks. The key factors to watch are central bank actions and the direction of the US dollar.
Market Outlook For Gold
We are paying close attention to recent signals from the US Federal Reserve. After holding interest rates elevated through 2025 to control inflation, the minutes from the March 2026 meeting now suggest a potential pivot to rate cuts later this year as economic growth slows. Lower interest rates decrease the opportunity cost of holding non-yielding gold, which should boost its appeal.
This changing interest rate outlook is already weighing on the US Dollar, which has an inverse relationship with gold. The Dollar Index (DXY) has slipped from around 104 to 101.5 over the past month, providing a significant tailwind for dollar-denominated assets like gold. We expect this dollar weakness to continue as markets price in future Fed rate cuts.
Central bank demand remains a powerful force supporting the market. Following the record-breaking purchases we saw in 2022 and 2023, central banks globally added over 950 tonnes to their reserves in 2025, signaling a continued strategy of diversification away from the dollar. Early data from the first quarter of 2026 shows this trend is not slowing down.
Given these factors, derivative traders should consider recent price weakness as an opportunity. We see value in positioning for upward movement in the next two to three months, perhaps using call options to capitalize on potential gains. The latest March 2026 inflation reading, which came in at a persistent 2.9%, also reinforces gold’s role as a hedge against slowly eroding purchasing power.
To ensure fair trading conditions and manage market volatility during major economic announcements and special market conditions, VT Markets will apply temporary leverage adjustments on certain trading products during specific news periods and market opening/closing.
These adjustments are designed to protect clients from abnormal market fluctuations, sudden liquidity changes, and extreme price movements that may occur during high-impact events or reduced market liquidity periods.
1. Products Affected
The temporary leverage adjustment may apply to the following products:
• Forex
• Gold
• Silver
• Oil
• Indices
• Commodities (including XPT and XPD)
2. Adjusted Leverage During News Releases and Market Opening/Closing
During the specified period, maximum leverage will be adjusted as follows:
Forex: 200
Gold: 200
Silver: 50
Oil: 10
Indices: 50
Commodities: 5
Please note that each product with leverage already below the above will not be affected.
3. News Events That Can Trigger the Adjustment
Leverage adjustments may be applied during major economic announcements including:
• FOMC Interest Rate Decisions
• CPI (Consumer Price Index)
• GDP
• PMI / NMI
• PPI
• Retail Sales
• Non-Farm Payroll (NFP)
• ADP Employment Data
• Crude Oil Inventories
The above data is for reference only. Other significant macroeconomic releases from major economies may also be included.
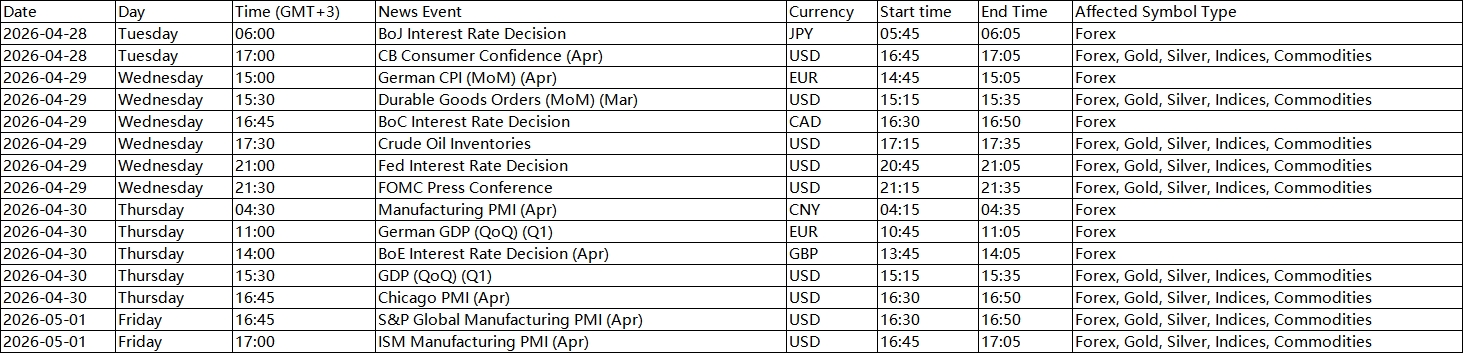
Please refer to the table below for details of the upcoming events and affected instruments:
All dates and times are stated in GMT+3 (MT4/MT5 server time).
4. Affected Period of News Releases and Market Opening/Closing
Temporary leverage adjustments apply during the following periods:
Economic News Period
• 15 minutes before the announcement
• 5 minutes after the announcement
Market Opening / Closing Period
• 3 hours before the weekly market closing (Friday)
• 30 minutes before daily market closing (Monday – Thursday)
Additional Conditions (Effective from 27 April 2026):
• If the following day is a full-day Gold market holiday, the Friday rule will also apply
→ Leverage will be reduced 3 hours before market close
• If the previous day is a full-day Gold market holiday, the Monday rule will also apply
→ Leverage will be reduced 30 minutes after market open for Gold, Silver, Oil, Forex, NAS100, SP500, DJ30, US2000
After the above period ends, leverage will automatically return to the original leverage.
5. Important Rules
• The adjustment only affects new positions open during the adjustment period
• Positions opened before the adjustment period will not be affected
• Once the adjustment period ends, original leverage will resume automatically
We strongly encourage clients to take these temporary leverage adjustments into account when planning trading strategies during high-impact economic events or special market conditions.
If you have any questions, please contact our support team: [email protected].
NZD/USD extended its pullback from the 0.5925–0.5930 area and fell for a second day. It traded near 0.5840 in Asia, close to the 200-day simple moving average.
The US dollar stayed firm for a fourth day as US-Iran tensions rose. Talks remain stalled over the Strait of Hormuz, supporting demand for the dollar.
Geopolitical Tensions Drive Safe Haven Demand
Donald Trump said on Tuesday that a US Navy blockade of Iranian ports will continue. Iran has demanded the full removal of the blockade before negotiations restart, and Trump ordered the Navy to shoot any boat laying mines.
Disrupted energy supplies have kept crude oil prices high and increased inflation concerns. Markets now price in only one 25-basis-point US rate cut in 2026, which supports the dollar and keeps pressure on NZD/USD.
In New Zealand, inflation data may limit further NZD losses. Annual inflation was 3.1% in the March 2026 quarter, above the 1–3% target band and above the 2% midpoint.
We see the NZD/USD pair is under considerable pressure, testing the critical 200-day moving average around the 0.5835 level. A decisive break below this technical floor in the coming days would likely signal a new leg down for the pair. This suggests that traders should prepare for increased downside momentum.
Options Strategies For A Bearish Outlook
The US Dollar’s strength is the primary driver, fueled by ongoing geopolitical tensions in the Strait of Hormuz. WTI crude oil prices have surged over 12% in the past month to trade above $95 a barrel, stoking global inflation fears and enhancing the dollar’s safe-haven appeal. We remember a similar dynamic during the Gulf tensions in late 2025, which also led to a significant flight to safety into the dollar.
This environment has dramatically shifted expectations for US Federal Reserve policy. The CME FedWatch Tool now shows that the market is pricing in just a 25% probability of a rate cut by June 2026, a sharp drop from over 60% a month ago. This expectation of higher-for-longer US rates provides a strong fundamental tailwind for the greenback against other currencies.
However, the Reserve Bank of New Zealand is facing its own inflation challenge, with the latest data showing a persistent 3.1% annual rate. Consequently, overnight index swap markets are now pricing in a 40% chance of an RBNZ rate *hike* by August to combat these price pressures. This hawkish stance from the RBNZ could provide some support for the Kiwi dollar, potentially limiting how far the pair can fall.
Given these opposing forces, buying NZD/USD put options offers a clear strategy to profit from a continued slide while defining risk. This allows traders to capitalize on the dominant US dollar trend, yet caps the maximum loss should the RBNZ’s hawkish policy cause a sudden rebound in the Kiwi. Volatility has picked up, making options more expensive, but they offer valuable protection against a sudden reversal.
For traders looking for a more cost-effective approach, we believe a bear put spread is a viable alternative. This involves buying a put option while simultaneously selling another put at a lower strike price, reducing the upfront premium paid. This strategy is particularly useful now, as it targets a specific downward range and lowers the cost of entry in a market with rising implied volatility.
USD/CHF extended gains for a fourth day and traded near 0.7870 in Asian hours on Friday, rising towards 0.7900. The US Dollar firmed on safe-haven demand amid uncertainty linked to the US–Iran conflict.
Lebanon is set to seek a one-month extension to the current ceasefire with Israel during a second round of direct talks in Washington. Israel’s UN Ambassador Danny Danon said the extension is “not 100%”.
Safe Haven Demand Lifts Dollar
The US military intercepted two Iranian oil supertankers accused of trying to evade a blockade, while Iran has threatened vessels in the Strait of Hormuz. US officials are preparing contingency plans to target Iran’s Strait capabilities if the ceasefire ends.
US Weekly Initial Jobless Claims rose to 215K from 212K. S&P Global PMI readings rose above expectations, with Manufacturing at 54.0 and Services at 51.3.
In Switzerland, the trade surplus narrowed to CHF 2.7 billion in March from a revised CHF 4.4 billion in February. Imports rose 10.1% month on month to CHF 19.6 billion, while exports increased 1% to CHF 22.4 billion.
Looking back at the analysis from over a year ago, we can see how the drivers for USD/CHF have fundamentally changed. The pair has since climbed significantly from the 0.7900 level and now trades around 0.9150. The acute risk aversion that was driven by the US-Iran conflict in 2025 has largely dissipated.
Shift Toward Policy Divergence
The intense focus on the Strait of Hormuz has subsided following de-escalation agreements in late 2025. This has removed the primary safe-haven bid that was supporting both the US Dollar and the Swiss Franc at the time. We see that the market’s attention has now shifted away from geopolitical flare-ups toward central bank policy divergence.
While US economic data was strong back then, we now see a more mixed but stable picture. Recent data shows weekly jobless claims holding steady around 210,000, but the latest ISM Manufacturing PMI has dipped to 49.8, indicating a slight contraction. However, the services sector remains a key pillar of strength, with the Services PMI posting a robust 53.5.
The speculation in 2025 of a more hawkish Swiss National Bank (SNB) has proven to be incorrect. With Swiss inflation having fallen to just 1.2% in the latest reading, the SNB became one of the first major central banks to begin an easing cycle, cutting its key policy rate to 1.50% last month. This stands in stark contrast to the US Federal Reserve, which is holding its policy rate steady.
This policy divergence creates a significant interest rate differential favouring the US Dollar, providing a strong tailwind for the USD/CHF pair. Derivative traders should consider selling out-of-the-money USD/CHF puts or implementing bull put spreads. This strategy takes advantage of the carry trade and the floor that the interest rate gap provides for the pair.
Implied volatility has also compressed significantly since the highs seen during the geopolitical tensions of 2025. This lower volatility environment makes it less expensive to construct longer-term bullish positions using call options. We believe traders can look at buying call options dated three to six months out to position for a continued, albeit slower, grind higher.
Eli Lilly (LLY) is tradable as a CFD asset at VT Markets.
Amid the current global market volatility, driven by geopolitical uncertainties and shifting economic conditions, traders are looking to make smarter choices with their portfolios. While assets like Gold have rallied in 2026, other sectors are proving their worth too, and Eli Lilly stands out as one to watch. The pharmaceutical giant has been making notable strides with product launches and recent mergers, even as it faces growing competition and legal challenges.
For CFD traders, Eli Lilly, like other pharmaceutical stocks that have grown in value, could offer a unique opportunity to navigate sector volatility and enhance your portfolio.
Eli Lilly’s Competitive Position – A Battle on Multiple Fronts
Dominance on the GLP-1 Drug Market
Eli Lilly’s dominance in the GLP‑1 drug market has been a major driver of its growth. Drugs like tirzepatide have been widely prescribed and are expected to continue generating significant revenue. However, Amazon’s recent move into pharmaceutical distribution is creating new competition in this area.
Amazon’s ability to disrupt traditional industries could lead to lower prices and new distribution models. Its pharmaceutical distribution could pressure Eli Lilly’s pricing power in the GLP-1 market. If Amazon reduces costs or alters distribution, Lilly’s share price may take a hit.
Implication on Sector
Competitive Headwinds for GLP‑1 Players: Eli Lilly could face increased competition not just from traditional pharma companies, but also from Amazon’s pricing and distribution strategies. This could impact its profit margins and long-term growth in this segment.
Indirect Impact on Smaller Biotechs: While companies like BioMarine, which are not directly involved in GLP‑1, may not face immediate threats, sentiment in the broader pharmaceutical sector is often influenced by movements in major players like Eli Lilly. A shift in Lilly’s fortunes could impact the stock prices of smaller biotechs as well.
Strategic M&A Moves For Wider Portfolio
While Amazon poses a competitive challenge, Eli Lilly is also focusing on long-term growth through strategic acquisitions. The company’s $7 billion acquisition of Kelonia Therapeutics positions Lilly to expand into oncology and cell therapy, opening up new avenues for growth.
This acquisition diversifies Lilly’s portfolio and broadening its reach into high-growth therapeutic areas, the intricacies could positions the company to compete in one of the most promising and competitive segments of the pharmaceutical industry.
What This Means for the Sector
Eli Lilly’s push into oncology may signal increased R&D competition in the biotech space. Companies like Vertex Pharmaceuticals, which are also active in rare disease therapies, could face increased competition in research and development. Investors may start shifting their focus toward larger companies with more extensive pipelines, which could impact the valuations of smaller biotechs.
Teva’s patent lawsuit could affect Lilly’s migraine drug portfolio, which is an important revenue stream for the company. If Teva’s claims gain traction, it could force Lilly to adjust its strategy, either through a settlement or by altering its product offerings.
What This Means for Investors
For traders, the legal uncertainty adds another layer of risk to an already volatile stock. While the outcome of the lawsuit is unclear, it’s something to keep an eye on, as any major legal shifts could influence Lilly’s market standing.
Markets today Assets available on VT, by TradingView
Could the pharma sector experience volatility?
Lilly’s performance has a significant impact on the broader pharmaceutical market. As one of the industry leaders, its stock movements influence investor sentiment in the biotech sector. When Lilly performs well, it often lifts the entire sector. The key question is whether Eli Lilly’s market leadership will hold up against these disruptions and whether the stock still has growth potential for traders looking to get into biotech.
The broader market is still dealing with inflation, supply chain issues, and other economic factors. These challenges impact all companies in the sector, including Lilly. For news on significant economic changes, stay ahead with our weekly market outlooks.
Getting into Biotech stocks
For traders new to the pharmaceutical sector, Eli Lilly offers both opportunities and risks. Keep a close watch on the following areas:
Regulatory Changes: Any shifts in policies like Medicare or FDA approvals could affect Lilly’s market position.
Amazon’s Moves: Monitor closely how this new wave of competition impacts the stock’s short-term performance.
M&A Activity: Watch acquisition succession and consider rotating their capital into larger pharma companies with broader pipelines.
Legal Risks: Keeping track of its legal outcomes may be supportive in catching the right shifts and turns of competing stocks
For traders, Lilly offers both opportunities and risks. The next few months will be crucial in determining whether it can maintain its leadership position. Traders should monitor how Lilly responds to competition, regulatory changes, and legal developments, as these factors will shape its future performance.
Monitor real-time CFD price action on LLY and other stocks like GSK, VRTX and more from the biotech or pharmaceutical sector on VT Marketstoday.
Tap for Takeaway
Why should traders consider Eli Lilly in 2026? Eli Lilly offers strong growth potential due to its leading position in the GLP-1 market, its recent acquisitions, and ongoing product innovations. However, rising competition and legal risks also present challenges.
How does Amazon’s entry affect Eli Lilly? Amazon’s move into GLP-1 distribution introduces new competition for Eli Lilly. This could impact pricing and distribution models, putting pressure on Lilly’s market share and profitability.
What impact does Eli Lilly’s acquisition of Kelonia have? The acquisition of Kelonia Therapeutics positions Eli Lilly for future growth in oncology and cell therapy. It expands Lilly’s portfolio, but also adds complexity and competition in these high-growth sectors.
What are the legal challenges facing Eli Lilly? Eli Lilly is dealing with a revived patent lawsuit from Teva Pharmaceutical regarding its migraine drug patents. This legal uncertainty could affect Lilly’s short-term stock performance and market position.
What should traders monitor in Eli Lilly’s stock? Traders should keep an eye on Eli Lilly’s response to competition, regulatory changes, M&A activity, and legal developments. These factors will determine the stock’s short- and long-term performance.
Start trading now – Click here to create your real VT Markets account
Japan’s Corporate Service Price Index rose to 3.1% year-on-year in March. This was up from 2.7% in the previous period.
The index measures changes in prices charged for services supplied by businesses. The latest reading shows faster annual service price growth in March.
Corporate Service Inflation Signals Boj Action
The jump in the Corporate Service Price Index to 3.1% is a major signal for us. This isn’t just about import costs anymore; it shows inflation is being driven by domestic services, a key metric the Bank of Japan watches. This reading, the highest in over two decades, heavily suggests the BoJ will be forced to act sooner and more decisively than the market expects.
We should anticipate a hawkish shift from the Bank of Japan, likely at their next meeting. This makes positioning for higher Japanese interest rates a priority in the coming weeks. Traders should consider paying fixed on Japanese yen interest rate swaps or directly shorting Japanese Government Bond (JGB) futures, as the 10-year yield has already started to test the 1.20% level on this news.
For currency derivatives, this data is strongly bullish for the yen. We expect the USD/JPY to come under significant pressure as rate hike expectations are priced in. Buying USD/JPY put options with a one-to-two-month expiry is a direct way to play this, especially as the pair falters around the 148.00 mark.
This inflationary pressure is a negative for Japanese equities, which have thrived on cheap money. Looking back at the market jitters during the initial policy normalization discussions in 2025, we anticipate a similar, but sharper, reaction now. We are buying put options on the Nikkei 225 index, as the prospect of real rate hikes threatens the record valuations we’ve seen this year.
US military officials are drawing up new plans to target Iran’s capabilities in the Strait of Hormuz if the current ceasefire fails, CNN reported on Thursday. The plans include “dynamic targeting” focused on assets around the Strait of Hormuz, the southern Arabian Gulf and the Gulf of Oman.
At the time of writing, West Texas Intermediate (WTI) was up 3.80% on the day at $95.45. Brent Crude Oil is a North Sea grade used as a benchmark for international prices and serves as a reference for about two-thirds of globally traded oil supplies.
Key Drivers Of Brent Pricing
Brent prices are driven mainly by supply and demand, with global growth affecting demand and conflicts, sanctions and political instability affecting supply. OPEC, a group of 12 oil-producing nations, sets production quotas at twice-yearly meetings, while OPEC+ adds ten non-OPEC members, including Russia.
US Dollar moves can affect oil prices because oil is traded in US Dollars. Weekly inventory reports from the American Petroleum Institute (API) and the Energy Information Agency (EIA) can shift prices; their results are within 1% of each other 75% of the time, and the EIA is a government agency.
With reports of the US developing plans targeting Iran’s Hormuz defenses, the geopolitical risk premium in crude oil is increasing sharply. A significant portion of the world’s oil supply transits the Strait of Hormuz, so any potential for conflict directly threatens a major supply chokepoint. This is why we have seen Brent crude surge past $101 per barrel this week, reacting to the heightened uncertainty.
Traders should prepare for a period of significant volatility over the next few weeks. The CBOE Crude Oil Volatility Index (OVX) has already risen to over 45, its highest point this year, showing the market is pricing in the possibility of large and sudden price swings. We believe that buying call options on crude futures is a viable strategy to capitalize on potential price spikes while defining and limiting downside risk.
This tension is occurring within an already tight market, which could amplify any price movements. OPEC+ held production quotas steady in its early April meeting, and the latest Energy Information Administration report showed a larger-than-expected inventory draw of 3.1 million barrels. This fundamental backdrop of constrained supply and solid demand provides strong underlying support for oil prices.
Historical Signals And Market Context
We have seen this scenario play out before, and it serves as a valuable reference. Looking back at 2025 from our current perspective, we saw how Houthi attacks in the Red Sea disrupted shipping and added a significant premium to oil prices for months. The tanker incidents in this same region back in 2019 also caused a nearly 20% single-day price jump, showing how quickly these situations can escalate.
Given that Brent crude is more sensitive to Middle Eastern supply disruptions than West Texas Intermediate, we expect the spread between the two benchmarks to widen. Traders could explore strategies that profit from this differential. Using option spreads instead of outright futures contracts may also be prudent to manage costs and protect against a sudden peaceful resolution that would erase the risk premium.
Japan’s national CPI excluding food and energy rose 2.4% year on year in March. This was down from 2.5% previously.
The recent drop in Japan’s core inflation to 2.4% suggests that price pressures may be peaking, slightly easing the urgency for the Bank of Japan to hike interest rates aggressively. We see this as a signal to pull back on bets for a rapid series of rate increases in the second quarter of 2026. This data point challenges the more hawkish sentiment that was building after the policy pivot we saw back in 2024.
Implications For Currency Strategy
For currency traders, this reinforces the appeal of the yen carry trade, where investors borrow in yen to invest in higher-yielding currencies. The interest rate gap with the U.S. is likely to remain wide, especially as the yen is currently trading near 160 to the dollar, a level not seen for decades. We should consider strategies that benefit from a weak or stable yen, such as selling out-of-the-money JPY call options against the dollar.
This environment is supportive for Japanese equities, so we should consider long positions on Nikkei 225 futures. A slower pace of rate hikes means corporate borrowing costs will not rise as fast as feared, which protects company profit margins that have already grown an average of 8% in the last reported quarter. Looking back at 2025, markets were far more nervous about the impact of rising rates on stocks, but that fear is now subsiding.
In the bond market, the slowing inflation figure implies that yields on Japanese Government Bonds (JGBs) may not climb as sharply as we previously modeled. The 10-year JGB yield, currently hovering around 1.1%, now seems less likely to push towards the 1.5% mark in the near term. This stability makes derivatives that bet on a contained yield range more attractive than outright short positions on JGB futures.
The latest “Shunto” spring wage negotiations also feed into this narrative, showing an average pay increase of around 4.6%. While this is historically strong and ensures real wage growth, it is a moderation from the landmark 5.2% hikes we saw in 2025. This cooldown in wage growth gives the central bank more breathing room to wait and see before its next policy move.