Gold (XAU/USD) fell to about $4,690 in the early Asian session on Friday, dropping below $4,700. Selling pressure followed a stronger US Dollar and higher oil prices, which raised inflation concerns.
The US military said it intercepted two Iranian oil supertankers that tried to evade its blockade, according to a Bloomberg report on Thursday. Iran made threats towards vessels in the Strait of Hormuz, while Washington continued a sea blockade on Iranian trade.
Rising Tensions In The Strait Of Hormuz
Later, US President Donald Trump said that if Iran does not move the oil, its infrastructure will explode. Iranian officials said they had not agreed to extend the truce and accused the US of violating it by keeping the blockade.
Oil prices rose this week on concern about supply disruption. Higher crude prices can lift inflation and reduce the likelihood of interest rate cuts, which can weigh on non-interest-bearing gold.
Central bank buying remained a support factor for gold. In 2025 and early 2026, emerging-market central banks led by China, Poland, India, and Turkey increased gold holdings to diversify reserves away from the US Dollar, and the People’s Bank of China added 5 tonnes in March, extending purchases to 17 consecutive months.
The story was corrected on April 23 at 23:30 GMT to state the move occurred in the early Asian session, not the European session.
Technical And Options Strategy Outlook
The recent drop below $4,700 is being driven by a strong US Dollar, which we’ve seen push the Dollar Index (DXY) above 106.5. This strength comes from persistent inflation, as the latest Consumer Price Index (CPI) report for March showed an unexpectedly high 3.6% annual rate. For the next few weeks, traders might see opportunities in bearish strategies, like buying put options, to ride this downward momentum.
Elevated oil prices, now near $115 per barrel due to the tensions in the Strait of Hormuz, are feeding these inflation concerns. This makes it more likely the Federal Reserve will keep interest rates higher for longer, further boosting the dollar and weighing on non-yielding gold. The market’s reaction could lead to significant price swings, so rising implied volatility might make strategies like long straddles attractive to capture a sharp move in either direction.
However, a strong floor of support exists because of central bank demand. We saw central banks purchase a massive 1,050 tonnes in 2025, extending the record-setting buying spree we witnessed in 2022 and 2023. This ongoing accumulation, particularly from China, means that any significant dip towards the $4,600 level will likely be viewed as a major buying opportunity by these large players.
This dynamic of a strong dollar versus strong physical demand creates a tense, range-bound environment. We saw a similar situation in the early 1980s when high interest rates capped gold’s price despite global uncertainty. Traders could consider risk-defined strategies like a bull call spread, which allows for profiting from a potential rebound off the central bank support while limiting losses if the dollar continues to strengthen.
The UK GfK Consumer Confidence index was -25 in April. This was below the forecast of -24.
The drop in UK consumer confidence to -25, below what was expected, is a clear signal of growing pessimism. People are feeling worse about their personal finances and the broader economy. This sentiment directly points to lower household spending in the months ahead.
FTSE 250 Downside Hedge
We should consider buying put options on the FTSE 250 index, which is more exposed to the domestic UK economy than the international-facing FTSE 100. This move is supported by recent Office for National Statistics data showing retail sales volumes have been stagnant over the last quarter, indicating consumers were already cautious. A fall in confidence could turn that stagnation into a decline.
This weak domestic data also makes shorting the British Pound against the US dollar an attractive position. The prospect of a slowing UK economy reduces the likelihood of interest rate hikes from the Bank of England. We can use futures or options on GBP/USD to capitalize on a potential weakening of the currency.
Looking back, we saw a similar, though more severe, plunge in confidence during the inflation spike of 2022, when the GfK index hit a low of -49 before the economy stalled. This current reading, being stubbornly low, suggests that economic momentum is at risk.
Given this fresh uncertainty, we can expect market volatility to increase.
Volatility Strategy For UK Consumers
This makes buying straddles or strangles on individual UK consumer stocks, such as major retailers or travel companies, a viable strategy. These positions would profit from a significant price move in either direction as the market digests this negative outlook.
Brent crude rose 99 cents, or 0.94%, to $106.06 a barrel at 0410 GMT, while WTI gained 71 cents, or 0.73%, to $96.56.
Brent rose 17.13% over the week, while WTI gained 15.13%, marking the second-largest weekly gain since the war began.
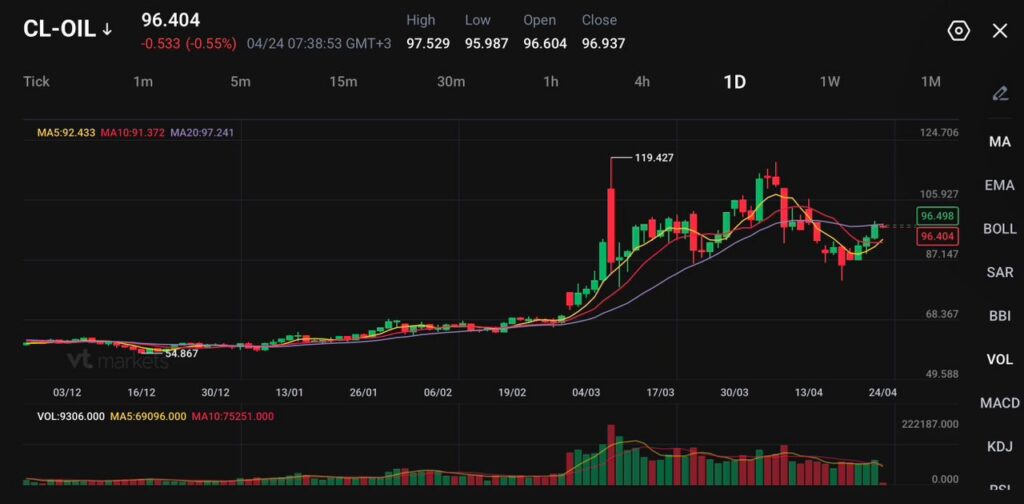
CL-OIL trades near 96.404, down 0.533, or 0.55%, with the 20-day moving average at 97.241 acting as the first key barrier.
Oil has moved from a fear trade into a full supply-risk trade. Brent crude futures rose 99 cents, or 0.94%, to $106.06 a barrel at 0410 GMT, while West Texas Intermediate futures rose 71 cents, or 0.73%, to $96.56. Reuters later reported Brent near $106.30 and WTI near $96.92 as traders kept pricing renewed stress around the Strait of Hormuz.
A US-sanctioned supertanker laden with Iranian oil appeared to be attempting to cross the Strait of Hormuz on Friday, with traffic through the waterway otherwise at a virtual standstill https://t.co/ECcE4NGrUe
The weekly move shows how quickly the market has repriced the risk. Brent rose 17.13% through the week, while WTI rose 15.13%, the second-largest weekly gain since the war began. Both benchmark contracts settled up more than 3% on Thursday. They jumped $5 a barrel after reports that air defences were engaging targets over Tehran and that a power struggle had widened between Iran’s hardliners and moderates.
The key driver is the Strait of Hormuz. The closure after the start of the US-Israeli war on Iran has cut around 20% of the world’s supply of oil and liquefied natural gas. Iran also posted a video on Thursday of commandos in a speedboat storming a huge cargo ship after the collapse of peace talks, again showing its grip over a route through which 20% of global oil and gas usually flows.
Iran's use of a swarm of small, fast boats to seize two container ships near the Strait of Hormuz could undermine suggestions that US forces have disabled its naval threat and reveals the challenges facing reopening the oil export route https://t.co/uqyZNLjzU4pic.twitter.com/CjD9x4dhmi
The oil market is not only pricing barrels. It is pricing freight delays, war insurance, refinery risk, LNG stress, and the chance that fuel inflation moves back into consumer prices. The International Energy Agency said that just over 112 bcm of LNG transited the Strait in 2025, accounting for almost 20% of global LNG trade. It also said almost 90% of those volumes went to Asia, while just over 10% went to Europe.
Consumers are already feeling the effects of the closure of the Strait of Hormuz with energy prices surging around the world. But what if the crisis is signaling a longer-term global power shift?@DanielYergin tells @TheStalwart and @tracyalloway on the Odd Lots podcast that… pic.twitter.com/huzwhppj9K
That keeps Asia more exposed to any long closure. Reuters reported that Asia’s LNG imports for April are expected to fall to 19.03 million metric tons, with Qatar’s contribution dropping from an average of more than 6 million tons before the war to just 800,000 tons. China’s April LNG imports are expected to fall to 3.36 million tons, the lowest since 2018, while spot LNG prices rose to $25.30 per mmBtu in March before easing to $16.05 per mmBtu.
For markets, that creates a clear chain reaction. Higher crude can lift headline inflation, slow the pace of rate-cut bets, support the US dollar, and pressure equity sectors tied to transport, airlines, manufacturing, and consumer spending. Energy producers may benefit from higher prices, but the broader equity market may struggle if traders start to treat oil strength as an inflation tax rather than a growth signal.
Diplomacy Offers Relief, But Not Certainty
The ceasefire narrative has grown more uncertain, with mixed signals from both diplomacy and military positioning. While there are indications of progress, the tone remains cautious, with no clear timeline for a broader resolution.
Recent developments point to efforts to extend de-escalation in parts of the region, which may help stabilise sentiment in the near term. However, the underlying tensions have not fully eased, and key actors continue to signal that escalation remains on the table if conditions shift.
President Donald Trump said the Lebanon-Israel ceasefire was extended for three weeks, adding he looked forward to hosting Israeli PM Benjamin Netanyahu and Lebanese President Joseph Aoun soon https://t.co/YLQm66lBjzpic.twitter.com/UO8UpIdbWw
That leaves markets in a familiar position. Diplomatic headlines may be enough to cool immediate panic and prompt profit-taking, but they are not yet strong enough to remove the underlying supply risk embedded in prices.
Technical Analysis
CL-OIL is trading near 96.40, stabilising after a recent pullback from the 105–106 resistance zone, with price attempting to base following a sharp retracement from earlier highs. The broader structure remains elevated after the strong rally from the mid-80s, but short-term momentum has cooled.
From a technical standpoint, the bias is neutral with a slight bullish tilt. Price is holding just above the 5-day (92.43) and 10-day (91.37) moving averages, which are beginning to flatten and act as near-term support. However, the 20-day (97.24) is now acting as overhead resistance, indicating that upside momentum has slowed and the market is consolidating.
Key levels to watch:
Support: 95.00 → 91.50 → 87.00
Resistance: 97.50 → 100.00 → 105.90
The market is currently testing the 97.50 resistance area, which aligns with the 20-day average and recent consolidation highs. A break above this level could trigger a move toward the 100.00 psychological level, with further upside potential if buyers regain control.
On the downside, 95.00 is acting as immediate support. A break below this level could expose 91.50, where stronger buying interest may emerge given the prior base formation.
Overall, oil is transitioning into a consolidation phase after a volatile rally, with price compressing between support and resistance. The near-term focus is on whether buyers can reclaim 97.50, or if the market rolls over and retests the lower support zone.
Market Implications For The Next Session
Oil above $100 would keep inflation risk at the front of the market. That would likely support defensive dollar demand, weigh on rate-sensitive equities, and push traders to reassess bond yields if fuel prices start feeding back into consumer inflation expectations.
A move back below 92.433 and 91.372 would ease the pressure. It would suggest traders are fading the war premium and looking for proof of real supply loss before pushing prices higher again. In that case, equities could breathe, while energy shares may lose some near-term momentum.
For now, the cautious forecast favours a volatile range between the low-to-mid $90s and the $105.927 resistance zone. A daily close above 97.241 keeps the recovery alive. A break below 95.987 warns that profit-taking is starting to overpower the Hormuz bid.
Learn more about trading Energies on VT Markets here.
Trader Questions
Why Are Oil Prices Rising?
Oil prices are rising because traders are pricing in renewed military risk in the Middle East. Iran released footage of commandos boarding a cargo ship in the Strait of Hormuz, while reports also said Tehran’s air defences had engaged “hostile targets.”
Brent crude rose 99 cents, or 0.94%, to $106.06 a barrel at 0410 GMT. West Texas Intermediate rose 71 cents, or 0.73%, to $96.56.
Why Does The Strait Of Hormuz Matter For Oil?
The Strait of Hormuz matters because around 20% of the world’s oil and liquefied natural gas normally flows through it. Any closure or disruption can quickly reduce available supply, raise shipping risk, and add a supply-risk premium to oil prices.
The closure after the beginning of the US-Israeli war on Iran cut around 20% of the world’s supply of oil and liquefied natural gas, which has kept energy markets highly sensitive to fresh headlines.
How Much Did Oil Prices Rise This Week?
Brent rose 17.13% over the week, while WTI rose 15.13%. That marked the second-largest weekly gain since the war began.
Both benchmark contracts also settled up more than 3% on Thursday and jumped $5 a barrel after reports of air defences engaging targets over Tehran and tensions inside Iran’s political leadership.
Could Oil Prices Rise Further?
Oil prices could rise further if US-Iran talks fail to make key progress by the end of April and fighting resumes. Haitong Futures warned that oil could climb to new highs for the year if the ceasefire turns into a preparatory phase for war.
From a technical view, CL-OIL needs to hold above the low-to-mid $90s and break above the 20-day moving average at 97.241. A stronger move above 105.927 could reopen the path toward the previous spike near 119.427.
What Oil Price Levels Should Traders Watch?
Traders should watch 97.241 first, as this is the 20-day moving average on the CL-OIL daily chart. A daily close above this level would show stronger short-term buying pressure.
Support sits near 95.987, followed by the 5-day moving average at 92.433 and the 10-day moving average at 91.372. A break below those levels could weaken the rebound and expose 87.147.
Start trading now – Click here to create your real VT Markets account
USD/PHP traded just below its March 30 record high of 63.8300, as higher crude oil prices weighed on the peso despite a tighter policy move by Bangko Sentral ng Pilipinas (BSP). BSP raised its policy rate by 25 bps to 4.50%, citing a worsening inflation outlook linked to conflict in the Middle East.
About half of analysts polled by Bloomberg expected a 25 bps rise, while the rest forecast no change. The move was BSP’s first rate increase since October 2023, after an easing phase that delivered 225 bps of cuts over the past 20 months.
BSP Governor Eli Remolona said the decision was not unanimous and that a 50 bps increase was also considered. He indicated further rate rises may follow.
BSP now forecasts average headline inflation will exceed its 4.0% ceiling in both 2026 and 2027. The report notes the article was produced with the help of an AI tool and checked by an editor.
The central bank’s decision to raise rates to 4.50% is being ignored. With Brent crude recently hitting a two-year high of $112 per barrel amid ongoing Middle East tensions, the market is focused on the Philippines’ high import bill. We are seeing the USD/PHP pair test the 63.83 record high from last month as a direct result.
We believe the central bank is now playing catch-up after an aggressive easing cycle that ended in late 2025. Their own projections now show inflation breaking the 4.0% ceiling for both this year and next, suggesting this small 25 basis point hike will not be enough to support the currency. The market is likely anticipating more forceful action will be needed down the line.
The problem is compounded by a strong US dollar, as the latest American inflation report came in higher than expected at 3.6%, pushing back any hope of a Federal Reserve rate cut. This global environment makes it difficult for emerging market currencies like the peso to find any support. For traders, this means the peso’s weakness is not just a local story.
Given the conflict between central bank policy and powerful external factors, we expect volatility to rise significantly. Implied volatility on three-month USD/PHP options has already climbed to 7.9%, its highest level this year, indicating traders are preparing for sharp moves. Strategies that profit from this uncertainty, such as buying options, should be considered.
The path of least resistance for USD/PHP seems to be upward, potentially breaking through the 64.00 psychological barrier in the coming weeks. As the Philippines imports nearly all of its oil, a sustained period of high energy prices will continue to pressure its trade balance and the peso. We see buying call options as a prudent way to position for further peso depreciation while limiting potential downside.
Written on April 24, 2026 at 5:32 am, by josephine
NZD/USD traded lower near 0.5860 on Friday, 24 April, as the US Dollar stayed supported despite a small easing in broader momentum. Support for the Dollar came from firm US data and continued geopolitical uncertainty.
Weekly Initial Jobless Claims rose to 215K from 212K, pointing to a steady US labour market. S&P Global PMIs beat expectations, with Manufacturing at 52.1 and Services at 53.7, keeping both sectors in expansion.
Dollar Support From Data And Geopolitics
Higher yields followed the data and helped the Dollar. In geopolitics, reports denying Iranian Parliament Speaker Mohammad-Bagher Ghalibaf’s resignation from a negotiating role added to uncertainty over Middle East talks.
On the four-hour chart, NZD/USD was at 0.5858 with a mild bearish bias. The RSI was near 37, showing selling pressure but not an oversold reading.
Resistance levels were marked at 0.5871 and 0.5879, then 0.5907 and 0.5930, with a stronger barrier at 0.5965. Support was seen at 0.5847, then 0.5840 and the 100-period SMA near 0.5833, with a break below this area pointing to further losses.
Given the pressure on the NZD/USD, we see the US Dollar’s strength as the dominant factor, driven by solid American economic performance. The recent data, including weekly jobless claims at 215K and strong S&P Global PMIs, confirms a resilient economy. This environment supports higher US yields, making the dollar a more attractive asset.
Inflation And Options Positioning
We believe this trend is further supported by the latest US Consumer Price Index data for March, which showed inflation holding at 3.6%, keeping the Federal Reserve on a hawkish path. Additionally, retail sales grew by a robust 0.8% last month, underscoring the view of a strong US consumer. This fundamentally weighs on the Kiwi dollar’s value relative to the greenback.
For the coming weeks, derivative traders could consider buying put options on the NZD/USD with a strike price just below the current market, perhaps around 0.5850. This strategy would capitalize on a break of the immediate support levels noted in the technical analysis. The defined risk of an options contract is a key advantage if the market sentiment unexpectedly reverses.
Alternatively, for those anticipating that any upward movement will be limited, a bear call spread is a viable strategy. We could structure this by selling a call option with a strike price near the 0.5930 resistance level while buying a further out-of-the-money call to cap risk. This position would generate income if the currency pair remains below that key technical barrier.
We saw a similar dynamic play out in the third quarter of 2025 when the pair dropped from over 0.62 to below 0.59 following a series of stronger-than-expected US jobs reports. That period demonstrated how sensitive this pair is to widening interest rate differentials driven by US economic outperformance. This historical precedent suggests the current downward pressure has legs if US data continues to surprise to the upside.
Bank Indonesia kept the BI Rate at 4.75% for a seventh consecutive meeting, in line with expectations. It also signalled readiness to tighten monetary policy further if needed to support the rupiah and price stability.
The statement placed more emphasis on inflation expectations and currency volatility. Since early April, USD/IDR has stayed above 17,000.
Rising Focus On Inflation And Currency Stability
The rupiah has fallen 2.5% against the US dollar since the Iran war began. Factors mentioned include concerns about central bank independence, the dismissal of former Finance Minister Sri Mulyani, and the possibility of MSCI downgrading Indonesia to frontier market status.
With Middle East uncertainty and inflation risks, Bank Indonesia may keep a cautious approach on interest rates. It may instead support the rupiah through other measures such as spot and NDF intervention and SRBI issuance.
Bank Indonesia is now more hawkish to defend the Rupiah, even though it kept the BI Rate at 4.75%. The pressure is clear with USD/IDR trading above the 17,000 psychological barrier. This pivot comes as recent data shows inflation has accelerated to 4.5% year-over-year, largely driven by higher energy import costs.
The IDR’s weakness, down about 2.5% since the Iran conflict escalated, is not just about a strong dollar. Lingering memories of the abrupt dismissal of the finance minister back in 2025 and the ongoing risk of an MSCI market downgrade continue to weigh on sentiment. Our data shows foreign exchange reserves fell by over $7 billion in the past month to $133 billion, signaling BI is already heavily intervening in the market.
Positioning For Volatility Ahead
We believe this environment is ripe for higher volatility, not clear directional bets. The central bank’s words and actions are creating a two-way risk, with potential for sharp but temporary IDR rallies on intervention news. One-month implied volatility for USD/IDR options has already surged past 10%, reflecting this deep uncertainty about the currency’s next move.
Traders should consider using options to manage this uncertainty. Buying USD calls (or IDR puts) offers a way to position for further Rupiah weakness while defining risk. Alternatively, selling out-of-the-money USD calls with strikes around 17,500 could be a viable strategy, betting that BI’s intervention will cap any extreme moves.
The interest rate derivatives market is now pricing in at least a 50% chance of a 25 basis point hike by the third quarter. This is a stark contrast to the easing cycle we saw through much of 2025, when rates were cut from the 6.25% peak of 2024. This repricing suggests that even if BI uses other tools first, the market is preparing for an eventual rate hike to restore stability.
Higher energy prices and gas market stress have not yet pushed key ASEAN economies into unsustainable external deficits. Bank Indonesia (BI) is focused on defending the Indonesian Rupiah (IDR) and strengthening Indonesia’s balance of payments, while ASEAN as a region still runs a modest trade surplus.
BI’s interest rate decision was broadly in line with expectations, and it reiterated an “all-out” effort to maintain IDR stability. BI said intervention would remain targeted and that the balance of payments “must be strengthened” to limit the impact of the war.
Indonesia’s current account forecast was revised down from a deficit of 0.5% of GDP to 1.3%. The piece says emerging market net energy importers, including Indonesia’s Southeast Asian peers, may need to address balance of payments risks in central bank decisions.
Across Indonesia, Malaysia, Thailand, Vietnam, the Philippines and Singapore, the combined rolling six-month trade surplus is about $25bn. Around 60% of that surplus is attributed to Singapore.
The shortfall is described as manageable relative to reserve levels, with focus on the pace of reserve drawdown and market volatility. Reserves are presented as tools to smooth volatility, with adjustment mainly via demand measures and fiscal steps to restrain activity.
Bank Indonesia’s commitment to an “all-out” defense of the rupiah suggests a cap on currency weakness in the near term. With recent March 2026 data showing a $4 billion drop in foreign exchange reserves, it is clear they are actively selling dollars to support the Indonesian Rupiah (IDR). Derivative traders should consider selling call options on USD/IDR, as the central bank’s intervention will likely prevent the pair from breaking significantly higher than the 16,500 level it has been testing this month.
The key risk across ASEAN is not a sudden collapse but a rise in volatility as central banks use their reserves to smooth out market shocks. The latest trade figures for the ASEAN-6 show the combined surplus has narrowed to $22 billion, indicating the pressure from high energy costs is mounting. This situation makes buying straddles or strangles on pairs like the Thai baht (THB) and Philippine peso (PHP) a logical way to trade the expected price swings without betting on a specific direction.
We believe the use of foreign reserves is a short-term fix, and the real correction will have to come from slower economic activity. This is a trend that began to emerge in the second half of 2025, when fiscal restraint became a more common topic among regional policymakers. Traders should watch for any new fiscal measures designed to curb demand, as this would signal a more sustained, medium-term weakness for these currencies.
The persistence of Brent crude prices around $95 per barrel this quarter highlights the divide between the region’s energy importers and exporters. This presents a clear opportunity for a relative value trade, such as going long the Malaysian ringgit (MYR) while shorting the Indonesian rupiah (IDR). This position bets that Malaysia’s stronger balance of payments, supported by energy exports, will allow the ringgit to outperform its neighbor’s currency in the coming weeks.
Written on April 24, 2026 at 5:23 am, by josephine
Silver fell after failing to break the 50-day SMA at $78.73, with price action influenced by geopolitical news. XAG/USD traded at $75.40, down 3%, and the daily chart showed a bearish engulfing pattern.
Support was near the 20-day SMA at $75.28, while the $75.00 level was in focus on the downside. The move also came after price dropped through Fibonacci levels that had helped define the short-term trend.
Hourly Chart Breakdown
On the hourly chart, silver tested the 61.8% Fibonacci retracement from $78.38 to $74.19, then extended losses beyond the 38.2% level. Further weakness below $75.00 and the day’s low could open the April 13 low at $73.57 and the week’s low at $72.61.
Silver prices can be affected by geopolitics, recession concerns, interest rates, and shifts in the US Dollar because XAG/USD is dollar-priced. Demand from electronics and solar, supply, recycling, and the Gold/Silver ratio can also influence moves.
The price of silver has pulled back sharply after failing to break through resistance at the 50-day moving average, which currently sits around $32.50. This rejection has formed a classic bearish-engulfing pattern on the daily chart, a signal that suggests further losses may be coming in the near term. We are now seeing the price consolidate around $31.50 as sellers appear to have gained control.
For traders, the immediate focus should be on the support level at the 20-day moving average near $31.20, followed by the key psychological mark of $31.00. A decisive break below these levels would confirm the downtrend and could open the door for a drop toward the early April lows around $30.50. Options traders might consider buying puts or establishing bear put spreads to capitalize on this potential downward move.
This price weakness is occurring alongside signs of a slowing industrial sector, as the latest global manufacturing PMI data for March 2026 showed a slight dip to 49.8. Given that industrial use in electronics and solar panels accounts for over 50% of silver demand, any economic slowdown poses a significant headwind. We saw a similar pattern in late 2025 when softening industrial orders led to a temporary but sharp correction in the silver price.
Dollar Rates And Relative Value
Furthermore, recent commentary from Federal Reserve officials has been unexpectedly hawkish, pushing the US Dollar Index back above 105.5. A stronger dollar makes silver more expensive for holders of other currencies, which typically suppresses its price. This is a dynamic we remember well from periods in 2025 when uncertainty over the path of interest rates kept silver’s advances in check.
We are also watching the gold-silver ratio, which has climbed back to 85, a level higher than its historical average. This indicates that in the current market, investors are favoring the relative safety of gold over silver. While this could suggest silver is undervalued in the long run, for the coming weeks it signals that momentum has shifted away from the white metal.
Standard Chartered’s Hong Kong SME Leading Business Index fell to 43.3 in Q2, from 43.9 in Q1. The reading points to weaker sentiment among small and medium-sized firms.
The “global economic outlook” sub-index dropped by 15.5 points, and the “raw materials” cost sub-index fell by 10.4 points. The moves were linked to higher oil prices and tensions in the Middle East.
Subindex Signals And Near Term Drivers
The “investment” sub-index rose by 1.4 points, while the “number of staff” sub-index edged down by 0.1 point. Both measures stayed above 50, indicating steadier activity in these areas.
The “sales” sub-index improved by 1.1 points and the “profit margin” sub-index increased by 1.9 points. However, both remained below 50.
We are seeing a familiar pattern emerge that reminds us of the situation back in the second quarter of 2025. At that time, the Hong Kong SME index fell to 43.3 as business sentiment was hit hard by worries over Middle East tensions and surging oil prices. This created a clear sense of uncertainty for the global economic outlook.
Today, Brent crude is again testing the $95 per barrel mark following the latest OPEC+ supply decisions, creating similar headwinds for raw material costs. The Hang Seng Volatility Index has subsequently climbed over 5% in the last two weeks, showing that fear is creeping back into the market. This echoes the sharp drop we saw in the ‘global economic outlook’ sub-index during that period in 2025.
Options Positioning For A Two Speed Market
However, just as we observed last year, this global anxiety seems disconnected from the regional recovery story. China’s recently announced Q1 2026 GDP growth of 4.8% beat expectations, and mainland tourist spending in Hong Kong is up 12% year-on-year for the first quarter. This points to the same underlying confidence in the domestic and mainland economies that kept SME investment and hiring intentions firm in 2025.
For traders, this disconnect suggests opportunities in buying call options on companies heavily exposed to the Greater Bay Area’s resilience. The Hang Seng China Enterprises Index (HSCEI) appears undervalued if you believe local strength will ultimately outweigh global fears. We should look at short-dated calls to play a potential relief rally over the next few weeks.
At the same time, the elevated volatility makes index-level protection attractive as a hedge against a broader market dip. Buying put options on the Hang Seng Index (HSI) can provide cost-effective insurance if the oil price shock does spill over into a wider slowdown. This allows us to protect our portfolios from the exact fears that dragged down SME sentiment in 2025.
Considering this tension, we should also explore option spreads to manage risk. A bull call spread on a select group of resilient Hong Kong stocks allows for profiting from a modest upside move while capping our initial cost. This strategy is well-suited for a market where local confidence is fighting against global uncertainty.
South Korea’s GDP rose 1.7% quarter-on-quarter in 1Q26, supported by strong chip exports and AI-related investment. ING raised its 2026 GDP forecast from 2.0% year-on-year to 2.8%.
Growth is expected to slow in 2Q26 as energy supply disruptions affect petrochemicals and other manufacturing sectors. The government introduced a temporary export ban on naphtha, and firms increased oil and gas imports from outside the Middle East, but full-capacity output remains constrained.
Semiconductors And Ai Drive Divergence
Prolonged disruptions could reduce chip production and dampen AI investment, given the economy’s reliance on semiconductors. Monthly inflation is expected to stay lower than in other Asian energy-importing countries due to government measures.
The Consumer Price Index is forecast to rise by at least 0.7% month-on-month in April, driven by higher energy prices and “chipflation”. Rising inflation expectations and uneven sector performance may limit policy flexibility.
In 2H26, the Bank of Korea is expected to face increased pressure to raise rates if growth remains above potential and inflation expectations continue to increase. The article states it was produced using an AI tool and reviewed by an editor.
Based on the strong first-quarter GDP figures, we are seeing a clear divergence in the South Korean economy. The powerful performance of chip exports and AI investment is creating bullish momentum in the tech sector. This suggests opportunities in long positions on tech-heavy indices or specific semiconductor stocks in the coming weeks.
Rate Pressure And Targeted Trades
However, this strength is offset by looming headwinds from energy disruptions which will likely slow growth in the second quarter. This K-shaped recovery, with tech outperforming while other manufacturing suffers, points towards increased market volatility. Traders should consider strategies that benefit from this uncertainty, such as buying options on the KOSPI 200 index.
The most significant factor for derivative traders is the growing pressure on the Bank of Korea to raise interest rates. With March inflation holding firm at 3.1% and a projected monthly increase of at least 0.7% for April, rate hike expectations for the second half of the year are solidifying. This makes shorting Korean Treasury Bond futures an increasingly attractive position to hedge against or profit from rising yields.
This policy divergence is also key for currency traders, especially when we recall the global rate environment of 2025 where major central banks were holding steady. With the Bank of Korea now leaning towards hiking while others remain neutral, the Korean Won (KRW) is positioned to strengthen. We see potential in long KRW positions against currencies like the US dollar, anticipating capital inflows seeking higher yields.
Finally, the government’s temporary Naphtha export ban creates a specific, short-term trade opportunity. This directly impacts the petrochemical and plastics industries, which rely on Naphtha as a feedstock. We believe traders should look at bearish positions on exposed companies in these sectors, as they are likely to face compressed margins and production cuts.