Gold fell 0.48% to $4,716, after touching $4,664, as higher US Treasury yields weighed on prices and trading hovered near $4,700. The US 10-year yield rose nearly 4.5 basis points to 4.349%, pushing gold to an eight-day low.
Middle East developments continued, including reports that Iran’s Parliament Speaker Mohammad Bagher Ghalibaf resigned from the negotiating team, and that Israel was on alert for a possible restart of fighting by the end of the week. The Strait of Hormuz remained shut, with the US and Iran continuing to seize ships, while WTI crude rose on the Ghalibaf headline.
Us Data And Yield Pressure
US data showed jobless claims rose by 214K versus 212K expected. S&P Global’s April flash PMIs strengthened, with Manufacturing up from 52.3 to 54 and Services up from 49.8 to 51.3, both above forecasts.
Market pricing shifted, with the swaps market moving from expecting at least two 25-basis-point Federal Reserve cuts in early 2026 to forecasting rates held steady, with a first cut seen at the July 2027 meeting. Friday’s focus is the final April University of Michigan consumer sentiment reading.
Technically, gold traded near the 100- and 20-day SMAs at $4,723 and $4,706, with potential support levels at $4,650, $4,600, and $4,549, and resistance at $4,800, the 50-day SMA at $4,876, and $4,900.
Given the jump in Treasury yields to over 4.3%, the immediate pressure on gold is clearly to the downside. Last week’s stronger-than-expected S&P Global PMIs show the US economy remains resilient, reducing the immediate need for safe-haven assets. This economic strength is currently outweighing the persistent geopolitical tensions in the Middle East.
We see that the market has aggressively pushed back expectations for a Federal Reserve rate cut until mid-2027, a dramatic shift. This move was solidified after the March 2026 CPI report came in hot at 3.8%, reminding the Fed of the inflation battle we saw back in 2022 and 2023. Derivative traders should therefore consider positioning for further weakness in gold, as the high opportunity cost of holding a non-yielding asset will likely persist.
Technical And Positioning Outlook
The technical picture supports a bearish stance, with gold now trading below its key 20- and 100-day moving averages. Last week’s Commitment of Traders report already showed a reduction in net-long positions from hedge funds for the first time in six weeks, suggesting some professional money is starting to take profits. A decisive break below the $4,650 level could trigger a new wave of selling toward the $4,600 mark.
However, we must remain vigilant about the situation in the Strait of Hormuz, which has pushed WTI crude oil prices above $115 a barrel. An escalation there could quickly shift the narrative back to inflation hedging and safe-haven demand, causing a sharp reversal. Therefore, using put options to define risk or employing bearish credit spreads might be more prudent than outright shorting futures.
Reports from Israel’s N12 News said Iranian Parliament speaker Mohammad Bagher Ghalibaf resigned from Iran’s negotiating team. The headline triggered risk aversion in Thursday’s US session, pushing crude oil prices sharply higher and supporting the US Dollar.
The report implied lower odds of a deal between the United States and Iran. Several Iranian journalists then denied the claim, including Mohammad Ghaderi on X, who said the report was false.
Rising Middle East Tensions
US President Donald Trump wrote on Truth Social: “I have all the time in the World, but Iran doesn’t — The clock is ticking!.” Earlier, he said: “Iran is having a very hard time figuring out who their leader is!”.
Iran’s President Masoud Pezeshkian responded by saying Iran has no hardliners or moderates, and described unity under the Supreme Leader. He added: “One God, one nation, one leader, one path; victory for Iran, dearer than life.”
In markets, uncertainty kept the US Dollar supported across foreign exchange. West Texas Intermediate held its intraday gains and traded at around $94.
We are seeing a familiar pattern of uncertainty building in the market, reminiscent of the events in 2025. Last year, we saw how a single, quickly denied headline about an Iranian negotiator sent West Texas Intermediate crude soaring towards $94 a barrel. That price spike showed just how sensitive energy markets are to any hint of escalating tensions between the US and Iran.
Given that similar rhetoric is now resurfacing ahead of planned talks in Vienna, traders should anticipate heightened volatility. The market is already on edge, with WTI currently trading around $88 a barrel. Recent statistics from the Energy Information Administration (EIA) confirm a surprise drawdown in crude inventories of 3.1 million barrels last week, leaving little buffer for any potential supply disruptions.
Portfolio Hedging Strategies
Therefore, buying near-term call options on crude oil futures offers a strategy with defined risk to profit from a potential price surge. This approach allows traders to capitalize on upward momentum if headlines turn negative, without exposing them to unlimited losses. We’ve seen a notable increase in open interest for the June $95 WTI call options, suggesting this sentiment is gaining traction.
Beyond energy, this geopolitical risk calls for defensive positioning in broader equity portfolios. We recommend hedging by purchasing put options on major indices like the S&P 500. The CBOE Volatility Index (VIX), often called the market’s “fear gauge,” has already crept up from a low of 14 to over 19 in the past two weeks, indicating growing anxiety among investors.
For those expecting a significant price move in oil but are uncertain of the direction, long strangles could be an effective strategy. This involves buying both an out-of-the-money call and an out-of-the-money put option, profiting from a large price swing either up or down. Implied volatility on WTI options has already increased to 42%, reflecting the market’s expectation of a sharp move following the Vienna meetings.
BTC traded near $78,431.70, up $554.88 or 0.71%, after touching $78,484.12.
US spot Bitcoin ETFs drew around $1.93 billion in net inflows from April 14 to April 23.
Strategy added 34,164 BTC for about $2.54 billion, lifting total holdings to 815,061 BTC.
Bitcoin is trying to turn a rebound into a lasting recovery. At the time of writing, BTCUSD traded near $78,431.70, up $554.88 or 0.71%, with the chart showing a high of $78,484.12, a low of $77,787.32, an open at $77,876.78, and a close reference of $77,876.82.
Market data also placed Bitcoin near $78,100, with market capitalisation around $1.56 trillion and 24-hour volume above $38 billion. That puts BTC well above its late-February lows, but close to a zone where profit-taking can return fast.
Bitcoin jumped along with equities on Wednesday after President Donald Trump said he would extend a ceasefire with Iran, bolstering market confidence https://t.co/HjKTfCDcQJ
The rally has real support. ETF inflows have improved, corporate treasury buying remains active, and short sellers have had to adjust. Still, Bitcoin now needs to prove that demand can absorb selling near $80,000.
ETF Demand Lifts Markets
The strongest part of the bullish case comes from spot ETF demand. Farside Investors data cited by Brave New Coin showed positive daily net flows from April 14 through April 23, with the products drawing around $1.93 billion across that run.
ETF demand gives Bitcoin a more durable source of buying than crypto-native leverage alone. It reflects brokerage-account demand, institutional allocation demand, and wider access through regulated products.
Goldman Sachs this week became the latest major Wall Street firm to file for a Bitcoin ETF — joining Morgan Stanley, BlackRock and a growing roster of institutions racing to package cryptocurrencies for mainstream investors. https://t.co/ZWanbbayVD
This helps explain why Bitcoin has outperformed many parts of the crypto market. Capital is not moving evenly across all tokens. It is concentrating in the largest and most liquid crypto asset, where the institutional wrapper is clearest.
The cautious read is simple. A few strong inflow days can lift price, but a lasting uptrend needs repeat demand. If ETF inflows slow while Bitcoin is testing $80,000, momentum could fade quickly.
Buying Supports, Risk Concentrates
Strategy also added fuel to the rally. The company bought 34,164 BTC for about $2.54 billion, at an average price of roughly $74,395. Its total holdings now stand at 815,061 BTC, with an average purchase price of about $75,527.
That sends a clear message. Large balance-sheet buyers still see value near current levels, not just during market stress. It also helps anchor sentiment because Strategy has become one of the most visible corporate Bitcoin buyers.
Michael Saylor has bought another $2.54 billion in bitcoin. 🫨
But the same point cuts both ways. A market that leans too much on one corporate buyer, one ETF complex, and one macro narrative can look stronger than it is. Bitcoin still needs broader spot demand to confirm the move.
Technical Analysis
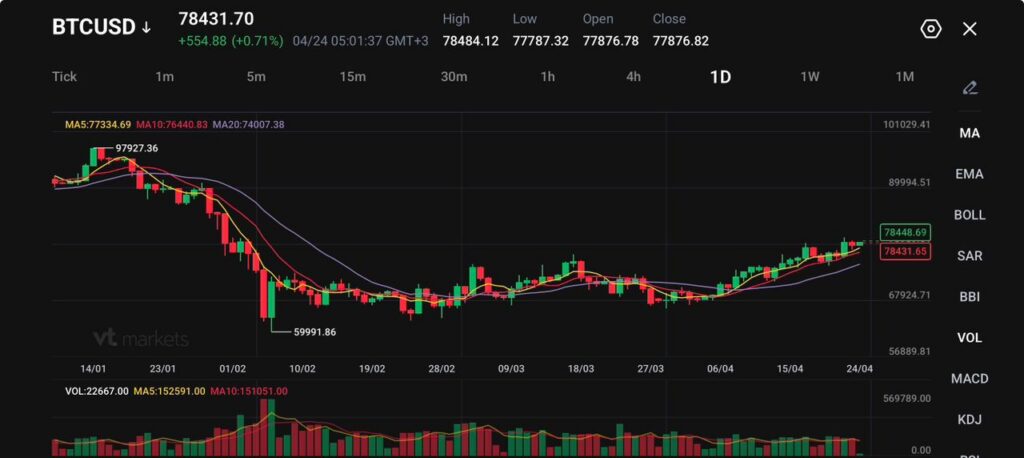
BTCUSD is trading near 78,400, extending its recovery and pressing toward the upper end of its recent range after rebounding from the 59,900 low. Price action shows a steady grind higher, with higher lows forming and momentum gradually building as buyers regain control.
From a technical standpoint, the bias is bullish in the near term. Price is holding above all key moving averages, with the 5-day (77,334) and 10-day (76,440) sloping upward and providing immediate support. The 20-day (74,007) sits further below and continues to trend higher, reinforcing the strength of the current recovery structure.
Key levels to watch:
Support: 77,300 → 76,400 → 74,000
Resistance: 79,800 → 82,000 → 90,000
The market is currently pushing toward the 79,800 resistance zone, which aligns with prior consolidation highs. A clean break above this level could open the door for a move toward 82,000, with further upside potential if momentum accelerates and broader sentiment remains supportive.
On the downside, 77,300 is acting as immediate support. A break below this level could lead to a pullback toward 76,400, though such a move would likely remain corrective as long as price holds above the rising 20-day average.
Overall, BTCUSD is building bullish momentum within a recovery trend, with price approaching a key breakout area. The near-term focus is on whether buyers can clear 79,800, or if the market pauses and consolidates before the next leg higher.
What Traders Should Watch Next
Bitcoin can extend the rally, but buyers now carry the burden of proof. A sustained break above $80,000, backed by steady ETF inflows and stronger spot volume, would point toward the mid-$80,000s.
Failure near $80,000 would not need a large bearish trigger. Profit-taking, weaker ETF flows, and crowded derivatives positioning could be enough to drag price back toward $75,000.
For now, BTCUSD remains in a transition phase. The rally deserves respect because real demand is present, but the next signal must come from price acceptance above $80,000, not just another intraday push.
Create a live VT Markets account today to access our platform features, including market insights and educational content.
Trader Questions
Why is Bitcoin struggling near $80,000?
Bitcoin is approaching a key behavioural level near $80,000, close to the short-term holder cost basis of $80,100. Many recent buyers may sell at breakeven, creating resistance even as demand improves.
What is driving Bitcoin’s current rally?
The rally is supported by ETF inflows of around $1.93 billion from April 14 to April 23, along with corporate buying such as Strategy’s purchase of 34,164 BTC worth $2.54 billion. These flows provide steady demand beyond retail trading.
How important are ETF inflows for BTC price direction?
ETF inflows are now one of the most important drivers. They represent institutional and brokerage demand rather than short-term leverage. Continued inflows are needed to sustain price above $78,000–$80,000.
What levels should traders watch for BTCUSD next?
Immediate resistance sits near $80,000, while support is seen around $77,334 (MA5), $76,440 (MA10), and $74,007 (MA20). A break below these could shift focus toward $75,000 and the low-$70,000s.
Does Strategy’s Bitcoin buying support the market?
Strategy’s total holdings of 815,061 BTC, with an average price of $75,527, provide strong demand support. However, reliance on a single large buyer also introduces concentration risk if sentiment shifts.
Start trading now – Click here to create your real VT Markets account
WTI crude rose on Thursday for a fourth day, amid concerns over oil supply flows through the Strait of Hormuz. It traded near $94.56 a barrel after an intraday high close to $97, up 2.8% on the day.
Reports said Mohammad Bagher Ghalibaf, Iran’s Parliament Speaker and lead negotiator, resigned from the negotiating team after alleged interference by the Islamic Revolutionary Guard Corps, according to Israel’s N12 News. The report described divisions within Iran’s leadership and less prospect of near-term progress in US-Iran talks.
The Strait of Hormuz was described as under a dual blockade by US forces and Iran. US President Donald Trump said on Truth Social that the US has “total control” of the strait and that “no ship can enter or leave” without US Navy approval.
Trump also said he ordered the Navy to “shoot and kill any boat” placing mines in the waterway, and that the route is “sealed up tight” until Iran agrees to a deal. Iranian officials said the US must lift the naval blockade, which Tehran calls a ceasefire breach.
The Washington Post cited a Pentagon assessment saying it could take up to six months to fully clear mines from the strait. Tasnim and shipping companies reported the IRGC seized two vessels on Wednesday.
We recall the intense market conditions in 2025 when escalating tensions in the Strait of Hormuz pushed WTI crude prices toward $97 per barrel. The dual blockade and the breakdown in US-Iran negotiations created a significant supply disruption risk that kept the market on edge for months. That period of extreme uncertainty has set the stage for our current trading environment.
As of today, April 24, 2026, WTI is trading at a more subdued $88.50, but the geopolitical risk premium from last year’s crisis has not fully disappeared. Lingering distrust and occasional naval posturing in the region continue to influence prices. This sustained tension creates an environment where sharp price movements can be triggered by seemingly minor headlines.
For derivatives traders, this means implied volatility in crude options remains elevated compared to historical norms before the 2025 crisis. The CBOE Crude Oil ETF Volatility Index (OVX), which spiked to nearly 60 during the blockade, now hovers around 35, well above the 25-30 range we saw in calmer periods. This suggests the market is still pricing in a significant chance of future supply disruptions.
Given this backdrop, we should consider strategies that benefit from potential price spikes while managing the high cost of options. Buying long-dated call spreads on WTI is an attractive approach. This allows us to capture upside from any renewed conflict in the Gulf but caps our initial cost in this high-volatility setting.
The supply situation also supports this cautious but bullish bias. Following last year’s disruption, OPEC+ increased production, and recent data from the EIA shows their collective spare capacity is now down to just 2.5 million barrels per day, a multi-year low. This leaves the global market with a much thinner buffer to absorb any new shocks.
Furthermore, while the Strait of Hormuz is open, shipping insurance premiums for tankers transiting the waterway remain about 40% higher than they were prior to the 2025 events. This added cost is a constant reminder of the underlying risk that still affects the physical transport of nearly a fifth of the world’s oil supply. We should watch for any new rhetoric or minor naval incidents, as they could cause a rapid repricing of this risk.
Written on April 24, 2026 at 1:28 am, by josephine
Standard Chartered’s Dan Pan expects Banco Central do Brasil (BCB) to keep a cautious easing cycle, with a 25bps policy rate cut at the 29 April meeting. Inflation risks are described as still high.
The note says tight monetary policy, softer growth and a strong Brazilian Real (BRL) could allow further cuts. It adds there may be room for a 50bps cut, but resilient growth and a solid labour market could reduce the chance of a larger move.
Policy Outlook And Inflation Risks
BCB may keep the option of more easing, but future steps may not be set out clearly because of uncertainty around energy prices. The year’s easing expectations are said to have been reduced to about 100bps since the start of the war.
The end-2026 policy rate forecast is kept at 12.5%. The forecast includes upside risk if domestic demand remains resilient.
We expect the Banco Central do Brasil to deliver a cautious 25 basis point rate cut at its meeting next week on April 29th. Recent data supports this slow approach, with the latest mid-month inflation figure for April coming in at a sticky 4.1% year-over-year. This should keep the central bank from moving too quickly.
Traders should consider positioning for a steeper cutting cycle than the market is currently pricing. The market has factored in about 100 basis points of easing for the rest of 2026, but after the aggressive rate hikes we saw through 2025, there is room for more significant easing. This suggests opportunities in receiving fixed rates on interest rate swaps for longer-dated tenors.
Implications For Brl And Positioning
This expected cautiousness is supportive for the Brazilian Real, which has shown strength, holding below 4.95 against the US dollar. A small cut maintains the high-rate differential that attracts foreign capital, making long BRL positions attractive. The risk of a surprise 50 basis point cut seems low, given the national unemployment rate fell to 7.6% last quarter.
Uncertainty around global energy prices means the central bank will likely avoid giving clear guidance on future moves. We see the end-of-year policy rate at 12.5%, but if domestic demand continues to surprise to the upside, rates could finish the year higher. Therefore, any positions should be managed carefully around key inflation and retail sales data releases.
Trade frictions between the United States and Canada are rising ahead of USMCA talks. Washington is seeking upfront concessions from Canada before negotiations begin.
The reported requests include opening Canada’s dairy market beyond existing USMCA commitments. They also include scrapping Canada’s digital services tax and allowing expanded US border enforcement jurisdiction on Canadian soil.
Negotiation Leverage And Sovereignty
These demands shift the talks away from equal footing and raise sovereignty issues for Canada. Canada could refuse the requests or consider leaving the USMCA.
US auto tariffs are already threatening a downturn in Canada’s auto sector similar to the period after the Global Financial Crisis (GFC). Canada also faces downside risks for industrial exports and vehicles.
The article states it was produced with an Artificial Intelligence tool and reviewed by an editor.
Given the rising trade tensions ahead of the USMCA review, we see a strong case for increased volatility in the USD/CAD exchange rate. The Canadian dollar has been sensitive to these negotiations, and with the US demanding an “entry fee” for talks, we should consider buying options straddles on the currency pair. Implied volatility has been relatively low, with the pair trading in a tight range around 1.38 for much of early 2026, making options an inexpensive way to position for a sharp move in either direction.
Canada Equity Market Defense
These US demands put the entire Canadian economy at risk, suggesting a defensive stance on the broader S&P/TSX 60 index. We saw similar market anxiety during the original tense negotiations back in 2017 and 2018, which led to significant choppiness. With over 70% of Canada’s exports still destined for the US as of last year, any threat to the USMCA framework warrants buying protective put options on broad Canadian market ETFs.
The auto sector is particularly vulnerable, with threats of tariffs creating downside risks we haven’t seen since the post-2008 financial crisis. Canadian auto parts manufacturers like Magna are directly in the line of fire, as the industry accounts for a significant portion of our manufacturing exports to the United States. Traders should look at purchasing long-dated puts on these key industrial names to hedge against a potential downturn if talks sour.
On the other side of the border, the dispute over Canada’s digital services tax could create short-term headwinds for specific US tech giants. While not a systemic risk for these massive companies, the proposed 3% tax on Canadian revenues could be a talking point on earnings calls. We could see opportunities for short-term volatility trades using options on a few key tech stocks around dates when trade officials are scheduled to meet.
Iranian Parliament speaker Mohammad Bagher Ghalibaf resigned from Tehran’s negotiating team, according to Israel’s N12 News. The report said the resignation followed an intervention by the Islamic Revolutionary Guard Corps (IRGC).
Ghalibaf had recently said there are no radicals or moderates in Iran and described all as “Iranian” and “revolutionary”. Israel’s Channel 12, citing US officials, also reported that US President Donald Trump is not eager to resume the war, but may not have a choice.
Markets Turn Risk Off
After the Ghalibaf headline, market mood moved towards risk-off and US equities turned negative. The US Dollar Index (DXY) rose 0.26% to 98.85.
WTI oil gained more than 4% and moved towards $97.00 per barrel. Gold extended losses to 0.70% and moved towards $4,700.
“Risk-on” and “risk-off” describe whether markets favour higher-risk assets or safer ones. Risk-on is linked with rising shares, most commodities and some commodity-linked currencies, while risk-off is linked with stronger bonds, gold and safe-haven currencies such as the US Dollar, Japanese Yen and Swiss Franc.
The resignation from Iran’s negotiating team suggests a hardliner takeover of the talks, dramatically increasing geopolitical risk. We are seeing an immediate shift to a risk-off sentiment, similar to what we witnessed during the initial escalations in 2025. Derivative traders should prepare for heightened volatility in the coming weeks, as the CBOE Volatility Index (VIX) has already jumped over 15% to 22.5, signaling rising fear in the equity markets.
Oil Currency And Volatility Outlook
This tension directly impacts oil markets, with WTI crude already pushing past $97 a barrel. Any further escalation threatens passage through the Strait of Hormuz, a chokepoint for nearly 20% of global oil supply, creating a scenario where prices could rapidly approach the $110 highs from last year. Traders should consider buying near-term call options on major oil ETFs to capitalize on this potential price spike.
In the currency markets, we are seeing a classic flight to safety, with the US Dollar Index (DXY) approaching the psychologically important 99.00 level. This strength is driven by investors seeking the liquidity and security of US Treasurys. We expect this trend to continue, favoring long positions on the dollar against commodity-backed currencies like the Australian and Canadian dollars, which suffer from a dimming global growth outlook.
This risk-averse environment makes commodity currencies particularly vulnerable. The Australian Dollar is already down 0.8% against the Japanese Yen, a traditional safe-haven currency. We view shorting pairs like AUD/JPY or NZD/CHF as an effective way to express a bearish view on global risk sentiment.
Gold’s initial dip toward $4,700 is being driven by the surge in the US dollar, which makes the metal more expensive for foreign buyers. However, this is likely a temporary effect, as sustained geopolitical fear typically fuels demand for gold as a true safe-haven asset. This short-term weakness may present a valuable opportunity to purchase call options, betting that underlying security concerns will soon overtake the impact of dollar strength.
Latin American currencies were the strongest-performing Emerging Markets FX over the past quarter, and holdings stayed firm during the conflict. They were supported by attractive nominal and real interest rates.
Risk sentiment has improved but remains tentative, while EM FX holdings have begun to rise gradually. Performance has been uneven across regions.
Dollar Hedging Pressure Returns
The US dollar faced cross-border pressure linked to hedging demand in January and February, which returned after the ceasefire. Latin America was the most bought region over the quarter.
Latin American currencies remained the best held, and none moved into underheld territory during the conflict. If the ceasefire continues and risk appetite strengthens, other risk assets may see holdings recover, which could limit further gains for LatAm FX.
Any early shift would not necessarily weaken carry, which would require large Latin American currency selling. Asia-Pacific and EMEA assets could look more attractive as valuations improve, and rotation may increase as USD funding costs become progressively cheaper.
We see that Latin American currencies have been the top performers, largely because of their high interest rates which have attracted significant investment. Looking back at 2025, the stability of currencies like the Mexican Peso during the conflict made them a haven, but this trade is now very crowded. Data from the Institute of International Finance confirms this, showing portfolio flows into the region hit a three-year high in March 2026.
Options And Rotation Opportunities
With the ceasefire holding and global risk appetite slowly recovering, we should be cautious about further gains in LatAm FX. Money is likely to start looking for better value elsewhere, rotating into assets in Asia and Europe that were overlooked during the conflict. For instance, the Polish Zloty and Hungarian Forint have lagged significantly but are now showing signs of stabilization as European energy security concerns from 2025 have eased.
This suggests it’s a good time to consider protective strategies on our long LatAm positions using options. We could look at buying puts on the Brazilian Real (BRL) or selling out-of-the-money calls on the Mexican Peso (MXN), which would protect against a downturn or profit if the currencies move sideways from here. Implied volatility for these pairs has fallen since the ceasefire but remains elevated compared to historical levels from before 2025, offering reasonable premium for sellers.
Simultaneously, we are seeing opportunity in undervalued currencies in the Asia-Pacific region, which are poised to benefit from this rotation. The South Korean Won is a prime candidate, still trading nearly 8% below its pre-conflict average from early 2025 despite Q1 2026 export data showing a strong recovery. Buying call options on the Won could offer a low-cost way to position for a significant catch-up rally in the coming months.
This entire rotation could accelerate because it’s getting cheaper to borrow U.S. dollars. Following the Federal Reserve’s dovish statements last month, key funding indicators show that borrowing costs have fallen to their lowest levels since the end of 2025. This makes it easier for investors to fund trades into higher-yielding or undervalued EMEA and APAC currencies, putting pressure on crowded positions in Latin America.
USD/CHF was little changed on Thursday, with choppy two-way moves, and was near 0.7845 at the time of writing. Trading was cautious as markets tracked US-Iran tensions, including developments in the Strait of Hormuz.
The US Dollar found support despite some intraday softness, with the US Dollar Index (DXY) near 98.67 after an intraday high of 98.80. US President Donald Trump wrote on Truth Social that the US has “total control over the Strait of Hormuz” and said he ordered the Navy to “shoot and kill any boat” placing mines there, adding the route is “sealed up tight” until Iran can make a deal.
Usd Chf Market Backdrop
US data releases were mixed. The preliminary S&P Global Manufacturing PMI rose to 54 in April from 52.3 in March, a 47-month high, while Services PMI increased to 51.3 from 49.8, a two-month high.
US Initial Jobless Claims rose to 214K in the week ending April 18, above the 212K forecast and up from 208K. On the daily chart, USD/CHF stayed below the 100-day SMA near 0.7865 and the 200-day SMA around 0.7937, with RSI below its midline and ADX near 26.
The current standoff between US and Iranian forces is creating significant uncertainty, overriding the bearish technical signals for USD/CHF. This environment suggests that implied volatility is likely undervalued and could rise sharply in the coming weeks. We should therefore consider strategies that profit from a large price move, regardless of the direction.
We saw a similar dynamic during the initial weeks of the Ukraine conflict back in 2022, when the Cboe Volatility Index (VIX) jumped from around 20 to over 35. A sudden military escalation or a surprise diplomatic breakthrough in the Strait of Hormuz could easily trigger a comparable spike in currency volatility. The current choppy price action is likely the calm before a more decisive move.
For those anticipating a breakout, purchasing long straddles or strangles using options would be a prudent way to position for a large swing. Using the key moving averages as a guide, strike prices around the 0.7850 level could capture a move in either direction. This approach minimizes the risk of guessing the outcome of the geopolitical situation incorrectly.
Hedging And Volatility Strategies
The mixed US economic data further complicates directional bets, making hedging essential for any existing positions. While strong PMI figures, with manufacturing at a 47-month high of 54, suggest a robust economy supporting the dollar, the slight uptick in jobless claims to 214K introduces a note of caution. These conflicting signals make outright long or short positions in the spot market particularly risky right now.
We are witnessing a classic safe-haven tug-of-war, with both the US Dollar and the Swiss Franc vying for capital, which is contributing to the pair’s lack of clear direction. This suggests that if the standoff continues without a major change, the pair could remain range-bound. In that scenario, selling option premium through strategies like an iron condor, with strikes placed safely outside recent highs and lows, could generate income from the ongoing indecision.
USD/JPY traded near 159.45 on Thursday, little changed on the day and close to recent highs after three rising sessions. Demand for the US Dollar has been supported by geopolitical tensions around the Strait of Hormuz, which have kept energy prices high.
Higher oil prices have increased expectations of inflation pressure in the United States. Markets have reduced expectations of near-term Federal Reserve easing and are pricing a high chance that rates stay on hold towards year-end.
Us Data Supports Dollar Demand
US data have also pointed to steady momentum. S&P Global PMI readings showed stronger-than-expected expansion in manufacturing and services, despite a small rise in weekly initial jobless claims.
The Japanese Yen has stayed under pressure as Japan relies heavily on imported energy. Expectations for Bank of Japan tightening have been pushed back, with markets largely expecting no change at the next meeting and a possible rate rise later in the year.
Rising energy costs have added to concerns about imported inflation in Japan. Japan’s domestic inflation has remained relatively subdued compared with global trends, which may limit the pace of policy tightening.
Authorities have also warned they are watching Yen moves closely. This has helped create caution around the 160 level, as intervention risk could slow sharp moves above it.
Policy Divergence And Trading Implications
The fundamental story remains the same; the policy divergence between a hawkish Federal Reserve and a dovish Bank of Japan continues to widen. We see market pricing, reflected in the CME FedWatch Tool, now showing an over 85% probability that the Fed will hold interest rates steady through the third quarter. This strong interest rate differential provides a powerful incentive to favor long US Dollar positions against the Japanese Yen.
Recent economic data gives the Fed room to maintain its stance, with the S&P Global Services PMI for March coming in at a robust 54.8, signaling strong expansion. This resilience is happening as ongoing tensions in the Strait of Hormuz have pushed Brent crude futures back above $115 a barrel, fueling inflationary concerns that keep the Fed on guard. This environment of a strong economy and sticky inflation is a tailwind for the dollar.
On the other side, Japan’s reliance on energy imports makes it uniquely vulnerable to high oil prices, yet the BoJ has little room to act. With Japan’s latest core inflation reading at a modest 2.2%, there isn’t enough domestic pressure to force a significant rate hike soon. This situation leaves the yen exposed to further weakness against a high-yielding dollar.
For us in the derivatives market, this points toward strategies that profit from a continued, gradual climb in USD/JPY, such as buying call options with strikes around 161.00. However, the risk of a sharp, sudden reversal driven by official intervention is extremely high as we hover near the 160.00 level. Therefore, structuring these positions as bull call spreads, which cap both profit and loss, is a prudent way to manage the explosive volatility that intervention could trigger.
We must remember the sharp pullbacks that occurred in the spring of 2024, when Japanese authorities spent an estimated ¥9.8 trillion to defend the currency after it first breached the 160 mark. Historical data shows these interventions can cause the pair to drop 3 to 5 yen in a matter of hours, wiping out leveraged positions. This precedent makes holding outright long positions above 160 extremely risky, demanding a more defined risk approach.