India’s trade deficit rose from $24.53 billion to $25.04 billion in December
India’s trade deficit increased to $25.04 billion in December, rising from $24.53 billion before. This growing gap is a result of higher import costs and changes in export demand.
The government is facing challenges in managing these economic factors to create stability. This information is important for market analysts who are assessing the future economic situation.
The December 2025 trade deficit of $25.04 billion signals ongoing pressure on the Indian Rupee. A larger trade gap means more demand for US dollars to cover imports, which has pushed the rupee past the 84.70 mark in early trading this week. In response, we are preparing for potential further weakness by considering long positions in USD/INR futures and call options.
Uncertainty about the currency’s direction has increased market nervousness. The India VIX, a key measure of expected volatility, has risen by over 8% in the past week, now sitting around 15.5. This volatility makes buying option straddles on the USD/INR pair a smart strategy to take advantage of anticipated price swings.
The trade deficit is largely driven by persistently high global crude oil prices, which have stayed above $90 a barrel during the last quarter of 2025. These ongoing import costs can hurt corporate earnings and slow economic growth, leading to a bearish outlook for Indian stocks. As a precaution, we are considering purchasing Nifty 50 put options to protect against a possible market downturn in the coming weeks.
Historically, the Reserve Bank of India has intervened when the trade deficit has become a major issue, like during the volatility spikes in 2022 when the deficit approached $30 billion. Although the RBI has not acted yet, continued pressure on the rupee may lead them to consider raising short-term interest rates to stabilize the currency. Traders should keep an eye on overnight index swaps for signs that the market is starting to expect a possible rate hike.
Germany’s real GDP growth shifted from -0.2% to 0.1%
Germany’s real GDP growth rate increased from -0.2% to 0.1%, indicating a possible economic recovery for the country.
At the same time, the Pound Sterling is losing value even as the UK sees GDP growth. The EUR/JPY is lower, reflecting concerns about intervention and the awareness of Eurozone data.
The Euro and Pound Dynamics
The EUR/USD pair remains under 1.1650 because of a strong US Dollar, bolstered by strong US data such as the Producer Price Index and Retail Sales. GBP/USD stays above 1.3400 after positive UK data, but the strong dollar is likely to dominate. Gold is around $4,600, affected by expectations that the Federal Reserve will pause rate changes. Additionally, the cryptocurrency market is down after the US Senate delays discussions on market structure following Coinbase’s exit. Jerome Powell’s time as Chair of the Federal Reserve is nearing its end, with various opinions on monetary policy emerging. Recommendations for brokers in 2026 include a variety of financial instruments, regions, and trading conditions. The information provided by FXStreet carries risks and uncertainties. Readers are urged to conduct personal research, and FXStreet and its author stress that the content is not investment advice or a solicitation.Market Speculation and Strategies
The strong trend of the US dollar is likely to continue. Recent Producer Price Index and Retail Sales data from late 2025 exceeded expectations, which pushes back hopes for an early rate cut. The CME FedWatch tool indicates a more than 90% chance that the Fed will maintain rates through the first quarter, suggesting that call options on the U.S. Dollar Index (DXY) could be a good trading strategy. Germany’s GDP has turned slightly positive, a good sign but not enough to change the overall outlook for the Euro. With Eurozone inflation, measured by the HICP staying at 2.5% in December 2025, the European Central Bank may consider rate cuts ahead of the Fed. This difference suggests that selling EUR/USD futures on any strength or purchasing puts on the currency remains a good strategy. For the Pound Sterling, there is a balance between improving local data and the strong US dollar. While recent UK growth numbers were encouraging, inflation in services continues to be a challenge for the Bank of England, as noted in reports from late 2025. This scenario could limit GBP/USD movement, making strategies like selling straddles or strangles appealing for traders predicting a decrease in volatility. Gold is under pressure from the strong dollar and expectations that the Fed will keep rates steady. The precious metal has retreated from its record high near $4,643 as US 10-year Treasury yields rise back toward 4.3% this month. With ongoing outflows from major gold ETFs in January, traders might explore bearish positions through put options or selling futures if the price falls below critical support levels. The uncertainty regarding the conclusion of Jerome Powell’s term as Fed Chair could lead to volatility in the upcoming weeks. As the market speculates about his replacement, we may see significant movements in rate-sensitive assets. Traders should consider buying volatility through options on key currency pairs or equity indices to prepare for potential surprises. Create your live VT Markets account and start trading now.Silver price drops from a record $93.90 to around $89.40 due to falling demand.
Silver prices fell below $89.50 after reaching a high of $93.90, mainly because of reduced demand for safe-haven assets. This drop happened as geopolitical concerns eased. US President Trump also mentioned that no mass executions in Iran were expected.
The price of silver was also pushed down by strong US Producer Price Index (PPI) and Retail Sales reports. These reports indicated that the Federal Reserve might keep interest rates steady. Furthermore, Trump’s choice to not impose new tariffs on essential minerals lowered trade tensions and affected silver demand.
In November, US Retail Sales rose by 0.6% to $735.9 billion, beating predictions of a 0.4% increase. Rising consumer prices impacted silver’s appeal since it doesn’t earn interest. Federal Reserve Chair Jerome Powell expressed concerns about potential pressure on the administration to adopt a more relaxed monetary policy.
Despite recent dips, silver remains an attractive investment due to its historical significance and potential as a hedge against inflation and political unrest. Its demand in industries like electronics and solar energy can lead to price changes, influenced also by gold prices. The Gold/Silver ratio is a useful tool to compare the values of these two metals.
We saw silver prices retreat from last year’s record high of $93.90 as fears about Iran diminished and new tariffs on minerals were avoided. This decline in safe-haven interest has continued into the new year, with prices stabilizing around $85.00. The extreme price fluctuations seen in the fourth quarter of 2025 have calmed down.
Recent US economic data supports trends from last November, confirming strong PPI and retail sales figures. The Consumer Price Index (CPI) for December stood at a stubborn 2.8%. This data reinforces the Federal Reserve’s decision to keep interest rates steady well into this year. High interest rates and a strong dollar are still challenges for non-yielding assets like silver.
For traders, the drop in implied volatility from late 2025 presents an opportunity to sell options on silver. With prices now within a clearer range, strategies like writing covered calls or selling cash-secured puts at key support levels could provide profits. The market is not predicting the wild daily price swings we experienced last year.
Despite the recent price decline, the long-term demand for silver in industry is robust, providing a strong support level for prices. Recent forecasts from the International Energy Agency predict a 15% rise in global solar panel installations in 2026, which heavily depend on silver. This trend suggests that purchasing long-dated call options to leverage this underlying demand may be a smart move in the coming months.
We should keep an eye on the gold-to-silver ratio, which has widened back to 68:1 after tightening during silver’s surge last year. Historically, a ratio above 70 often indicates that silver is undervalued compared to gold. This could present a trading opportunity to buy silver and sell gold futures, betting on the ratio to narrow again.
UOB Group analysts predict EUR/USD will fluctuate between 1.1625 and 1.1660 while consolidating in the long term.
The Euro (EUR) is expected to move between 1.1625 and 1.1660, according to UOB Group analysts. Over a longer period, the EUR is stabilizing, likely between 1.1600 and 1.1700.
In the last 24 hours, the EUR traded closely between 1.1634 and 1.1661, closing slightly higher at 1.1642. This suggests we’re in a range-trading phase, with expectations to keep trading between 1.1625 and 1.1660 today.
Looking ahead one to three weeks, the recent movements of the EUR indicate a recovery after earlier weaknesses. The trading range is expected to stay narrow, now forecasted between 1.1600 and 1.1700.
The FXStreet Insights Team gathers views from market experts, offering both commercial analyst notes and insights from various analysts. This includes the latest currency movement updates and expectations.
In January 2025, we believed that the EUR/USD pair had entered a stabilization phase. We expected the pair to trade in a tight range of 1.1600 to 1.1700, but this did not hold throughout the year.
Our tight range prediction was off, as the European Central Bank started a more aggressive rate-hiking cycle in the third quarter of 2025 to address ongoing inflation. This resulted in a significant increase in the Euro’s strength, pushing the pair above 1.1700 and toward 1.2000 by the end of the year. The market is now adjusting to these changes.
Fast forward to January 2026, and we see a different situation. Recent Eurozone inflation data showed a stubborn 3.1%, while the latest U.S. Non-Farm Payrolls report indicated a cooling labor market. This may lead the Federal Reserve to consider rate cuts sooner than the ECB, creating uncertainty about the future direction of the pair.
Implied volatility for EUR/USD options has hit a six-month high, signaling that the market expects larger price swings in the coming weeks. Traders are anticipating a significant breakout rather than the calm, range-bound environment seen in early 2025.
With the expected movement and lack of clear direction, traders might want to use strategies that benefit from volatility. A long straddle, which involves buying both a call and a put option at the same strike price, is suitable for this scenario. This strategy will be profitable if the EUR/USD makes a big move in either direction before options expire.
For a cheaper option, a long strangle could work well. This approach involves buying an out-of-the-money call and an out-of-the-money put option. While it requires a larger price move to become profitable, it fits the current market sentiment that a breakout is more likely than continued consolidation.
After the CPI report, CARS, CVNA, and TSN are notable stocks to watch because of inflation trends.
December’s Consumer Price Index (CPI) report shows that inflation is steady, but it isn’t meeting market expectations or the Federal Reserve’s goals. Core consumer prices, which exclude food and energy, went up by 0.2% from the previous month and 2.6% over the past year. This is the slowest growth since March 2021.
When considering all categories, the CPI increased by 0.3% monthly and 2.7% yearly. Food prices stood out, jumping 0.7% from the last month and 3.1% from the previous year. Used car prices fell by 1.7% monthly (not adjusted) and 1.1% (seasonally adjusted), which might benefit Cars.com and Carvana, two major online used car retailers.
Stock Analysis of Cars.com
Cars.com’s stock is currently $12 per share, with a forward earnings multiple of 5X. It holds a Zacks Rank #3 (Hold). Analysts predict a 33% increase in earnings per share (EPS) by fiscal 2026, reaching $2.35, but the company has often missed earnings expectations in the past. Carvana’s stock has soared by 6,000% over the past three years, reaching a price of $450 per share with a 64X forward earnings multiple. It’s expected to see a 245% rise in FY25 EPS to $5.49, followed by another 33% increase in 2026. Meat and poultry prices have risen nearly 7% over the past year, with beef and veal prices increasing by 16% annually. Tyson Foods is struggling with cattle shortages and rising costs, which it can’t fully pass on to consumers. Tyson has a Zacks Rank #4 (Sell), and EPS forecasts for FY26 and FY27 have been downgraded. The December 2025 inflation report paints a mixed but useful picture. While inflation remains high, the slowdown in core prices suggests the Federal Reserve may choose to keep rates steady. Notably, the drop in used car prices is a significant development. The Manheim Used Vehicle Value Index indicates another small decline in the first two weeks of January 2026.Strategic Positioning for Carvana
As Carvana’s earnings report is set for February 18th, we should prepare for a potential positive surprise. Given the stock’s high price of over $450 and significant implied volatility, considering bull call spreads is an affordable strategy. The high short interest, still over 15% of the float, could enhance any upward movement if good news emerges. Cars.com presents a different perspective on the same trend, leaning more toward a value play. Although the company has a history of missing earnings targets, its low share price makes call options relatively inexpensive. With earnings due on February 26th, purchasing March calls could be a smart move for a potential rebound, especially since recent filings show modest insider buying in early January, which counteracts some negative sentiment from 2025. In contrast, the CPI data highlights ongoing challenges for Tyson Foods. The report shows a nearly 7% year-over-year rise in meat prices, reflecting TSN’s margin squeeze due to significant cattle shortages. This is a long-term issue stemming from drought conditions that reduced cattle herds in 2023 and 2024. Recent USDA cattle reports from late 2025 confirmed that placements into feedlots are still at their lowest in a decade, meaning the supply problem persists. Furthermore, Tyson recently closed a smaller processing facility temporarily due to cattle supply issues. This indicates that challenges are continuing into the current quarter, making it sensible to consider buying puts on TSN. Create your live VT Markets account and start trading now.Gold, after recently reaching $4,643, is now trading around $4,600 amid speculation of a Fed rate pause.
Gold is currently priced near $4,600 due to expectations that the Federal Reserve will pause interest rate changes, along with easing geopolitical tensions. The price has pulled back from a peak of $4,643, as strong US economic data makes it likely that interest rates will stay the same.
The US Producer Price Index and Retail Sales figures surpassed predictions, suggesting steady rates may remain. At the same time, a stronger US dollar is reducing foreign demand for dollar-priced gold, influencing its price.
Geopolitical Influence On Gold
Recent remarks from President Trump regarding Iran have impacted gold’s status as a safe haven. Although US nonfarm payroll numbers were lower than expected, the unemployment rate has improved. On a technical level, gold is currently within an ascending wedge pattern, which may indicate upcoming changes. The recent high serves as resistance, while support is located near the nine-day Exponential Moving Average. Gold’s importance as a store of value and safe-haven asset is driven by factors like inflation, currency decline, and central bank reserves. In 2022, central banks, especially in emerging markets, significantly increased their gold holdings. The relationship between gold, the US dollar, and other assets is crucial. Geopolitical events and economic indicators continue to influence gold prices, which tend to move inversely to the US dollar and riskier assets.Gold Price Technical Review
Gold has pulled back from its record high of $4,643, creating tension around the $4,600 mark. Strong US economic data from late 2025, including Producer Price Index and Retail Sales figures, are challenging for gold. This data decreases the chances of the Federal Reserve lowering interest rates soon. Core inflation eased to 2.6% in December 2025, a major improvement from the above-9% levels seen in 2022. However, with wage growth climbing to 3.8%, there are still underlying price pressures. This makes the Fed’s decisions more complex, meaning any new inflation reports could lead to significant market swings. Political risks are also supporting gold prices, especially regarding the tensions between the White House and the Federal Reserve. Any signs of threats to the Fed’s independence could lead to a swift movement toward safe assets. Additionally, ongoing tensions with Iran are helping prevent a more significant price drop for the moment. The daily chart illustrates an ascending wedge pattern, often indicating that upward momentum may be slowing and a reversal could be near. While gold remains above the nine-day moving average support at $4,535, a drop below the wedge’s bottom around $4,490 would signal bearish trends. Traders should watch these levels for potential breakdowns. Considering these conflicting factors and technical signals, options traders might think about strategies that could benefit from a large price movement in either direction. A long straddle, which involves buying both a call and a put option at the current price, could effectively profit from the anticipated breakout. This method is especially suitable for the high implied volatility expected in the coming weeks. It’s also essential to keep an eye on the US Dollar Index, which is holding steady around 99.10. After peaking above 114 in 2022, the dollar has weakened significantly, contributing to the gold rally. If the dollar index moves back towards the 100 mark, it may limit gold’s potential upside and pressure it to test key support levels. Create your live VT Markets account and start trading now.China’s M2 money supply exceeds predictions with an 8.5% year-on-year increase in December
In December, China saw its M2 money supply rise by 8.5% compared to last year, exceeding predictions of 8%. This stronger-than-expected growth could influence economic choices.
Several currencies shifted in value, with EUR/USD dropping below 1.1650 as strong US economic data impacted the Federal Reserve’s interest rate plans. On the other hand, GBP/USD stayed above 1.3400 after a surge due to positive data on UK growth and industry.
Gold Sentiment
Gold reached a peak of $4,643 but settled closer to $4,600. This drop is connected to US data suggesting steady interest rates will remain. Additionally, the cryptocurrency market experienced losses as the US Senate delayed talks on a market-structure bill. Looking to 2026, there are discussions about the end of Jerome Powell’s term as Chair of the Federal Reserve. Speculation continues about the future direction of the US central bank amid differing views among policymakers. FXStreet offers extensive resources for market observers. It emphasizes the need for thorough research and recognizes the risks involved in open market investments. The information provided is for informational purposes and should not be seen as trading advice. The higher-than-expected M2 money supply data from China indicates that the People’s Bank of China is sticking with a supportive policy. This extends the easing trend we saw throughout 2025 and should help assets tied to Chinese growth. Investors might explore options strategies to benefit from possible gains in the Australian dollar and industrial commodities in the coming weeks. On the flip side, the strength of the US dollar is a key theme, driven by strong economic data that supports the Federal Reserve keeping rates steady. Last week’s report showed the US added over 216,000 jobs in December, and core inflation remained stable at about 3.9%, making it tough to bet against the dollar. This situation puts pressure on pairs like EUR/USD, and traders might want to sell during any rallies.Economic Implications
This environment limits gains in other assets, keeping gold’s momentum subdued even as it stays near historically high prices. The strong US dollar and the likelihood of ongoing higher interest rates make non-yielding assets less appealing. Selling call options on gold futures could be a smart strategy to take advantage of potential price stabilization. Looking ahead, Jerome Powell’s upcoming exit from the Fed adds significant uncertainty for the second half of the year. While current data supports stable policy, a change in leadership might significantly alter market conditions. Buying longer-term volatility on major equity indices or currency pairs could be a wise way to prepare for this uncertainty. Create your live VT Markets account and start trading now.In December, new loans in China reached 910 billion, surpassing the expected 800 billion.
China’s new loans in December 2025 hit 910 billion yuan, exceeding the expected 800 billion yuan. This increase has sparked optimism about the country’s economic recovery despite global challenges.
The data is important for the markets because it shows demand for credit and overall economic activity in China. Analysts see this rise in loans as a sign of economic strength, which could ease worries about slow growth.
Impact On Sectors
Broader implications of the lending increase are positive for sectors like real estate and infrastructure, which are crucial for China’s growth. This trend may also affect central bank policies and how markets view credit growth in the world’s second-largest economy. As the situation evolves, further updates will be provided as markets react to these numbers. The unexpected rise in loans from December 2025 is a bullish sign for China’s economic momentum as we approach the new year. It indicates that policy support is translating into real economic activity. This might lead to a reassessment of bearish positions and a shift toward strategies that capitalize on a cyclical recovery.Impact On Commodities
This growth in credit is vital for industrial commodities since lending often supports infrastructure and property development. We have seen iron ore futures rise above $138 per tonne this month due to renewed optimism for demand from Chinese steel mills. We are considering call options on ETFs that track industrial metals and major miners to take advantage of this trend. In the stock market, we expect this news to support Chinese indices that faced difficulties last year. A smart strategy is to use bull call spreads on large-cap Chinese ETFs to position for a potential rebound while managing our risk. We recall similar credit-driven rallies in the past, like in 2016, led by these sectors. The currency market offers another opportunity to express this outlook, as a stronger Chinese economy usually boosts commodity-linked currencies. The Australian dollar has already strengthened against the US dollar, climbing above 0.6780 since this news emerged. We see potential in taking long positions in AUD/USD through futures or options. This surge in credit comes ahead of the full Q4 2025 GDP figures, which recently reported at 4.9%, slightly better than expected. With this confirmation, implied volatility on Chinese assets may begin to drop as uncertainty decreases. This environment makes selling out-of-the-money puts on select Chinese stocks an appealing, income-generating strategy. Create your live VT Markets account and start trading now.Dividend Adjustment Notice – Jan 15 ,2026
Dear Client,
Please note that the dividends of the following products will be adjusted accordingly. Index dividends will be executed separately through a balance statement directly to your trading account, and the comment will be in the following format “Div & Product Name & Net Volume”.
Please refer to the table below for more details:
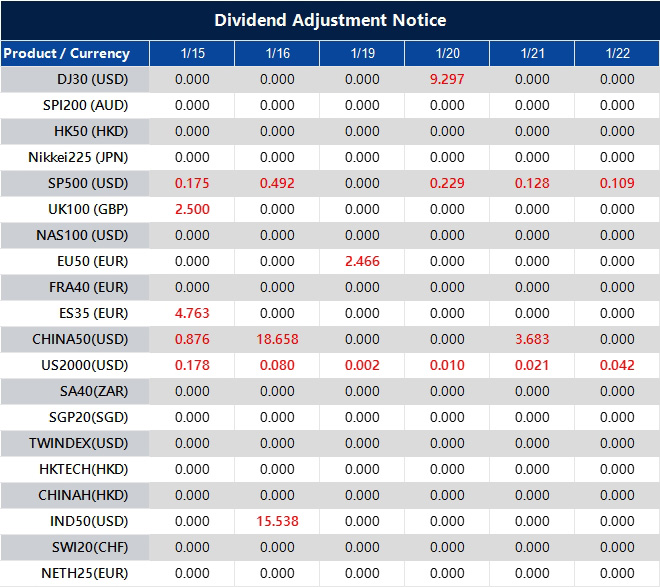
The above data is for reference only, please refer to the MT4/MT5 software for specific data.
If you’d like more information, please don’t hesitate to contact [email protected].
In November, UK manufacturing production exceeded predictions, reaching 2.1% instead of the expected -0.3%.
In November, UK manufacturing production rose by 2.1% compared to last year, outperforming the predicted -0.3%. This indicates that the manufacturing sector is performing better than expected.
Following this positive news, the EUR/GBP exchange rate fell toward the 0.8650 level. Analysts from the UOB Group expect GBP/USD to trade within the range of 1.3410 to 1.3460.


