Ralph Lauren’s stock rises 1.3% to $369.81, outperforming the S&P 500 and other indices
Ralph Lauren’s stock rose by 1.3% to $369.81, outperforming the S&P 500’s increase of 0.65%. The Dow Jones climbed by 0.48%, and the Nasdaq gained 0.82%. Over the last month, Ralph Lauren’s shares dipped by 0.69%, while the Consumer Discretionary sector grew by 2.38% and the S&P 500 went up by 1.15%.
The company’s upcoming earnings report is expected to show an EPS of $5.72, an 18.67% increase from last year. Anticipated revenue is $2.3 billion, which is a 7.27% rise compared to the same quarter last year. For the entire fiscal year, earnings are projected at $15.29 per share, with revenue expected to reach $7.75 billion.
The AUD/JPY pair climbs towards 106.00, hitting levels not seen since July 2024 due to yen weakness.
AUD/JPY has increased for the second day in a row. This rise is driven by factors such as political uncertainty in Japan and possible early elections. The Reserve Bank of Australia’s (RBA) aggressive approach has also helped, though a weaker risk appetite may restrict further gains.
During Monday’s European session, the AUD/JPY cross reached 106.00, its highest level since July 2024. The Japanese Yen (JPY) is facing pressure due to uncertainty about the Bank of Japan’s next interest rate move and growing tensions with China.
Geopolitical Tensions and Economic Factors
China’s export restrictions on dual-use goods, like rare earth elements, have raised supply-chain risks for Japanese manufacturers, further weakening the JPY. Additionally, news about a possible snap election in Japan has contributed to the Yen’s decline, boosting AUD/JPY’s upward movement. The Australian Dollar benefits from the RBA’s likely interest rate hikes, which drive the AUD/JPY pair’s positive trend. However, ongoing global tensions could increase the JPY’s appeal as a safe-haven currency, potentially limiting AUD/JPY’s gains. The RBA affects the Australian Dollar by adjusting interest rates and other monetary policies, which helps maintain economic stability and can influence currency strength. Economic data and central bank actions, such as quantitative easing or tightening, also impact how strong the Australian Dollar is. The AUD/JPY cross has been climbing since our analysis from last year and is currently trading around 108.50. The main reasons for this strength—a proactive RBA and a cautious Bank of Japan—have played out as we predicted, reinforcing the current trend.Monetary Policy Impacts
The Reserve Bank of Australia implemented two more rate hikes in late 2025, raising the cash rate to 4.85% to tackle ongoing inflation. Australia’s recent quarterly CPI data for Q4 2025 stood at 3.5%, still above the RBA’s target range. This situation keeps the RBA in a hawkish stance, supporting the Australian Dollar. In Japan, the Bank of Japan ended its negative interest rate policy last year, but its single small increase has lagged behind tighter policies in other countries. Recent core inflation in Japan has dipped below the 2% target, allowing the BoJ to delay further major changes. This ongoing interest rate gap makes the yen an attractive option for carry trades. We think long call options on AUD/JPY are a smart trading strategy to ride this momentum. This approach lets traders benefit from potential gains toward the 110.00 level while clearly defining their maximum risk. Given the continuous geopolitical uncertainty throughout 2025, it’s crucial to manage downside risk. Implied volatility for the pair remains high, reflecting ongoing risks that haven’t completely settled. For those looking to hedge, buying out-of-the-money puts can offer protection against sudden “risk-off” events that might strengthen the yen. This balanced strategy allows participation in the upward trend while being prepared for any reversals. Create your live VT Markets account and start trading now.XAG/USD rises for the second day in early European trading, nearing $84.30 per troy ounce.
Silver prices are on the rise, currently at around $84.30 per troy ounce during early European trading. The price is moving within an ascending channel, which indicates a bullish trend. The 14-day RSI sits at 70.66, showing that Silver is overbought and may need to consolidate in the short term. Furthermore, both the nine-day and 50-day EMAs are trending upwards, reinforcing the positive outlook.
There is potential for Silver to reach its all-time high of $85.87, set on December 29, 2025. It could even climb to $88.40. Key support levels to watch are the nine-day EMA at $77.94 and the lower boundary of the channel at $76.40. If the price closes below these levels, we might see a shift toward the 50-day base at $64.39.
Silver is often seen as a safe investment and helps diversify portfolios. Its prices are influenced by factors like geopolitical issues, interest rates, and the US Dollar’s strength. Demand from industries such as electronics and solar energy in countries like the US, China, and India also affects price changes. Typically, Silver trends along with Gold, which is reflected in the Gold/Silver ratio.
Right now, Silver is approaching its all-time high of $85.87, displaying strong bullish momentum within its current channel. Yet, with the RSI indicating overbought conditions, we should be wary of a possible short-term pullback. The balance between this strong trend and stretched indicators will be crucial in the coming weeks.
Traders looking for a breakout may consider long positions, targeting the upper channel near $88.40 if Silver breaks past the $85.87 peak. This bullish perspective is backed by reports from late 2025 showing record industrial silver demand, especially in the solar and EV sectors. Demand for silver in global photovoltaics alone increased by over 15% last year, highlighting its underlying value.
On the other hand, the overbought RSI may present an opportunity for those anticipating a price drop to look at put options or selling calls. The recent price surge was primarily due to rate cuts by the Federal Reserve in late 2025, but new inflation data has cast doubt on further cuts. A shift towards a more hawkish stance from policymakers could lead to a correction toward the first support level at $77.94.
Keep an eye on the Gold/Silver ratio for insights on relative value. In 2025, this ratio significantly compressed from over 85:1, as Silver’s industrial demand helped it perform better than Gold. Any stall in this compression could signal that Silver’s strong performance is losing strength compared to the wider precious metals market.
Since Silver is currently stretched but maintains a strong trend, traders who are unsure of the direction might explore options that benefit from significant price movements in either direction. For those already holding long positions, it may be wise to tighten stop-loss orders just below key support levels like the nine-day EMA at $77.94. A break below this level would suggest a deeper, more significant correction is underway.
Dividend Adjustment Notice – Jan 12 ,2026
Dear Client,
Please note that the dividends of the following products will be adjusted accordingly. Index dividends will be executed separately through a balance statement directly to your trading account, and the comment will be in the following format “Div & Product Name & Net Volume”.
Please refer to the table below for more details:
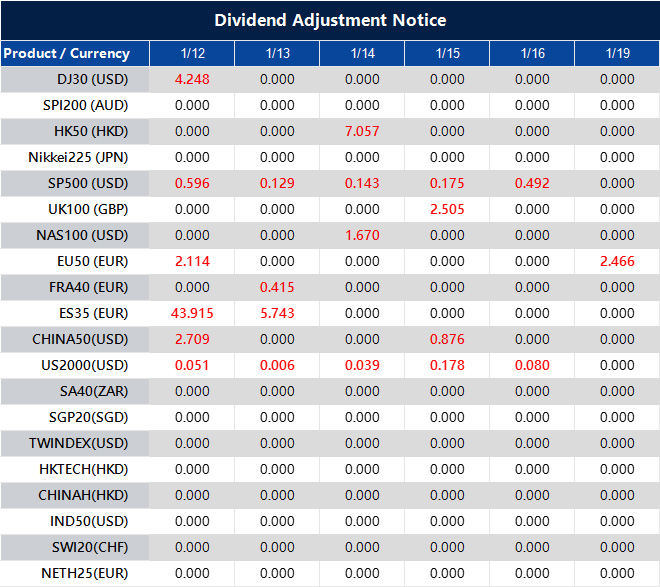
The above data is for reference only, please refer to the MT4/MT5 software for specific data.
If you’d like more information, please don’t hesitate to contact [email protected].
Gold prices rise in the United Arab Emirates according to the latest data
Gold prices in the United Arab Emirates have increased. The price per gram is now 539.36 AED, up from 532.29 AED on Friday. The price per tola rose to 6,290.87 AED, compared to 6,208.53 AED on Friday, according to FXStreet.
FXStreet updates gold prices daily based on international rates and the USD/AED exchange rate. Several factors can affect gold prices, including geopolitical issues and currency values. Gold is often viewed as a safe investment during uncertain times.
Central Banks and Gold Reserves
Central banks play a big role in gold purchases, holding large reserves to support their currencies. In 2022, they bought 1,136 tonnes of gold, which is a record high for annual purchases, according to the World Gold Council. Gold prices typically rise when the US Dollar weakens. Lower interest rates make gold more appealing since it does not generate yield. Additionally, fears related to geopolitical instability can push gold prices higher. The information from FXStreet is for reference only and should not be taken as financial advice. Users should conduct their own research before making any financial decisions, as investing comes with risks, including the potential loss of principal. Gold prices are rising, signaling its traditional role as a safe haven in uncertain times. This trend is not only global but also apparent in the United Arab Emirates, where the price per gram has increased in Dirhams. This indicates that investors may be feeling cautious as the year begins.Market Speculation and Investment Strategies
A key factor in the current gold price increase is the weakening of the US Dollar. The U.S. Dollar Index (DXY) has dropped from its highs in late 2025 and is now around 103. Since gold is priced in dollars, this relationship is boosting gold’s value. There are also changing expectations regarding central bank policies. Recent economic data suggests that the Federal Reserve might lower interest rates later this year, making non-yielding assets like gold more attractive. In 2019, we saw gold prices surge in anticipation of Fed cuts, and a similar situation could be developing now. Strong demand from official institutions is supporting gold prices. At the end of last year, central banks, especially in emerging markets, were still making significant gold purchases in the fourth quarter of 2025. This consistent buying shows a long-term strategy to diversify reserves. For traders in derivatives, taking long positions in gold may be favorable. Rising market uncertainty is reflected in the VIX index, which has climbed back above 17, often indicating strength in safe-haven assets. Buying call options on gold futures or related ETFs provides a defined-risk way to gain exposure to potential price increases. There are also opportunities to capitalize on correlations between asset classes. Since gold often moves inversely to risk assets, pairing a long position in gold with a short in equity index futures could serve as an effective hedge. This strategy is particularly relevant as the market considers mixed global growth forecasts for 2026. Create your live VT Markets account and start trading now.Gold prices in Pakistan have recently increased, according to recent data analyses.
Gold prices in Pakistan rose on Monday. The price reached 41,082.98 Pakistani Rupees (PKR) per gram, up from Friday’s 40,532.97 PKR. The tola price also increased to 479,186.50 PKR, compared to 472,768.70 PKR earlier.
According to FXStreet, the price for gold is 410,832.00 PKR for 10 grams and 1,277,815.00 PKR for a Troy Ounce. Gold prices in Pakistan reflect international market trends and are updated daily.
The Importance Of Gold
Gold is valuable as a store of wealth, a currency for trade, a safeguard against inflation, and a secure investment. Central banks are the biggest gold holders, adding 1,136 tonnes, worth about $70 billion, to their reserves in 2022. Gold prices are influenced by global events, fears of a recession, and changes in interest rates. They often move opposite to the value of the US Dollar and US Treasuries. A strong Dollar typically lowers gold prices, while a weak Dollar tends to raise them. FXStreet notes that their data is for informational purposes only. They are not responsible for any investment choices based on this information and encourage thorough research prior to investing. The increase in local gold prices mirrors global market trends, not just local conditions. Gold is nearing record highs due to significant weakness in the US Dollar. This trend provides guidance for trading in the derivatives market.Market Dynamics And Trends
The ongoing tensions between the White House and the Federal Reserve are driving this change. Concerns about the stability of the USD are causing capital to move into traditional safe havens like gold. This is the key factor to consider in our trading strategies over the coming weeks. This trend is further supported by strong purchasing activity from central banks, which has been evident since early 2020. According to data from the World Gold Council, emerging market central banks added over 300 tonnes to their reserves in the fourth quarter of 2025. This ongoing institutional demand helps stabilize gold prices. Additionally, after the Federal Reserve lowered interest rates in the latter half of 2025, gold has become a more appealing option for investors seeking safety. With lower returns on US Treasuries, gold is seen as a competitive choice. This dynamic similarly drove gold’s rise following the 2008 financial crisis. Given this positive momentum, we should position ourselves for further increases in gold prices. Bullish strategies, such as buying call options on major gold ETFs or futures contracts, are effective ways to capitalize on these conditions. Current market trends suggest that price dips could be great buying opportunities. The main risk to this outlook is any sudden good news for the US Dollar. A resolution to political conflicts or a surprising hawkish statement from the Fed could reverse the dollar’s downward trend. Thus, we must closely monitor communications from Washington as a potential challenge. Create your live VT Markets account and start trading now.The Swiss Franc strengthens, pushing USD/CHF below 0.8000 due to safe-haven demand.
The USD/CHF currency pair is facing losses below 0.8000. This is mainly due to a rising demand for the Swiss Franc (CHF) as a safe-haven asset amid geopolitical tensions. US President Trump has warned against using force against demonstrators in Tehran, indicating possible actions ahead. Meanwhile, European nations are looking at increasing their military presence in Greenland due to security concerns in the Arctic.
The Swiss Franc is benefiting from the outlook of the Swiss National Bank (SNB), with Swiss inflation rising to 0.1% year-over-year in December 2025. This suggests that interest rates might stay at 0% while the economy slowly recovers. Additionally, the US dollar is weakening as the Federal Reserve deals with scrutiny, including a criminal investigation into its Chair, Jerome Powell, amid discussions about interest rate cuts.
Switzerland’s Stable Economy
The CHF is seen as a safe haven because of Switzerland’s stable economy, its neutrality in global conflicts, and its robust central bank reserves. The economic health of the Eurozone is crucial for the CHF, given Switzerland’s reliance on its neighboring countries. As a result, changes in Eurozone monetary policy greatly impact the Franc, with strong correlations between the EUR and CHF of over 90%. The strength of the Swiss Franc is fueled by demand for safe-haven assets, particularly with rising tensions in Iran and the Arctic. The investigation into the Fed Chair adds political risk to the US Dollar, leading to a negative outlook for the USD/CHF pair. These factors have pushed the currency pair decisively below the important 0.8000 level. The weak US jobs report from December 2025, which showed only 50,000 new jobs when 60,000 were expected, reinforces our expectation that the Federal Reserve will cut rates soon. The latest US Consumer Price Index (CPI) data for December also remained low at 1.8%, giving the Fed a clear path to ease policies. In contrast, the Swiss National Bank is expected to keep its rate stable, creating a policy difference that favors the Franc.Market Turmoil
Due to increased uncertainty, implied volatility on Swiss Franc options rose nearly 15% in the first two weeks of the year. This makes buying options more expensive but opens up opportunities for strategies that take advantage of higher premiums. Therefore, selling call options or using bear call spreads on USD/CHF above 0.8000 could effectively capitalize on the pair’s expected range-bound or downward movement. The drop below 0.8000 is psychologically significant, a level not convincingly seen since the market chaos following the SNB’s removal of the Euro peg in 2015. Recent data from the CFTC reveals that speculative traders are building their largest net-long position in the Franc in over six months, suggesting that we might see even lower levels in the upcoming weeks. Traders should think about buying USD/CHF put options with expirations in late February or March to prepare for further declines toward the 0.7850 area. For a more risk-conscious strategy, a bear put spread would limit initial costs while still allowing for profit from a decline. These strategies align with the current conditions of a weak dollar and a strong, safe-haven Franc. Create your live VT Markets account and start trading now.Gold prices in India increased today based on data from various sources.
Gold prices in India increased on Monday, according to FXStreet. The price reached 13,289.08 INR per gram, up from 13,110.74 INR on Friday.
The price per tola rose to 155,002.10 INR from 152,921.10 INR. A troy ounce of gold is now priced at 413,331.50 INR.
Gold Prices Adaptation
FXStreet adjusts international gold prices to INR with daily updates reflecting the current market rates. Local prices might vary slightly from these figures. Gold has always been a valuable asset and a medium of exchange. It’s viewed as a safeguard against inflation and currency depreciation, especially in uncertain times. Central banks from emerging economies, like China, India, and Turkey, are significant buyers of gold. In 2022, they added 1,136 tonnes to their reserves, worth about $70 billion. Gold prices often move in opposition to the US Dollar and riskier assets. A weaker Dollar and lower interest rates tend to push gold prices higher. Additionally, fears of geopolitical instability or recession also raise gold’s appeal as a safe-haven asset.Gold Price Trends and Influences
Gold prices are rising, indicating its strength as a safe-haven asset despite other market signs that could bring prices down. Recent data showed US inflation for December 2025 remained high at 3.8%, increasing the chances of higher interest rates, which typically harm gold prices. The demand for gold stays strong due to continued significant purchases by central banks. This trend has been robust in 2025, with emerging economies adding over 800 tonnes to their reserves last year, according to preliminary figures from the World Gold Council. This ongoing demand supports gold prices, making large declines less likely. Currently, gold traders face a challenge due to its opposite relationship with the strengthening US Dollar. The Dollar Index (DXY) recently hit a six-month high of 105.50. Despite this, gold prices continue to rise, suggesting that concerns about geopolitical stability and recession are more influential for investors. This conflict between a strong Dollar and demand for safe-haven assets creates notable market tension. In the coming weeks, this situation encourages the use of options strategies. Increased uncertainty has led to greater volatility, with the GVZ index rising 15% since the beginning of the year. Traders might consider buying call options to benefit from any market fears that escalate, while keeping risk clearly defined. Reflecting on past patterns during the regional bank stress in 2023 and supply chain issues in 2024, we see that gold’s safe-haven reputation tends to overpower its traditional relationship with the Dollar during times of high anxiety. Current price movements are consistent with this historical trend. Therefore, we should be ready for sharp price changes influenced more by news than by economic data. Create your live VT Markets account and start trading now.AUD strengthens against a weakening USD amid Federal Reserve concerns
The Australian Dollar (AUD) improved against the US Dollar (USD) after three days of losses, driven by worries about the Federal Reserve. A criminal investigation into Fed Chair Jerome Powell is looking into renovations at the Fed’s Washington headquarters and possible misinformation to Congress. In Australia, ANZ Job Advertisements fell by 0.5% in December, while household spending rose by 1.0% in November.
The Reserve Bank of Australia’s policy outlook is uncertain due to mixed Consumer Price Index (CPI) data. With the US Dollar Index (DXY) dropping to about 98.90, many believe the Federal Reserve might keep interest rates the same. The US added 50,000 jobs in December, but nonfarm payrolls didn’t meet expectations, and unemployment decreased to 4.4%. Additionally, US Average Hourly Earnings rose by 3.8% over the past year.
The Australian Dollar Rebound
The Australian Dollar recovered toward 0.6700 in a cautious market. The AUD/USD pair showed positive signs within its rising trend. In November, Australia’s Trade Surplus shrank significantly, with only slight changes in both imports and exports. Interest rates, the Chinese economy, and Iron Ore prices are vital factors influencing the Australian Dollar’s performance. The investigation into the Fed Chair is crucial right now, causing considerable uncertainty for the US Dollar. Such political pressure on the central bank is unusual and shakes confidence in US monetary policy. We’re already noticing one-month implied volatility for major USD pairs like AUD/USD rise to over 11.5% as traders respond to this new risk. Looking back to the December 2025 data, the miss on Nonfarm Payrolls and the slow increase in ongoing jobless claims suggest a softening US labor market. This aligns with the consensus, as Fed Funds futures indicate a 95% chance the Fed will keep rates steady this month. The Treasury Secretary’s recent call for rate cuts adds to the cautious outlook. In Australia, the Reserve Bank seems to be maintaining its position, noting that rate cuts are not imminent. The upcoming quarterly CPI report will be crucial in shaping this perspective. For now, steady iron ore prices around $135 per tonne are giving the Aussie dollar strong support.Future Market Expectations
With the US Dollar weakening, we expect the AUD/USD to trend higher in the coming weeks. A lasting rise above the 0.6700 level would confirm this positive outlook, potentially leading to resistance testing near 0.6766. We think buying call options is a smart move to reflect this view, as it helps define our risk if the Fed issue changes unexpectedly. The rising uncertainty suggests we should brace for larger price movements in either direction. This situation makes long volatility strategies, like buying straddles on the AUD/USD, appealing ahead of the Australian CPI release. Such a position could profit from significant price swings, regardless of direction, which is ideal in the current unpredictable environment. Create your live VT Markets account and start trading now.Gold prices in Malaysia increased today, according to recently compiled market data.
Gold prices in Malaysia increased on Monday, as reported by FXStreet. The price per gram rose to 597.38 Malaysian Ringgits (MYR), up from MYR 589.40 on Friday.
The cost of Gold per tola rose to MYR 6,967.70 from MYR 6,874.70. FXStreet updates Gold prices daily by converting international rates (USD/MYR) into local figures.


