Dow Jones, S&P 500, and Nasdaq futures decline due to geopolitical concerns and Fed worries
During the European trading session, the Pound Sterling strengthens to about 1.3450 against the US Dollar.
The Pound Sterling has gained strength against the US Dollar, reaching about 1.3465. This increase follows the US Department of Justice starting a criminal investigation into Federal Reserve Chair Jerome Powell for alleged mishandling of funds. As a result, the US Dollar Index has fallen by 0.3%, now at 98.80.
The investigation focuses on Powell’s behavior and statements made during his Senate testimony in June 2025. This has heightened tensions between Powell and US President Donald Trump, which could jeopardize the independence of the Federal Reserve—a negative sign for the USD.
Technical Indicators And Economic Data
The GBP/USD pair is currently bouncing off the 50% Fibonacci retracement level near 1.3500. The support from the 20-day EMA suggests a positive outlook. Attention is shifting to upcoming economic reports, including employment figures from the UK and inflation data from the US. The UK’s employment numbers may influence the Bank of England’s policy, while the US CPI figures could impact interest rate expectations. In December, US employment data showed a drop in the unemployment rate to 4.4%, but hiring fell short, with only 50,000 jobs added compared to an anticipated 60,000. Traders will closely examine these indicators for clues about future monetary policy. The investigation into the Federal Reserve’s leadership poses a significant challenge, threatening the principle of central bank independence. This is likely to drive market activity in the coming weeks, leading to higher volatility as political news may overshadow economic data.Market Volatility And Risk Assessment
As a result, the US Dollar has weakened, with the DXY dropping sharply from its monthly high. This is an atypical market reaction, reflecting increased perceived political risk in the US. Be cautious of any short-term strength in the dollar until the situation with the Fed becomes clearer. In the derivatives market, we’ve already noticed a rise in implied volatility for dollar-related currency pairs. For instance, the one-month implied volatility on EUR/USD options has surged to over 9.5%, up from a 6% average in late 2025. This indicates that options traders expect larger price movements and are actively hedging against sudden changes. The upcoming US inflation data, due tomorrow, is a crucial event, though its impact is uncertain. Typically, high inflation would support a hawkish Fed stance, boosting the dollar. However, given the Fed’s credibility is under scrutiny, we might see a muted or negative response from the dollar as the market doubts their ability to act independently. Meanwhile, the Pound Sterling benefits from the US dollar’s weakness. Strong UK employment data tomorrow could further strengthen the pound. It’s important to monitor the technical level of 1.3496 in the GBP/USD pair. A clear break above this Fibonacci resistance could lead to a quick rise, and traders might explore options strategies to profit from such a breakout. Create your live VT Markets account and start trading now.The Indian Rupee stays stable against peers despite rising oil prices and foreign fund outflows
The Indian Rupee is holding steady against other currencies, despite ongoing pressure from rising oil prices. Economies that rely on oil are facing challenges due to a 6% increase in global oil prices since Thursday. This spike, driven by unrest in Iran, puts 1.9 million barrels per day of exports at risk.
In January, Foreign Institutional Investors sold Rs. 11,786.82 crore worth of Indian stocks, adding to the pressure on the Rupee amid US-India trade tensions. However, US-India trade talks scheduled for Tuesday may bring positive news that could help the Indian stock market.
Upcoming CPI Release
India’s Consumer Price Index for December is expected to show a year-on-year growth of 1.5%. The USD/INR exchange rate is slightly down at around 90.40, as the US Dollar weakens due to legal issues involving Jerome Powell. The US Dollar Index is also down, sitting at 99.10, following legal proceedings related to his testimony. US inflation data, set to be released on Tuesday, is likely to show an increase in core inflation to 2.7% year-on-year. The recent US jobs report revealed better-than-expected outcomes: a lower Unemployment Rate of 4.4% and improved wage growth at 3.8%, enhancing the attractiveness of the US Dollar. While USD/INR is slightly lower, it remains above its 20-Exponential Moving Average, which supports a positive short-term outlook. As we start the week, it’s worth reflecting on where we stood last year. In January 2025, the Rupee faced significant pressure, trading near 90.40 against the dollar due to soaring oil prices and heavy selling by foreign investors. This comparison highlights the current market’s calmness. Last year, global oil prices rose nearly 6% amid fears of supply disruptions from Iran, significantly affecting the Rupee. Today, in January 2026, the situation has improved considerably, with Brent crude prices stabilizing around $78 per barrel, easing immediate inflation concerns that were prevalent in early 2025.Foreign Fund Flows and Market Outlook
Another noteworthy change is in foreign fund flows. Foreign Institutional Investors withdrew nearly ₹11,800 crore in the first half of January 2025, but this trend has completely reversed. Foreign Portfolio Investors (FPIs) were strong net buyers in December 2025, investing over ₹55,000 crore in Indian equities, signalling renewed market confidence. On the US front, circumstances have changed as well. A year ago, the US Dollar Index was strong above 99.00, boosted by solid wage growth of 3.8% and rising inflation expectations. Now, recent US CPI data indicates that core inflation has cooled to 3.2%, shifting the focus from potential rate hikes to the possibility of rate cuts later this year, which alters the outlook for the dollar. Considering these changes, the trading strategy for USD/INR should shift from the bullish approach observed in early 2025. With oil prices stable and significant FPI inflows supporting the Rupee, any increases in the USD/INR pair are likely to be met with selling. We should look to sell on strength rather than buy on dips, as last year’s upward momentum has faded. The political events of last year, such as the criminal charges against Fed Chair Powell, remind us of how non-economic factors can cause volatility. Although that situation has passed, we should consider using options to guard against unexpected political or policy announcements. The current lower volatility environment may provide a good chance to buy protection or set up trades that benefit from sudden price movements. Create your live VT Markets account and start trading now.Gold trades just below $4,600, maintaining its bullish trend for the third day near recent peaks
Gold is holding steady near its record highs in the European session and might see even more gains if it goes above $4,600. Ongoing global conflicts and diplomatic issues make gold more appealing as a safe investment. At the same time, concerns about the US Federal Reserve’s decision-making are weakening the US Dollar from its recent high, making gold more attractive.
The latest US job report has lowered expectations for rate cuts from the Fed, which could limit gold’s price rise. Traders may wait and see how this week’s inflation data in the US unfolds before making big bets on gold. Recent military actions and diplomatic statements continue to create risk factors that affect market feelings.
Gold’s Technical Picture
Gold’s upward trend shows strong support in the $4,325-4,320 range, marked by the 200-period Simple Moving Average. Even though conditions might lead to some consolidation due to overbought signals, the overall bullish view remains if support levels hold. If gold breaks through current resistance, it could lead to further gains in a stable market. Market moods are described as “risk-on” or “risk-off,” which influence investment choices. In a “risk-on” scenario, investors favor riskier assets, enhancing currencies linked to commodity exports. On the other hand, “risk-off” times favor safer assets like bonds and gold, along with currencies such as the US Dollar, Japanese Yen, and Swiss Franc, which gain strength due to their stability. With gold near its peak, the current focus is on the risk-off sentiment driven by global tensions. Ongoing issues in Venezuela, Iran, and Ukraine are creating a strong demand for safe havens, reminiscent of the sharp price jumps we saw in late 2023. This ongoing geopolitical risk suggests that buying call options on gold futures, targeting prices above $4,600, could be a key strategy in the next few weeks.Considering Economic Data
Still, we need to be cautious about what the US Federal Reserve might do next, as strong economic data could hold back gold’s rise. The latest jobs report showed unemployment dipping to 4.4%, reminding us of how the Fed remained cautious through much of 2025, much like its approach in 2023. For traders, strategies like a bull call spread could help profit from expected price rises while managing risk if inflation report comes in higher than the predicted 3.5%, boosting the dollar. The technical indicators show an overbought RSI at 71.82, which often signals a possible pullback or consolidation. This gives traders a chance to hedge their long positions by buying short-term put options near the channel support at $4,365. This would provide some protection against sudden market shifts or a Fed focus on inflation over geopolitical issues. With powerful bullish fundamentals clashing with potentially bearish central bank policies, we can expect increased volatility around the US inflation data release this week. This situation is ideal for strategies based on volatility, such as a long straddle, which involves buying both call and put options at the same strike price. This approach would be profitable if gold makes a significant move in either direction after the data release, taking advantage of the current market uncertainty. Create your live VT Markets account and start trading now.The Japanese yen gains slight strength against a declining US dollar but nears a yearly low
The Japanese Yen is slightly stronger against a weaker US Dollar during the European session, remaining near a one-year low. Geopolitical tensions give support to the Yen, but its gains are limited due to possible early elections in Japan, issues with China, and uncertainty around the Bank of Japan’s (BoJ) rate hikes.
In the US, President Trump is considering military action in Iran, escalating global tensions alongside the ongoing Russia-Ukraine conflict. Additionally, concerns about the independence of the US Federal Reserve are causing the Dollar to weaken. The Nonfarm Payrolls report shows a 50K rise in December, falling short of expectations. The Unemployment Rate has dropped to 4.4%, leading to speculation about a possible Fed rate cut in the upcoming meeting.
The Bank Of Japan’s Stance
The Bank of Japan remains open to further tightening. Governor Ueda indicates that more rate hikes could happen if economic conditions meet forecasts. The 200-period Simple Moving Average on the USD/JPY chart indicates growing demand, but an overbought Relative Strength Index may limit short-term gains. Market participants are waiting for US inflation data to determine future movements in the USD/JPY pair. In “risk-off” scenarios, safe-haven currencies like the US Dollar, Japanese Yen, and Swiss Franc usually strengthen. The US Dollar gains due to its status as the world’s reserve currency; the Yen is supported by domestic investors holding Japanese government bonds; and the Swiss Franc benefits from strict banking regulations. These patterns reflect market sentiment during uncertain times. Looking back to 2025, the Yen gained temporary support amid geopolitical risks, while the Dollar weakened due to Fed independence concerns and disappointing payroll data. However, the strong Dollar trend has returned, with USD/JPY trading around 162.50. The divergence in monetary policies that began then has become a key market driver. The Bank of Japan followed through on Governor Ueda’s hawkish indications, raising its policy rate to 0.10% in the latter half of 2025. This move was expected and has not significantly halted the Yen’s decline, especially since recent data shows Japan’s GDP for Q4 2025 was nearly flat. This suggests that further BoJ rate hikes will be slow, reducing the Yen’s attractiveness.Fed’s Renewed Policy Narrative
While the Fed implemented some rate cuts in 2025 as anticipated, the narrative has changed this month. The latest US CPI data shows inflation stubbornly above 3%, prompting the market to reduce expectations for aggressive Fed easing. This ongoing policy divergence favors the US Dollar over the Japanese Yen. In the coming weeks, the current environment makes long USD/JPY positions via derivatives appealing, such as buying call options to bet on further gains. The interest rate differential, now over 5%, offers a significant positive carry for those holding the pair. Traders should consider selling out-of-the-money JPY call/USD put options to earn premium, reflecting the view that a major Yen strengthening is unlikely. The technical analysis from 2025 indicated an overbought RSI, leading to some short-term consolidation, but the pair eventually trended upwards. We are now monitoring longer-term moving averages, and any dips towards the daily 50-day SMA could create buying opportunities. Using derivative strategies like bull call spreads can provide a defined-risk method to position for a gradual upward trend in the USD/JPY. Create your live VT Markets account and start trading now.EUR/CAD rises above 1.6200 as the ECB’s rate-cutting cycle nears its end
**The Canadian Dollar and Oil Prices**
The Canadian Dollar may get a boost from rising oil prices. Supply risks from protests in Iran are affecting these prices. Iran exports nearly 2 million barrels per day and is the fourth-largest producer in OPEC, making this situation crucial for the global supply market.
In December, Canada added 8,000 jobs. However, unemployment increased to 6.8% as more people entered the job market. RBC pointed out that while the labor market is improving, it is still inconsistent.
The value of the Canadian Dollar is influenced by interest rates from the Bank of Canada (BoC), oil prices, and the overall health of the economy. Higher interest rates generally benefit the CAD, and rising oil prices also increase its value. Inflation rates and economic data are essential for assessing CAD’s strength.
**Expectations for the EUR/CAD**
The EUR/CAD has moved above 1.6200, mainly because traders expect the European Central Bank to keep its interest rate at 4.0%. Last month, Eurozone inflation reached the ECB’s target of 2.0%, giving the bank little reason to lower rates unless the economy worsens significantly. This steady policy makes the Euro an appealing option right now.
Nevertheless, the Canadian dollar has its own strengths that might limit the Euro’s rise. The BoC’s key interest rate stands at 5.0%, giving the CAD a notable yield advantage over the Euro. Although Canada’s unemployment rate increased to 6.8% in December, the job market does not show signs of severe decline, which means the BoC is not pressured to lower rates.
The biggest factor for the CAD at the moment is oil prices, which are experiencing strong upward momentum. West Texas Intermediate (WTI) crude is trading above $85 a barrel, a price we haven’t seen since last fall, mainly due to supply concerns linked to protests in Iran. Historically, geopolitical issues in the Middle East that threaten oil supplies, like the drone attacks in 2024, have led to higher oil prices and a stronger Canadian dollar.
**Geopolitical Risks and Market Volatility**
Traders should keep an eye on recent geopolitical risks, particularly talks about a NATO military presence in Greenland. This uncertainty often leads to higher market volatility and may not provide a clear direction for currencies. As a result, options strategies that aim to profit from price fluctuations, like long straddles, could be effective in the upcoming weeks.
Given these mixed factors, selling out-of-the-money call options on EUR/CAD could be a smart way to generate income because the pair’s potential gains may be limited by strong oil prices. For those expecting further strength in the loonie due to oil, buying put options on EUR/CAD could provide a way to bet on a downturn while maintaining defined and limited risk.
Create your live VT Markets account and start trading now.
Ralph Lauren’s stock rises 1.3% to $369.81, outperforming the S&P 500 and other indices
Ralph Lauren’s stock rose by 1.3% to $369.81, outperforming the S&P 500’s increase of 0.65%. The Dow Jones climbed by 0.48%, and the Nasdaq gained 0.82%. Over the last month, Ralph Lauren’s shares dipped by 0.69%, while the Consumer Discretionary sector grew by 2.38% and the S&P 500 went up by 1.15%.
The company’s upcoming earnings report is expected to show an EPS of $5.72, an 18.67% increase from last year. Anticipated revenue is $2.3 billion, which is a 7.27% rise compared to the same quarter last year. For the entire fiscal year, earnings are projected at $15.29 per share, with revenue expected to reach $7.75 billion.
Comparative Valuation Analysis
Ralph Lauren currently has a Forward P/E ratio of 23.88, higher than the industry average of 16.49. The PEG ratio stands at 1.78, while the Textile – Apparel industry average is 2.99. This industry ranks in the top 26% of all industries. According to the Zacks Rank system, Ralph Lauren is rated #3 (Hold), whereas #1 ranked stocks have historically achieved +25% annual returns. As we move into mid-January 2026, the outlook for Ralph Lauren appears mixed. Although the stock’s recent rise is a positive sign, it has lagged over the past month. The upcoming earnings release will be critical in setting the stock’s direction for the next quarter. The market has high expectations for the company, forecasting nearly 19% growth in earnings per share. This optimism is evident in the stock’s high Forward P/E ratio, which is well above the industry average. Derivative traders should be cautious; any shortfall in performance might trigger a significant drop, while a strong outcome is needed to support the current premium valuation. Recent economic data presents a mixed picture for consumer spending. The National Retail Federation reported that holiday sales for the 2025 season grew by 3.6%, which is strong but slightly lower than earlier optimistic predictions. This indicates that while consumer spending is steady, the market for luxury apparel might not be as vibrant as Ralph Lauren’s earnings forecast suggests.The Influence Of Future Guidance
In 2025, Ralph Lauren’s stock responded more to future guidance than to the actual earnings results. For instance, after the August 2025 earnings report, the stock initially rose when it beat estimates, but then fell as management provided a cautious outlook on European demand. This trend highlights the importance of the company’s forward-looking statements, which will likely play a key role in driving the stock’s price movements. As the earnings date approaches, implied volatility for Ralph Lauren options is likely to increase. The current neutral “Hold” rating and steady analyst estimates suggest a “wait-and-see” stance from the market, creating a potential for a significant price shift once new information is revealed. Therefore, options strategies that anticipate a surge in volatility or a decisive movement in either direction could be worthwhile. Create your live VT Markets account and start trading now.The AUD/JPY pair climbs towards 106.00, hitting levels not seen since July 2024 due to yen weakness.
AUD/JPY has increased for the second day in a row. This rise is driven by factors such as political uncertainty in Japan and possible early elections. The Reserve Bank of Australia’s (RBA) aggressive approach has also helped, though a weaker risk appetite may restrict further gains.
During Monday’s European session, the AUD/JPY cross reached 106.00, its highest level since July 2024. The Japanese Yen (JPY) is facing pressure due to uncertainty about the Bank of Japan’s next interest rate move and growing tensions with China.
Geopolitical Tensions and Economic Factors
China’s export restrictions on dual-use goods, like rare earth elements, have raised supply-chain risks for Japanese manufacturers, further weakening the JPY. Additionally, news about a possible snap election in Japan has contributed to the Yen’s decline, boosting AUD/JPY’s upward movement. The Australian Dollar benefits from the RBA’s likely interest rate hikes, which drive the AUD/JPY pair’s positive trend. However, ongoing global tensions could increase the JPY’s appeal as a safe-haven currency, potentially limiting AUD/JPY’s gains. The RBA affects the Australian Dollar by adjusting interest rates and other monetary policies, which helps maintain economic stability and can influence currency strength. Economic data and central bank actions, such as quantitative easing or tightening, also impact how strong the Australian Dollar is. The AUD/JPY cross has been climbing since our analysis from last year and is currently trading around 108.50. The main reasons for this strength—a proactive RBA and a cautious Bank of Japan—have played out as we predicted, reinforcing the current trend.Monetary Policy Impacts
The Reserve Bank of Australia implemented two more rate hikes in late 2025, raising the cash rate to 4.85% to tackle ongoing inflation. Australia’s recent quarterly CPI data for Q4 2025 stood at 3.5%, still above the RBA’s target range. This situation keeps the RBA in a hawkish stance, supporting the Australian Dollar. In Japan, the Bank of Japan ended its negative interest rate policy last year, but its single small increase has lagged behind tighter policies in other countries. Recent core inflation in Japan has dipped below the 2% target, allowing the BoJ to delay further major changes. This ongoing interest rate gap makes the yen an attractive option for carry trades. We think long call options on AUD/JPY are a smart trading strategy to ride this momentum. This approach lets traders benefit from potential gains toward the 110.00 level while clearly defining their maximum risk. Given the continuous geopolitical uncertainty throughout 2025, it’s crucial to manage downside risk. Implied volatility for the pair remains high, reflecting ongoing risks that haven’t completely settled. For those looking to hedge, buying out-of-the-money puts can offer protection against sudden “risk-off” events that might strengthen the yen. This balanced strategy allows participation in the upward trend while being prepared for any reversals. Create your live VT Markets account and start trading now.XAG/USD rises for the second day in early European trading, nearing $84.30 per troy ounce.
Silver prices are on the rise, currently at around $84.30 per troy ounce during early European trading. The price is moving within an ascending channel, which indicates a bullish trend. The 14-day RSI sits at 70.66, showing that Silver is overbought and may need to consolidate in the short term. Furthermore, both the nine-day and 50-day EMAs are trending upwards, reinforcing the positive outlook.
There is potential for Silver to reach its all-time high of $85.87, set on December 29, 2025. It could even climb to $88.40. Key support levels to watch are the nine-day EMA at $77.94 and the lower boundary of the channel at $76.40. If the price closes below these levels, we might see a shift toward the 50-day base at $64.39.
Silver is often seen as a safe investment and helps diversify portfolios. Its prices are influenced by factors like geopolitical issues, interest rates, and the US Dollar’s strength. Demand from industries such as electronics and solar energy in countries like the US, China, and India also affects price changes. Typically, Silver trends along with Gold, which is reflected in the Gold/Silver ratio.
Right now, Silver is approaching its all-time high of $85.87, displaying strong bullish momentum within its current channel. Yet, with the RSI indicating overbought conditions, we should be wary of a possible short-term pullback. The balance between this strong trend and stretched indicators will be crucial in the coming weeks.
Traders looking for a breakout may consider long positions, targeting the upper channel near $88.40 if Silver breaks past the $85.87 peak. This bullish perspective is backed by reports from late 2025 showing record industrial silver demand, especially in the solar and EV sectors. Demand for silver in global photovoltaics alone increased by over 15% last year, highlighting its underlying value.
On the other hand, the overbought RSI may present an opportunity for those anticipating a price drop to look at put options or selling calls. The recent price surge was primarily due to rate cuts by the Federal Reserve in late 2025, but new inflation data has cast doubt on further cuts. A shift towards a more hawkish stance from policymakers could lead to a correction toward the first support level at $77.94.
Keep an eye on the Gold/Silver ratio for insights on relative value. In 2025, this ratio significantly compressed from over 85:1, as Silver’s industrial demand helped it perform better than Gold. Any stall in this compression could signal that Silver’s strong performance is losing strength compared to the wider precious metals market.
Since Silver is currently stretched but maintains a strong trend, traders who are unsure of the direction might explore options that benefit from significant price movements in either direction. For those already holding long positions, it may be wise to tighten stop-loss orders just below key support levels like the nine-day EMA at $77.94. A break below this level would suggest a deeper, more significant correction is underway.
Dividend Adjustment Notice – Jan 12 ,2026
Dear Client,
Please note that the dividends of the following products will be adjusted accordingly. Index dividends will be executed separately through a balance statement directly to your trading account, and the comment will be in the following format “Div & Product Name & Net Volume”.
Please refer to the table below for more details:
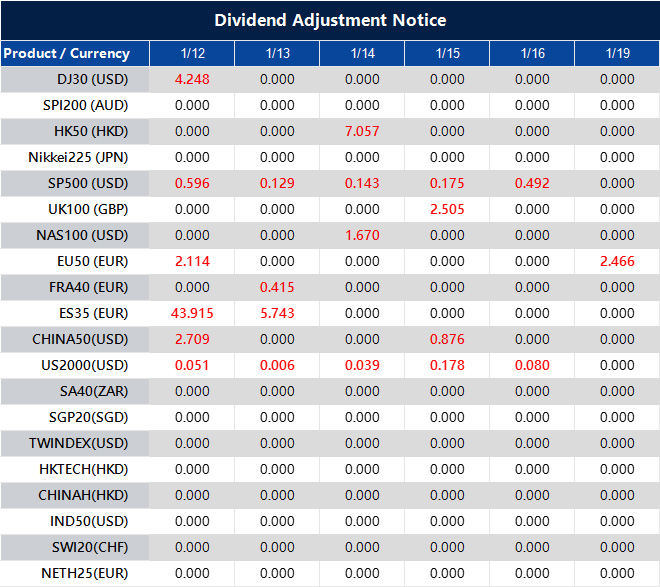
The above data is for reference only, please refer to the MT4/MT5 software for specific data.
If you’d like more information, please don’t hesitate to contact [email protected].


