Gold prices rise today in the United Arab Emirates, according to financial data
Gold prices in the United Arab Emirates rose on Wednesday, according to FXStreet. The price per gram increased to 574.53 AED, up from 561.64 AED on Tuesday.
The price for a tola reached 6,701.27 AED, compared to 6,550.89 AED the day before. FXStreet adjusts international prices to AED, providing updates daily based on market rates.
The Dow Futures (YM) cycle has ended with five waves, indicating a corrective pullback is underway.
Current Market Phase
The Dow Futures (YM) recently completed a five-wave pattern starting from the low on November 21, 2025, marking the end of wave 1. Following this, wave ((i)) increased to 49,299, then wave ((ii)) corrected down to 48,092. In wave ((iii)), wave (i) climbed to 48,686, while wave (ii) pulled back to 48,556. Then, wave (iii) rose to 49,463, followed by a small pullback in wave (iv) to 49,096, and finally, wave (v) peaked at 49,899, completing wave ((iii)). Next, the index corrected down to 49,001 in wave ((iv)), before moving up again to 49,899, which completed wave 1. Right now, the Dow Futures is in wave 2, showing a zigzag pattern from the peak of wave 1. Wave (i) dropped to 49,057, wave (ii) increased to 49,799, and wave (iii) fell to 48,689. Currently, wave (iv) is bouncing back to 49,095. We expect wave (v) of ((a)) to finish soon. After this, wave ((b)) will likely rally to cover the cycle from the January 13, 2026 high, before the index continues its downward trend within the larger corrective phase. The strong rally since the low on November 21, 2025, seems to have run its course, finishing a five-wave cycle. The market is now in a corrective phase, meaning recent gains have paused. This change indicates that strategies based on continuous highs may no longer be effective. This pullback matches recent economic updates. The CPI report for December 2025 showed a slight rise in inflation to 3.1%, surprising those who anticipated a cooling trend. Moreover, the VIX (a measure of market fear) increased from below 15 at the end of 2025 to around 20 now, indicating rising uncertainty among investors after the sharp rise. Based on the current situation, we anticipate a brief rally, or a “bull trap,” in the days ahead. Derivative traders may see this temporary rise as a chance to take bearish positions at favorable prices. This could involve selling call spreads or getting ready to buy puts as the market approaches resistance levels.Strategy and Outlook
Historically, this pattern is common after a strong, multi-month rally. We observed similar healthy pullbacks in 2023. These consolidation times are essential before a larger trend can continue. Thus, our immediate focus should be on managing risk for potential downside. Once the corrective rally is over, the market is expected to decline again, completing the broader downward correction. Traders should look for signs of the rally losing steam to position themselves for potential profits from a decline. The main strategy in the upcoming weeks will be to take advantage of this expected second leg down. Create your live VT Markets account and start trading now.Dividend Adjustment Notice – Jan 21 ,2026
Dear Client,
Please note that the dividends of the following products will be adjusted accordingly. Index dividends will be executed separately through a balance statement directly to your trading account, and the comment will be in the following format “Div & Product Name & Net Volume”.
Please refer to the table below for more details:
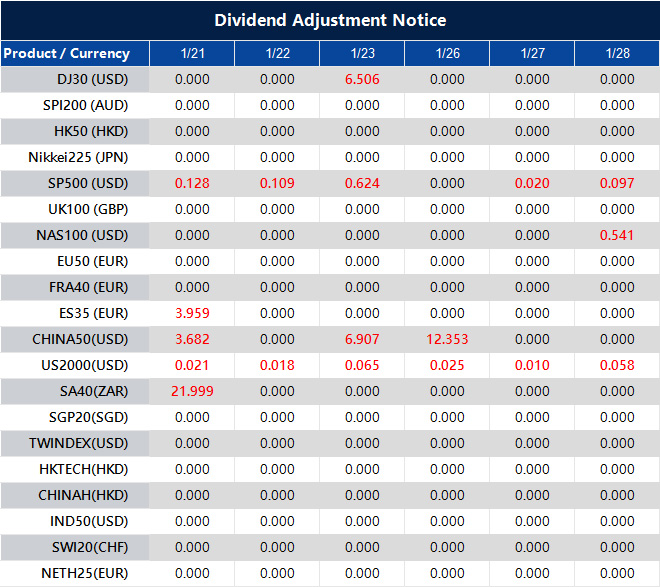
The above data is for reference only, please refer to the MT4/MT5 software for specific data.
If you’d like more information, please don’t hesitate to contact [email protected].
Despite US-EU tensions, USD/CHF recovers and trades near 0.7910 after three-day decline
The USD/CHF pair has bounced back above 0.7900, breaking a three-day decline. This shift comes amid rising tensions between the US and the EU. The US Dollar is facing pressure from a “Sell America” sentiment, while the Swiss Franc is benefiting from growing risk aversion.
US President Donald Trump’s comments on Greenland and possible new tariffs on EU nations are causing worries about economic growth. EU countries might target $10 trillion in US assets, with potential tariffs on $93 billion of US goods if a deal on Greenland isn’t reached.
Labor Data Could Affect Rate Cut Expectations
Recent US labor data may support the Dollar, postponing Federal Reserve rate cut expectations until June. Swiss Producer and Import Prices dropped 1.8% year-over-year in December 2025, marking the largest deflation since September and challenging forecasts. The Swiss Franc, viewed as a safe-haven currency due to Switzerland’s stable economy and political neutrality, is greatly impacted by the Eurozone’s economic condition. The Swiss National Bank aims to keep inflation below 2% and adjusts interest rates to manage price growth. Swiss macroeconomic data plays a significant role in determining the CHF’s value, affecting its strength and stability. The recent bounce in USD/CHF above 0.7900 appears temporary, influenced by opposing forces. The primary tension seems to be between the Swiss Franc’s safe-haven demand due to US-EU political risks and a US Dollar buoyed by the Federal Reserve’s cautious approach. This clash introduces considerable uncertainty for the pair’s future direction. The credibility of the “Sell America” threat is often underestimated given the depth of economic connections. US-EU trade was over $1.3 trillion in 2024, meaning new tariffs would significantly affect the economy. Furthermore, European entities held over $1.5 trillion in US Treasury securities by the end of 2025, suggesting even a minor collective shift away could lead to major weakness in the US Dollar.Strategic Approaches to Manage Volatility
Amid this uncertainty, focusing on market volatility is a wise strategy. Broader risk indicators like the VIX index have risen from a low of 14 toward 20, signaling that investors are factoring in higher risk. Strategies such as long straddles or strangles in USD/CHF could benefit from significant price movements in either direction. We should also acknowledge the deflationary pressures in Switzerland, illustrated by the 1.8% drop in producer prices. This is reminiscent of the deflationary situation in 2015, which kept the Swiss National Bank in an accommodating position for several years. Domestic weakness in Switzerland may limit the Franc’s strength and prevent a significant drop in the USD/CHF pair. Consequently, purchasing USD/CHF put options is a strong way to prepare for potential declines driven by geopolitical tensions. This strategy allows us to take advantage of a shift to the safe-haven Franc while clearly defining our maximum risk to the premium paid. If Swiss deflation concerns trump geopolitical issues, our losses are contained. Create your live VT Markets account and start trading now.Gold prices in Pakistan rise today, according to new market data
Gold Remains a Safe-Haven Asset
Current Gold Prices:
– 1 gram: 43,773.67 PKR
– 10 grams: 437,672.30 PKR
– 1 tola: 510,584.80 PKR
– 1 troy ounce: 1,361,509.00 PKR
FXStreet reports these prices by adjusting international rates daily for local markets.
Gold is commonly used to store value and conduct transactions. It’s considered a safe-haven asset, protecting against inflation and currency decline since it’s not linked to any government or issuer.
Central banks buy gold to back their currencies. In 2022, they set a record by purchasing 1,136 tonnes. Countries like China, India, and Turkey are also increasing their gold reserves.
Gold prices often move in the opposite direction of the US Dollar and US Treasuries. Prices rise during geopolitical instability or recession fears and fall when interest rates are high. Since gold is priced in dollars, its value is closely related to the dollar’s performance.
**Current Market Dynamics**
As of January 21, 2026, gold prices appear to have a supportive setup. The market is anticipating interest rate cuts from the US Federal Reserve in the first half of the year, making yield-bearing assets like bonds less attractive. This shift enhances the appeal of gold, which provides no yield.
The performance of the US Dollar is crucial, and its recent weakness is boosting gold prices. The Dollar Index (DXY) is around the 101 level, significantly lower than its highs over the past two years. This decline makes gold cheaper for those using other currencies. We expect this softer dollar trend to continue if the market anticipates looser monetary policy.
Demand for gold remains strong as a hedge against ongoing geopolitical issues and fears of a slowdown in global economic growth. Recent volatility in major stock indices has prompted investors to seek safety, benefiting precious metals. This defensive approach should help support gold prices in the coming weeks.
Looking back, the record gold purchases by central banks in 2022 have continued. Central banks, especially in emerging markets, added to their gold reserves throughout 2024 and 2025 to diversify away from the US dollar. This consistent buying creates strong demand, limiting the risk of price drops.
For traders, the current environment suggests that long positions in gold futures could be a good option. Purchasing call options that expire in two to three months allows for potential price gains while managing risks. Look for dips near the $2,350 per ounce level as potential entry points for these strategies.
Create your live VT Markets account and start trading now.
Gold prices in India increased today, according to available data sources.
Gold prices in India went up on Wednesday, as reported by FXStreet. The price reached 14,288.02 Indian Rupees (INR) per gram, up from 14,003.68 INR on Tuesday. The rate for gold per tola rose to 166,653.70 INR from 163,336.10 INR the previous day.
FXStreet adjusts gold prices in dollars based on local currency and measurement units. Daily updates reflect current market rates at the time of publication, and local prices may vary slightly.
Gold as a Safe Haven
Gold is known for being a reliable store of value and a means of exchange, especially during tough times. It acts as protection against inflation and currency declines, as it is not tied to any government or issuer. Central banks hold a significant amount of gold to support their currencies. In 2022, they added 1,136 tonnes, worth $70 billion, to their reserves. Countries like China, India, and Turkey are rapidly building their gold reserves. Gold prices often move in the opposite direction of the US Dollar and Treasury bonds. When the Dollar weakens, gold prices usually increase. Geopolitical tensions and fears of an economic downturn can drive up gold’s value. Low interest rates benefit gold prices, whereas higher rates can make it less attractive. Today’s rising gold prices show its importance as a safe investment during uncertain times, suggesting traders are seeking security amid economic challenges. Derivative traders should pay attention to this growing interest in safe assets.Central Banks and Gold Demand
This trend is supported by strong central bank buying that continued last year. In 2025, central banks around the world added over 950 tonnes to their reserves, indicating a clear strategy to diversify away from the dollar. This steady demand from institutions helps support gold prices. The recent US inflation report for December 2025 showed a stubborn rate of 3.4%, reminding us that inflation concerns are still relevant. As a traditional hedge against inflation, gold is becoming more attractive to those worried about losing purchasing power. This situation may make call options on gold appealing if inflation continues to be an issue. In the last quarter of 2025, the stock market cooled down, with the S&P 500 retreating from its highs. Such sell-offs in riskier assets often lead investors to seek safety in gold. Traders might think about using gold derivatives to protect against potential weaknesses in the equity market in the coming weeks. However, a strong US dollar poses a challenge for gold. The DXY index remains above 105. The Federal Reserve’s stance of keeping interest rates high for an extended period, emphasized in late 2025, is contributing to the dollar’s strength. A rising dollar often limits gold’s potential for growth, making the trading landscape more complex. Create your live VT Markets account and start trading now.Gold prices have increased today in Malaysia, according to compiled data
Gold prices in Malaysia increased on Wednesday. The cost for one gram rose to 632.70 Malaysian Ringgits, up from 620.34 MYR on Tuesday. For a tola, the price went up to 7,379.74 MYR from 7,235.50 MYR the day before.
FXStreet calculates local prices by adjusting international market rates. Daily updates show market values at the time of publication, but local prices may vary slightly.
Gold as a Safe Haven
Gold is seen as a reliable store of value and a safe-haven asset, especially in uncertain times. It is often used to protect against inflation and currency decline. Central banks hold the most gold, seeking to strengthen their currencies. In 2022, they purchased 1,136 tonnes, the highest amount in a single year. Countries like China, India, and Turkey have notably increased their gold reserves. Gold prices typically move in the opposite direction of the US Dollar and Treasuries. When the Dollar weakens, gold prices usually rise, providing a diversification option. Factors affecting gold prices include geopolitical events, interest rates, and the strength of the Dollar. A strong Dollar often keeps gold prices low, while a weaker Dollar can drive them up. Currently, gold prices are rising, aligning with its traditional role as an inflation hedge. Recent inflation data from December 2025 showed a rate of 3.4%, slightly above expectations. This could lead traders to explore call options or bull call spreads to benefit from further price increases in the upcoming weeks.Institutional Buying and Market Dynamics
The strength in gold prices is supported by significant buying from institutions, especially central banks. In 2025, central banks aggressively purchased gold, adding over 800 tonnes to global reserves, according to the World Gold Council. This consistent demand creates a solid support level for gold, making short selling risky at this time. The recent behavior of the US Dollar also plays a vital role in gold pricing. After interest rate cuts in late 2025, the Federal Reserve has taken a more cautious approach, creating uncertainty about future actions. This uncertainty could cause increased volatility in gold, making strategies like long straddles, which profit from price movement in either direction, appealing. Given gold’s status as a safe haven, it is becoming increasingly relevant as a hedge in investment portfolios. With stock markets showing signs of fatigue after last year’s strong performance, maintaining long positions in gold through futures or options can help mitigate potential stock market losses. Any rise in geopolitical tensions could heighten this flight-to-safety trend, pushing gold prices even higher. Create your live VT Markets account and start trading now.Euro weakens to around 185.25 while JPY strengthens amid tariff concerns
The EUR/JPY pair has weakened to around 185.25 in early European trading. The Japanese Yen may gain strength from safe-haven demand, but worries about Japan’s fiscal health could limit its rise.
Japan’s Prime Minister Sanae Takaichi has called for snap elections on February 8 and plans to ease fiscal policy. Takaichi’s proposals to cut taxes and boost spending raise concerns about Japan’s financial stability, which could impact the Yen and the EUR/JPY pair.
Technical Analysis
From a technical standpoint, the EUR/JPY remains above the 100-day EMA at 179.43, showing a strong upward trend. The price is nearing the upper Bollinger Band at 185.45, while the RSI at 61 indicates bullish momentum. Key support levels are identified at 184.00 and the 100-day EMA at 179.43. The Japanese Yen, one of the most traded currencies globally, is affected by various economic factors. These include the Bank of Japan’s policies, bond yield differences, and trader sentiment. The Yen is seen as a safe-haven currency, gaining strength during periods of market stress due to its perceived reliability. Currently, the EUR/JPY pair is hovering around 185.25, caught between a strong upward trend and emerging geopolitical risks. US tariff threats are increasing demand for the safe-haven Yen, placing a temporary limit on the pair’s rise. This scenario creates a balance between bullish momentum and risk-averse sentiment that must be navigated carefully. The upcoming snap election in Japan on February 8 is likely to weigh on the Yen. With Japan’s debt-to-GDP ratio exceeding 263% in 2025, Prime Minister Takaichi’s fiscal stimulus promises are unsettling bond markets. This fundamental issue for the Yen supports the idea of a higher EUR/JPY in the medium term.Safe Haven Dynamics
Nonetheless, immediate safe-haven flows are significant. The Cboe Volatility Index (VIX) has risen from a low of 13 to over 17 this past week, indicating that traders are factoring in new geopolitical uncertainty. This volatility can lend short-term support to the Yen and possibly pull prices down toward the 184.00 support level. We recall how the Yen responded to the Bank of Japan’s policy changes throughout 2025, leading to sharp, though often brief, price movements. While the central bank’s gradual policy adjustments have been a backdrop, this new fiscal uncertainty is now the main driving force. The market is balancing the potential for future currency devaluation against immediate risk aversion. Given this situation, there is an opportunity in the options market, as implied volatility is expected to rise ahead of the election. Consider buying call options to prepare for a potential price increase while keeping risk manageable. A break above the resistance level of 185.45 could lead to a significant upward movement. Create your live VT Markets account and start trading now.GBP/USD strengthens for third session, supported by positive UK employment growth data
**Global Market Dynamics Impacting GBP/USD**
GBP/USD is performing well, currently around 1.3430. This positive movement follows UK employment data that showed an increase of 82,000 jobs in the three months leading up to November. Average pay has also risen: up 4.5% year-on-year without bonuses, and up 4.7% with bonuses. The unemployment rate remains steady at 5.1%.
Market participants are now looking forward to the December data for the UK Consumer Price Index, Producer Price Index, and Retail Price Index. Despite concerns about wage growth and potential interest rate cuts from the Bank of England, broader market forces are putting pressure on the Pound.
Global tensions and uncertainties in trade are affecting risk sentiment. This is impacting US equities and weakening the US dollar. The weaker USD, combined with geopolitical tensions, is helping the GBP rise despite concerns about domestic data.
GBP/USD has seen an uptick to 1.3463, which is up 0.30%. Traders have been selling US assets, contributing to the dollar’s recent struggles. Additionally, changes in the bond market in Japan are raising concerns about fiscal policy and the economy in that region. Overall, the currency pair is sensitive to global economic events and market conditions.
We see the pound stabilizing around 1.3450, largely due to the weaker US dollar. The positive employment figures showing an increase of 82,000 jobs in late 2025 are providing support. However, slower wage growth creates a mixed picture for the UK economy.
**UK Economic Indicators and Strategies**
The key UK Consumer Price Index (CPI) data for December 2025 has been released, showing 4.0%, which aligns with expectations. Although this is down from previous highs, it remains double the Bank of England’s 2% target, complicating any quick plans for interest rate cuts. Persistent inflation pressures the central bank despite some softer economic signals.
High market anxiety, reflected in the VIX volatility index near 25, means options prices are elevated. The prevailing “Sell America” sentiment, driven by trade tensions, is a significant factor, but this can shift rapidly. Therefore, outright buying of calls or puts is pricey. Instead, strategies like spreads may offer a better risk-reward balance.
A key uncertainty in the coming weeks is when the Bank of England might cut rates. The market currently anticipates cuts in the latter half of the year, but stubborn inflation could delay this timeline. It’s wise to look into options contracts that expire after the next two Bank of England meetings to prepare for any shifts.
We should consider strategies that take advantage of significant price moves, regardless of direction, as the market assesses these mixed signals. A long straddle strategy, which involves buying both a call and a put option, could be effective ahead of the next major data release or central bank announcement. This approach profits if GBP/USD makes a sharp move up or down, which seems likely given the current landscape.
Create your live VT Markets account and start trading now.
Concerns about Greenland cause the Australian Dollar to weaken against the strengthening US Dollar
The Australian Dollar dipped slightly after two days of gains, even though Westpac’s Leading Economic Index rose by 0.1% in December 2025. The economic recovery seems to be extending into early 2026, with the six-month annual growth rate rising to 0.42%.
Despite concerns between the US and Greenland, the US Dollar recovered its losses. The US Dollar Index was around 98.60 as the US plans new tariffs on some EU countries amid tensions with Greenland. The Federal Reserve may wait to cut rates until there is clear evidence that inflation reaches the 2% target.


