NZD/USD eased in the US session, moving back towards 0.5880 as the US Dollar weakened despite ongoing geopolitical risks. The Dollar had earlier been supported by safe-haven demand linked to tensions around the Strait of Hormuz, but later lost traction as US yields fell and sentiment improved.
Market focus also turned to US monetary policy after President Donald Trump repeated his preference for lower interest rates. He said he would be “disappointed” if Kevin Warsh did not cut rates “right away” if confirmed as the next Federal Reserve Chair.
Fed Policy Debate
Warsh said most presidents tend to prefer lower rates and stated that Federal Reserve independence rests with the institution. He said tariff-related inflation risks have eased somewhat, and argued that a smaller balance sheet could support lower rates, improved inflation, and stronger economic growth.
He also criticised forward guidance and called for changes to policy tools, communication methods, and the inflation framework. He added that current data used to assess inflation is “quite imperfect”.
On the four-hour chart, NZD/USD trades at 0.5888, below the 20-period SMA at 0.5891 and above the 100-period SMA at 0.5813, with RSI near 50. Resistance levels are 0.5891, 0.5904, 0.5907, and 0.5965, while support sits at 0.5887, 0.5874, and 0.5813.
We remember looking back to 2025 when there was significant political pressure on the Federal Reserve to cut interest rates. At that time, NZD/USD was struggling below 0.5900, caught between geopolitical risk and a US dollar that was beginning to soften. This period of uncertainty set the stage for the policy divergence we are now seeing.
Those discussions from last year about changing the Fed’s communication style have since become reality under the new leadership. With less forward guidance, Fed meeting outcomes are now more uncertain, causing spikes in short-term volatility around announcement dates. This has fundamentally changed how we must hedge and position for event risk.
Current Market Outlook
As of today, April 22, 2026, the NZD/USD is trading near 0.6150, reflecting the rate cuts the Fed delivered through late 2025 and early 2026. However, with the most recent US CPI data showing inflation stubbornly holding at 3.1%, the market is now pricing in a pause from the Fed. This puts a temporary floor under the US dollar.
Given this dynamic, we see value in selling options to collect premium, as the pair may enter a period of consolidation. The one-month implied volatility for NZD/USD options is currently at 9.8%, which is a reasonable level to be selling. A short strangle, with strikes at 0.6000 and 0.6300, appears attractive for the coming weeks.
This strategy benefits from time decay and the view that the pair will trade within this range as the market awaits fresh inflation data. The main risk to this position would be an unexpectedly weak US jobs report or a surprisingly hawkish statement from the Reserve Bank of New Zealand. The support level we watched back in 2025 near 0.5900 now seems a distant memory but serves as a reminder of how quickly sentiment can shift.
AUD/USD fell more than 0.30% in North American trading, last at 0.7153 after a daily high of 0.7185. Risk-off conditions supported the US Dollar after Iran did not attend talks in Pakistan.
Pakistan’s efforts to bring Iran to talks did not succeed, while the US extended a ceasefire while awaiting an Iranian proposal. The US also said the blockade in the Strait of Hormuz would remain.
Risk Aversion Returns
Iranian state TV reported that Iran does not recognise the ceasefire and may not follow it. The report said Iran would act in line with national interests.
US Retail Sales rose 1.7% month-on-month in March, up from 0.7%, while annual growth stayed at 4%. The ADP Employment Change four-week average increased to 54.8K from 39K.
In Australia, the calendar was sparse, while the RBA said it is focused on avoiding a rise in medium-term inflation expectations. Markets priced 77% odds of a rate rise on 4 May and another increase on 28 September.
Technically, the pair stalled near 0.7180 and moved towards 0.7150, with RSI turning lower. Support is at 0.7129, then 0.7100 and the 50-day SMA at 0.7046; resistance is 0.7187 and 0.7221.
Derivatives And Hedging Strategies
We are seeing a familiar pattern of risk aversion that mirrors the tensions from the Trump administration era. Renewed friction in the Middle East is once again boosting the US Dollar’s safe-haven appeal. This is creating headwinds for risk-sensitive currencies like the Australian Dollar.
This time, the US Dollar’s strength isn’t just about geopolitics; it’s backed by solid economic performance. Recent data showed US Core CPI remains stubbornly above the Fed’s target at 3.8%, and the labor market added a robust 303,000 jobs last month, keeping pressure on the Federal Reserve to delay any rate cuts. This fundamental strength in the US economy puts a ceiling on any potential AUD/USD rally.
Meanwhile, the Reserve Bank of Australia is in a difficult position, much like it was in the past. While the RBA remains hawkish to combat domestic inflation, which is currently running at a 3.6% annual pace, its efforts are being overshadowed by the global flight to safety. This dynamic suggests that even positive Australian news might not be enough to push the Aussie significantly higher against the greenback.
For derivative traders, this environment of conflicting central bank policies and geopolitical risk points toward rising volatility. We should consider buying straddles or strangles on the AUD/USD, which would profit from a large price swing in either direction without needing to predict the specific outcome. The pair is currently trading near 0.6550, a far cry from the 0.7150 levels seen during that previous standoff, indicating the market is already positioned more cautiously.
Those with a bearish view on the Aussie should look at buying put options or establishing bear put spreads to define risk. If the AUD/USD breaks below the key support level of 0.6500, it could trigger a rapid decline toward last year’s lows. Looking back, we saw how a breach of the 0.7100 level in that past scenario opened the door for a sharp move lower, a history that could repeat itself.
Given the uncertainty, using derivatives for hedging is a prudent strategy for anyone with exposure to the Australian Dollar. Businesses expecting payments in AUD could purchase forward contracts or AUD puts to lock in a floor for their exchange rate. This protects against the downside risk presented by a strong US Dollar and souring market sentiment.
Japan’s April Financial System Report says the banking system is broadly stable. It says lending is working smoothly as loan demand rises and banks keep lending actively, with no major imbalances seen.
The report says banks have enough capital and stable funding to cope with severe stress. These scenarios include conditions like the global financial crisis and a combined shock from geopolitical risk, higher oil prices, weaker AI-related expectations and rising interest rates.
Banking Stability And Key Risks
It says risks still need close monitoring. It points to geopolitical developments in the Middle East, policy changes across jurisdictions and weaknesses in the non-bank financial sector.
Over time, the report says structural factors could weigh on profitability. It links this to falling loan demand tied to population trends, which could lead to less lending activity or higher risk-taking.
Japan has announced the largest reform of its defence export rules in decades. The changes remove most limits on overseas arms sales and allow exports such as warships, missiles and other weapons, shifting from its postwar policy.
Japan will keep strict screening and bans on sales to countries involved in conflict, with possible national security exceptions. The government plans to raise defence spending beyond 2% of GDP.
Options Strategy Implications
The recent report on Japan’s financial stability gives us confidence that the system can handle significant stress. For traders, this reduces the “tail risk” associated with Japanese bank stocks, suggesting that options premiums on financials may not see dramatic spikes from domestic fears. We can therefore consider strategies that benefit from lower-than-expected volatility in the banking sector.
Looking back, we saw the Bank of Japan begin its policy normalization in 2024, and this stability report gives them a stronger foundation to continue. This underlying strength in the financial system supports a stable or even stronger yen, especially if the US Federal Reserve signals rate cuts later this year. This makes call options on the yen, or put options on the USD/JPY currency pair, an increasingly interesting hedge.
The major shift is in defense, where relaxed export rules and higher spending create a clear growth story. Based on the government’s commitment to push spending past 2% of GDP, a goal that started taking shape back in 2025, specific companies are set to benefit. We should look at long-dated call options on key defense players like Mitsubishi Heavy Industries and Kawasaki Heavy Industries to capitalize on this multi-year trend.
This presents a paired strategy of buying volatility in the defense sector while potentially selling it in the financial sector. The government’s defense spending, which exceeded ¥7.9 trillion last year, acts as a direct stimulus for specific industrial stocks. Meanwhile, the stable banking report acts as a calming influence on the broader market, as measured by the Nikkei 225 Volatility Index, which has remained below the 20-point mark for most of this quarter.
While the system is stable, we must still watch for external shocks like rising oil prices, which could impact Japan’s economy. A prudent approach would be to use a portion of the potential gains from defense-related trades to buy cheap, out-of-the-money put options on the broader Nikkei 225 index. This provides a cost-effective hedge against the very geopolitical risks that are fueling the defense sector’s expansion.
South Korea’s Producer Price Index rose by 1.6% month on month in March. This was up from 0.6% in the previous month.
The data shows faster month-to-month growth in producer prices in March than in February. No further breakdown was provided in the release.
Producer Prices Signal Inflation Risk
We see this jump in producer prices as a clear warning sign for incoming consumer inflation. The 1.6% month-over-month increase is the sharpest acceleration we have seen in over a year, suggesting companies will soon pass these higher costs on to customers. This puts significant pressure on the Bank of Korea to reconsider its neutral stance on interest rates.
This latest PPI data aligns with other recent figures that point toward persistent inflation. The most recent March CPI data showed a year-over-year increase to 3.4%, already at the upper edge of the central bank’s comfort zone. Furthermore, the Korean won has weakened against the dollar by over 3% in the past month, trading near 1,380, which increases the cost of imported goods and energy.
Given this, we anticipate a hawkish shift from the Bank of Korea at its next meeting. Traders should consider positioning for a stronger won, as the market begins to price in the possibility of a rate hike instead of a cut. We are looking at selling USD/KRW non-deliverable forwards or buying call options on the won.
This inflationary pressure makes Korean government bonds look less attractive at current yields. We expect yields on the 3-year and 10-year Korea Treasury Bonds (KTBs) to rise, causing their prices to fall. A potential strategy is to short KTB futures to capitalize on this expected price decline.
Equities Face Higher Rate Headwinds
For the equity market, higher potential interest rates are a headwind for the KOSPI index. Looking back at how the market reacted to the rate hikes throughout 2025, we recall that technology and growth-oriented stocks were particularly sensitive to rising borrowing costs. We believe hedging long positions with KOSPI 200 put options is a prudent move in the coming weeks.
South Korea’s producer price index rose by 4.1% year on year in March. This was up from 2.4% in the previous period.
The data shows faster producer-level price growth in March than earlier. It indicates a rise in price pressures faced by producers compared with the prior reading.
Producer Price Surge Signals Rising Inflation
The jump in producer prices to 4.1% is a significant inflation signal for the South Korean economy. This data suggests that cost pressures are building for companies, which will likely be passed on to consumers in the coming months. We should anticipate the Bank of Korea (BOK) shifting to a more hawkish tone in its upcoming statements.
Given this, we see potential strength in the Korean Won, as expectations for a rate hike will grow. The USD/KRW has been elevated, trading near 1,380, a level we haven’t seen consistently since late 2025. Traders should consider buying KRW call options or selling USD/KRW futures to position for a potential move lower in the currency pair.
For the equity market, this inflation data presents a headwind. The KOSPI 200 index is up about 5% year-to-date but has stalled below key resistance, and the threat of higher borrowing costs could trigger a pullback. We believe purchasing put options on the KOSPI 200 or shorting its futures offers a good hedge against this risk.
We remember the sharp BOK rate hikes throughout 2025 that were triggered by similar persistent inflation signals, making their current inaction less likely. The Bank of Korea has held its rate at 3.50% for four meetings, but this data challenges that stability. Consequently, we anticipate yields on Korean Treasury Bonds to rise, making short positions on KTB futures an attractive strategy.
Bond Yields May Rise On Renewed Hawkish Expectations
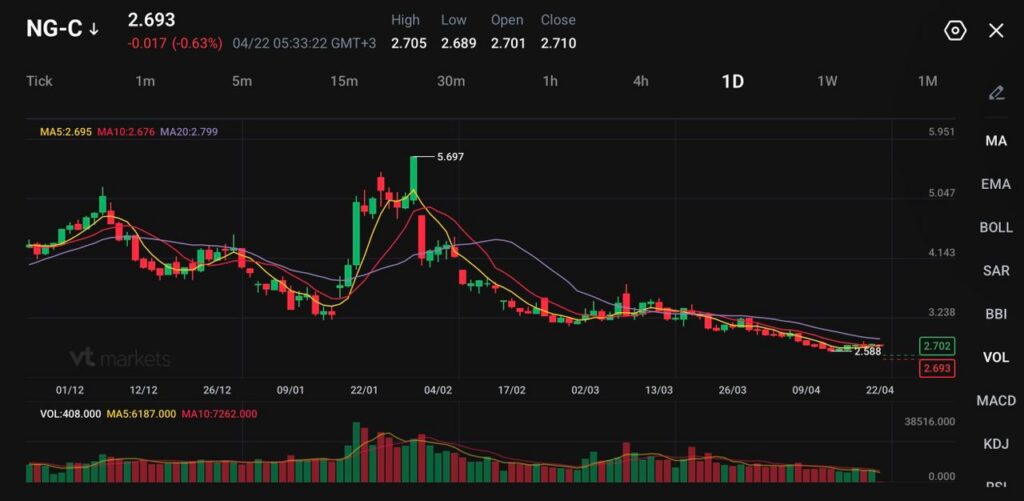
NG-C trades at 2.693, down 0.017 (-0.63%), after a high of 2.705 and a low of 2.689.
US working gas in storage stood at 1,970 Bcf for the week ending April 10, which was 108 Bcf above the five-year average of 1,862 Bcf.
LNG feedgas flows have stayed strong at around 18.9 bcfd in April, but mild weather and elevated inventories are still capping the upside.
US natural gas remains under pressure because the domestic supply-demand balance still looks soft. Futures are hovering near $2.69 to $2.70 per MMBtu, close to the lowest levels since late 2024, even after a recent five-session bounce.
The market has tried to build support from lower production and strong LNG flows, but those positives have not been strong enough to override the larger storage and weather story.
Eni and Repsol plan to start exporting natural gas from Venezuela by the end of 2031 after reaching a deal with Caracas to revive a long-stalled effort to expand production from a massive offshore field. https://t.co/Nk7qiegtti
That is the key point. Natural gas is not lacking bullish inputs altogether. It is just facing a much heavier bearish weight from mild spring conditions and comfortable inventories.
Output Cuts Fall Short
Production has eased meaningfully in recent weeks. Average output fell by about 3.9 bcfd over the past 15 days to roughly 108.2 to 108.3 bcfd, which marked an 10- to 11-week low depending on the series used. That decline has been one of the main reasons prices stopped falling in a straight line.
Several liquefied natural gas tankers reversed course en route to the Strait of Hormuz after Iran warned ship captains that the vital channel is once again closed to maritime traffic. https://t.co/wHDxdRzPMa
In a tighter market, a drop of that size would likely have triggered a stronger rally. This time, it has only slowed the decline because inventories remain comfortable and weather has not generated the kind of heating or cooling demand that would really tighten balances.
A cautious near-term view still says production weakness can stabilise prices, but it may not be enough to drive a durable breakout unless demand improves as well.
LNG Strength Meets Capacity Constraints
LNG feedgas demand has also remained supportive. Flows to the major US export plants have climbed to around 18.9 bcfd in April, up from about 18.6 bcfd in March and close to record territory. US LNG exports hit an all-time high in March as plants ran above nameplate capacity and new units came online.
That matters because LNG has been one of the few consistent sources of demand growth in the US gas market. The problem is that the market already knows this. When export terminals are already running hard, the upside from “strong LNG” diminishes unless there is additional capacity or domestic supply falls further.
That is why gas can still feel heavy even with near-record feedgas flows. The bullish export story is real, but it is not new enough to overwhelm loose domestic fundamentals.
Storage Is Still The Bigger Story
Storage remains the cleanest reason the market cannot sustain much upside. The latest EIA data showed inventories at 1,970 Bcf, which is 126 Bcf higher than last year and 108 Bcf above the five-year average. That leaves stocks roughly 6% above the five-year norm, and other market summaries have described the overhang as around 7% depending on the cut-off week used.
That is a comfortable starting point for the injection season. When storage enters spring above average and the weather stays mild, traders do not need to price scarcity. They price how quickly the system can keep refilling.
This is what keeps every rally attempt contained. Strong LNG flows and lower output help, but ample stocks make it hard for the market to panic higher.
Weather Turns Against Bulls
Forecasts have also moved in an unhelpful direction for price. The market had earlier found some support from cooler expectations, but the latest outlook points to warmer conditions across parts of the Midwest and near-normal temperatures through early May. That reduces heating demand and limits the power-sector burn needed to tighten balances meaningfully.
Arsenal, a closely held natural gas explorer in the Marcellus Basin, is exploring options including a potential sale that could fetch close to $1.5 billion, according to sources https://t.co/HYCMixfzT8
At this time of year, weather does not need to be extremely warm to weigh on gas. It only needs to stay mild enough to prevent either strong late-season heating demand or early cooling demand from appearing.
That keeps the market stuck in the soft middle of the seasonal window.
Natural gas (NG-C) is trading near 2.69, hovering just above recent lows as the market continues to drift lower following the sharp rejection from the 5.69 peak earlier in the year. Price action has flattened in recent sessions, but the broader structure still reflects a persistent downtrend with weak recovery attempts.
From a technical standpoint, the bias remains bearish but stabilising in the very short term. Price is trading below the 20-day moving average (2.80), which continues to slope downward and caps upside attempts. The 5-day (2.69) and 10-day (2.67) are clustered tightly around current levels, indicating a lack of strong momentum and a market that is trying to base after an extended decline.
Key levels to watch:
Support: 2.58 → 2.50 → 2.30
Resistance: 2.70 → 2.80 → 3.00
The market is currently consolidating just above the 2.58 support zone, where selling pressure has begun to slow. A break below this level would reinforce the broader downtrend and could expose 2.50 next.
On the upside, 2.70 acts as immediate resistance. A move above this level could trigger a short-term rebound toward 2.80, but any recovery is likely to face selling pressure unless price can reclaim and hold above the 3.00 handle.
Overall, natural gas remains under pressure with signs of exhaustion rather than reversal. The near-term focus is on whether price can hold above 2.58 to form a base, or if continued weakness drives another leg lower.
What Traders Should Watch Next
The next move depends on whether lower production keeps deepening and whether the weather turns hot enough to increase power demand. The weekly storage figures will remain the most important check on whether the market is truly tightening or just pausing before another soft spell.
If inventories keep building above normal and temperatures stay mild, natural gas may stay pinned near the current lows. If output slips further and weather turns more supportive, the market can try to build above $2.80 again.
Learn more about trading Energies on VT Markets here.
Trader Questions
Why Is US Natural Gas Still Trading Near $2.70?
Natural gas remains under pressure because mild spring weather and comfortable storage levels are outweighing the support from lower production and strong LNG exports. Prices recently traded around $2.66 to $2.69 per MMBtu, keeping the market close to its recent lows.
Why Didn’t Lower Gas Production Trigger A Bigger Rally?
Output has fallen to roughly 108.2 bcfd, which is supportive, but inventories are still high enough to absorb that supply drop for now. When storage starts the injection season above normal, production weakness alone often is not enough to drive a sustained breakout.
How Strong Are LNG Exports Right Now?
Feedgas flows to the major US LNG export plants have been running around 18.9 bcfd in April, near record territory and above March’s 18.6 bcfd pace. That is helping demand, but the market has already been pricing strong LNG flows for some time.
Why Aren’t Strong LNG Flows Enough To Lift Prices More?
Because the domestic market still looks loose. Export demand is strong, but inventories remain above average and weather has not been cold or hot enough to tighten balances meaningfully. That leaves the LNG story supportive, but not dominant.
How High Are Storage Levels Right Now?
Working gas in storage stood at 1,970 Bcf for the week ending April 10, which was 126 Bcf above the same time last year and 108 Bcf above the five-year average of 1,862 Bcf.
Start trading now – Click here to create your real VT Markets account
US weekly crude oil stocks from the API fell by 4.4 million barrels for the week ending 17 April. The forecast was a fall of 1 million barrels.
The reported draw was 3.4 million barrels larger than expected. This points to a sharper drop in inventories than the market estimate.
Inventory Surprise Signals Tighter Market
The reported draw of 4.4 million barrels is much larger than the market expected, signaling a potentially tighter supply situation than we previously modeled. This is a fundamentally bullish indicator for crude oil prices heading into the end of April. We must now watch for the official EIA report to confirm this trend before committing to larger positions.
Given this unexpected tightening, we should consider establishing bullish positions through derivatives. Buying call options on June WTI futures would provide upside exposure while capping risk. This move positions us to benefit from a potential price rally driven by this inventory surprise.
This inventory data aligns with other bullish factors, including ongoing geopolitical risks that continue to add a premium to oil prices. Furthermore, recent data shows U.S. refinery utilization rates have been climbing above 90%, indicating robust processing to meet anticipated summer driving demand. This suggests the draw on crude stocks could be sustained.
The surprise draw will likely increase implied volatility in the options market, making long options more expensive. Therefore, executing a bull call spread might be a more cost-effective strategy to play a potential price increase. This approach allows us to profit from a move higher while offsetting some of the premium cost.
Risk Checks Before Scaling Exposure
We should, however, remain cautious, recalling the market dynamics in early 2025. During that period, we saw several large inventory draws that led to short-lived price spikes before macroeconomic concerns about slowing growth took precedence. A sustained rally will require confirmation from other economic indicators beyond inventory levels.
MUFG reports that geopolitical risks remain elevated, but valuation measures such as the real effective exchange rate (REER) indicate the rupiah is undervalued against the US dollar.
The bank expects the rupiah to stabilise in the near term rather than weaken sharply. It keeps its end‑Q2 forecast for USD/IDR at 17,000.
MUFG adds that USD/IDR has moved into overbought territory, which reduces the appeal of further US dollar gains at current levels. It expects rupiah performance to improve gradually in later quarters as support measures and flows strengthen.
The note says active policy intervention has reduced foreign exchange volatility and slowed the pace of USD/IDR rises. It also states that Indonesia’s sovereign CDS spreads have narrowed.
The article was produced using an artificial intelligence tool and reviewed by an editor.
We believe geopolitical risks remain high, but the Rupiah is now looking meaningfully undervalued against the US dollar based on real effective exchange rate models. With the USD/IDR pair moving into overbought territory, we feel the risk-reward of chasing further dollar upside is becoming less attractive at current levels. Our base case is for the Rupiah to stabilize in the near term rather than see a disorderly fall.
This view is supported by recent actions and data. Bank Indonesia’s surprise 25 basis point rate hike last week to 6.75% signals a strong commitment to currency stability. Furthermore, Indonesia has now recorded 47 consecutive months of trade surpluses, with the latest March 2026 figure at a healthy $3.5 billion, providing a solid fundamental backdrop for the currency.
For derivative traders, this suggests implied volatility may begin to decline as the central bank actively suppresses sharp movements. The expectation for USD/IDR to move toward 17,000 by the end of June implies strategies that benefit from range-bound trading or a gradual, modest appreciation of the Rupiah could be favorable. We have seen active policy intervention successfully slow the pace of dollar gains, and Indonesia’s sovereign CDS spreads have narrowed in response.
We saw a similar pattern in late 2025, when a spike in the currency pair was met with forceful policy measures that led to a period of calm. While global tensions could still cause short-term spikes, the combination of an undervalued currency and a proactive central bank points toward stabilization. This suggests selling USD/IDR volatility at elevated levels may be a prudent approach in the coming weeks.
Written on April 22, 2026 at 2:51 am, by josephine
Silver fell nearly 3.50% on Tuesday and broke a key support trendline after a doji on Monday. XAG/USD was at $77.02, with markets focused on uncertainty around US-Iran talks, rising tensions, and a ceasefire close to expiry.
Price moved lower after breaking the 100-day SMA at $77.79 and the support line from the March 23 lows. The drop targets the 20-day SMA at $74.72, with support levels at $74, then $70, then $64.10 (February 6), and $61.02 (March 23).
If silver moves back above $78.50, it may retest $80. Further resistance sits at $83.05 (April 1), then $85.44 (March 13), $87.43 (March 12), $89.42 (March 11), and $90.
Silver prices can be driven by geopolitical risk, recession fears, interest rates, and the US Dollar, since it is priced in dollars. Other inputs include demand, mining supply, and recycling rates.
Industrial use in electronics and solar can affect prices, as can conditions in the US, China, and India. Silver often tracks gold, and the gold/silver ratio is used to compare relative value.
We remember the technical breakdown in April 2025 when silver broke its 100-day moving average and a key trendline, which created significant downward pressure. That price action was driven by geopolitical jitters and led to a sharp drop towards the mid-$70s. Today, with silver trading around $88.50, those old resistance levels from March 2025 are once again in play as potential targets and strike prices for options.
The fundamental picture is now a tug-of-war, creating opportunities for volatility trades. On one hand, persistent industrial demand is strong, with recent Q1 2026 reports showing global solar panel installations are up 15% year-over-year, which should support prices. This suggests buying call options or call spreads to capture potential upside driven by this physical demand.
On the other hand, we face a major headwind from interest rate policy, as the March 2026 CPI data showed inflation remains stubborn at 3.1%. This is keeping the Federal Reserve on a hawkish footing, which could strengthen the dollar and cap silver’s gains. This environment makes buying protective put options against long futures positions a prudent hedge for the coming weeks.
Given these conflicting signals, implied volatility in silver options has been climbing, which could make selling premium via strategies like iron condors attractive if we expect a range-bound market. We are watching the old 2025 highs around $87.43 and $89.42 as key levels that could define the upper and lower bounds of such a range. Traders should prepare for sharp moves if silver decisively breaks above the psychological $90 barrier.
The Gold/Silver ratio also offers a clue, having tightened from over 85:1 this time last year to a current level of 75:1. This indicates silver has been gaining relative strength against gold. A derivative strategy could involve a pair trade, going long silver futures while simultaneously shorting gold futures to capitalize on a further compression of this ratio.
Written on April 22, 2026 at 2:25 am, by josephine
New Zealand’s CPI rose 0.9% quarter-on-quarter in Q1, with annual inflation unchanged at 3.1% after 0.6% q/q and 3.1% y/y in Q4 2025. Quarter-on-quarter rises included petrol (+3.5%), pharmaceuticals (+17.7%) and confectionery (+6.2%), while international air transport fell (-7.0%) and prepaid overseas accommodation declined (-4.0%).
Non-tradeable inflation increased 1.1% q/q and 3.5% y/y, compared with 0.7% q/q and 3.5% y/y in Q4 2025. Electricity rose (+12.5%) and local authority rates increased (+8.8%).
Market Reaction And Business Confidence
Market moves reported were: NZX 50 up 0.13% to 12,932, NZDUSD up 0.477% to 0.5908, and the 10-year NZ government bond yield up 2.6bp to 4.617%. The NZIER Quarterly Survey of Business Opinion showed net 1% of firms expecting improved conditions in Q1, down from 39% in Q4 2025.
The report links weaker confidence to the U.S.-Israeli war with Iran, shipping restrictions in the Strait of Hormuz, and higher fuel costs. It also states expectations for a 25bp OCR hike by the RBNZ in July.
The persistent non-tradeable inflation figures have shifted our focus towards a more hawkish Reserve Bank of New Zealand. With annual inflation stuck at 3.1%, we see the market correctly pricing in the risk of a rate hike. The jump in the NZD and bond yields confirms that a July rate increase is now the base case.
In the coming weeks, we should consider positioning for higher short-term interest rates. Data from the Overnight Index Swap market now implies over an 85% probability of a 25 basis point hike by July. Paying fixed on short-term interest rate swaps or buying payer swaptions are direct ways to express this view.
The prospect of a widening rate differential with other central banks should support the New Zealand dollar. We see value in buying NZD/USD call options to capture potential upside ahead of the RBNZ’s meeting. This strategy allows us to profit from a stronger Kiwi dollar while defining our maximum risk.
Key Risks And External Inflation Drivers
However, we must watch the sharp drop in business confidence, which signals a slowing economy. We remember looking at the aggressive RBNZ tightening cycle in 2022 and 2023, where they hiked forcefully even as growth forecasts were being revised down. This history suggests the RBNZ will prioritize fighting inflation, but the risk of a policy error is increasing.
The geopolitical tensions referenced in the business survey are not just noise; they are actively driving up costs. With Brent crude futures recently trading above $105 per barrel, these imported pressures will keep inflation elevated. This reinforces the case for the RBNZ to act, despite the weak domestic economic outlook.