Stocks Slide as Fed Meeting Minutes Suggest Potential Rate Hike Amid Inflation Concerns

Stock markets experienced declines on Wednesday as investors absorbed insights from the Federal Reserve’s July meeting, which hinted at the possibility of raising interest rates. The Dow Jones Industrial Average dropped by 0.52%, concluding at 34,765.74, while the S&P 500 decreased by 0.76% to settle at 4,404.33. The Nasdaq Composite also saw a decline of 1.15%, ending the day at 13,474.63. This marked the second consecutive session of losses for the major indices.

During the July meeting, the Federal Reserve officials discussed the potential need for further tightening of monetary policy to counter ongoing inflation. The meeting summary highlighted that most participants recognized significant upside risks to inflation due to it remaining above the Committee’s longer-term goal. The current federal funds rate lies within a range of 5.25% to 5.5%, reaching its highest point in over two decades. The markets’ reaction to the meeting minutes reflected concerns about the economic backdrop and the potential need to curtail demand in order to achieve price stability. Consequently, market sentiment was impacted, leading to declines across various sectors, with Intel and other industries experiencing notable drops.

Data by Bloomberg

On Wednesday, a broad decline was observed across all sectors of the market, with the overall market dropping by 0.76%. Some sectors managed to buck the trend, with Utilities gaining 0.46%. However, most sectors faced losses: Financials were down by 0.21%, Consumer Staples by 0.28%, Industrials by 0.55%, Materials by 0.66%, Health Care by 0.78%, Information Technology by 0.88%, Energy by 0.90%, Real Estate by 1.20%, Communication Services by 1.21%, and Consumer Discretionary by 1.27%.

Major Pair Movement

On Wednesday, the dollar index experienced a slight increase, recovering from earlier losses. This recovery was attributed to better-than-expected U.S. housing and industrial production data, as well as rebounding Treasury yields compared to euro zone yields. The release of Federal Reserve meeting minutes further supported the dollar’s performance later in the session. However, the dollar’s gains were somewhat limited by strong UK inflation data, which maintained expectations for a rate hike by the Bank of England (BoE) and boosted the pound.

Amid robust U.S. retail sales figures and ongoing uncertainties surrounding China’s economic stability, the dollar continued to attract interest from investors. The Fed meeting minutes aligned with previous indications, hinting at a potential additional rate hike, contributing to the extension of Treasury yields and the dollar’s turnaround from earlier losses.

The EUR/USD pair declined by 0.24% due in part to negative spreads between 2-year bund and Treasury yields. Sterling, while retreating from its Wednesday high, still gained 0.17% on the back of increased gilts-Treasury yields spreads, driven by strong UK core price growth, rising services inflation, and record-breaking basic earnings.

The USD/JPY pair saw a 0.47% increase, benefiting from rising Treasury-JGB yield spreads and breaching resistance levels. Risk-off sentiment stemming from China’s situation and recent rate cuts led to declines for the Chinese yuan (CNY) and the Australian dollar (AUD), with the latter hitting a 9-month low and the former nearing its 2022 record high.

Picks of the Day Analysis

EUR/USD (4 Hours)

EUR/USD Hits Lowest Level Since July Amidst Resurgent US Dollar Strength

The EUR/USD pair broke below the 1.0900 mark during the American session, marking its lowest point since early July, driven by the robust US Dollar. The US Dollar’s momentum was bolstered by higher US Treasury yields and cautious market sentiment, with the DXY testing July highs near 103.50. Despite mixed US data, the Federal Open Market Committee (FOMC) minutes revealed a cautious stance, hinting at potential rate stability. While some FOMC members expressed concerns about further tightening, the US Dollar regained strength, with the EUR/USD pair facing the prospect of extended losses amidst a backdrop of waning market sentiment and a resurgent Greenback.

Chart EURUSD by TradingView

Based on technical analysis, the EUR/USD moves lower on Wednesday, creating a push for the lower band of the Bollinger Bands. Currently, the price is moving around the lower of the Bollinger Bands. The Relative Strength Index (RSI) presently stands at 34, signifying that the EUR/USD is currently in a bearish sentiment.

Resistance: 1.0935, 1.1038

Support: 1.0865, 1.0789

XAU/USD (4 Hours)

XAU/USD Holds Above $1,900 as US Dollar Dominance Persists Amid Positive Economic Signals

Spot gold maintains a position just above the $1,900 threshold as the US Dollar retains its strength in a risk-averse climate, supported by favorable US data. July’s report showed a 0.1% month-on-month increase in Building Permits and a substantial 3.9% rise in Housing Starts, surpassing expectations. Additionally, Industrial Production climbed by 1%, while Capacity Utilization reached 79.3%. These figures, coupled with upbeat Retail Sales and the perception that the Federal Reserve is concluding its tightening phase, fuel optimism that the US economy is steering clear of a significant downturn. The imminent release of the July meeting Minutes from the Federal Open Market Committee (FOMC) prompts anticipation for insights into future monetary policy. Market consensus leans toward the Fed maintaining its stance in September and possibly throughout the year, with a potential shift toward rate cuts in 2024. The labor market’s persistent tightness remains a focal point for the data-driven central bank. Odds favoring a September hold stand at 88.5%, while the probability of a 25 basis points hike in November is at 36.2%, according to the CME FedWatch Tool, as markets seek confirmation on the trajectory beyond September. While definitive answers may be unlikely, the FOMC document offers a chance for further clarity.

Chart XAUUSD by TradingView

Based on technical analysis, the XAU/USD witnessed a slight decrease on Wednesday, the price managed to create a push for the lower band of the Bollinger Bands during this movement. Currently, the price is moving at the lower band of the Bollinger Bands. The Relative Strength Index (RSI) is currently at 28, indicating that the XAU/USD pair is exhibiting a somewhat bearish sentiment.

Resistance: $1,899, $1,912

Support: $1,892, $1,885

Economic Data

CurrencyDataTime (GMT + 8)Forecast
AUDEmployment Change09:3014.6K
AUDUnemployment Rate09:303.6%
USDUnemployment Claims20:30240K

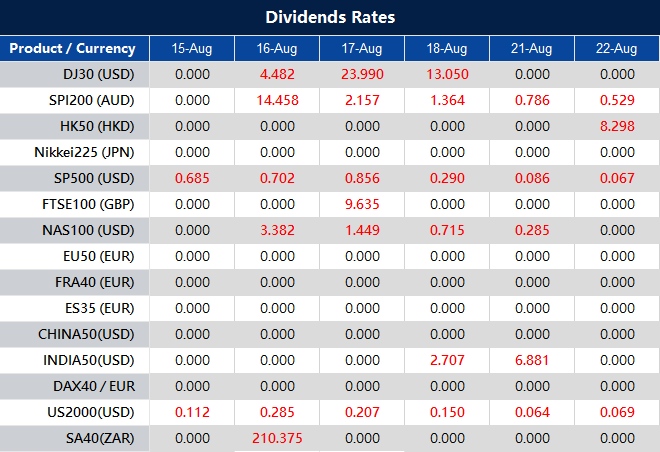
Dividend Adjustment Notice – August 16, 2023

Dear Client,

Please note that the dividends of the following products will be adjusted accordingly. Index dividends will be executed separately through a balance statement directly to your trading account, and the comment will be in the following format “Div & Product Name & Net Volume ”.

Please refer to the table below for more details:

The above data is for reference only, please refer to the MT4/MT5 software for specific data.

If you’d like more information, please don’t hesitate to contact [email protected].

Stock Market Slumps Amid Global Economic Concerns and Banking Sector Weakness

Stock markets experienced a significant decline on Tuesday, driven by mounting apprehensions about the global economy, particularly China, and a downturn in the U.S. banking sector. The Dow Jones Industrial Average dropped by 361.24 points, or 1.02%, closing at 34,946.39, ending its three-day positive streak. The S&P 500 retreated by 1.16%, closing at 4,437.86, slipping below its 50-day moving average, which could signal the initiation of a potential downtrend. The Nasdaq Composite also recorded a 1.14% fall, concluding the day at 13,631.05.

In the U.S., financial stocks saw a notable weakening. JPMorgan Chase and Wells Fargo shares both declined by 2%, while Bank of America shares dropped by 3%. This decline followed a warning from Fitch that it might downgrade the credit rating of numerous banks, including JPMorgan Chase. Just the previous week, Moody’s had already downgraded the ratings of ten U.S. banks and placed several major institutions on a watchlist for potential downgrades. Regional banks faced a similar fate, with the SPDR S&P Regional Banking ETF (KBE) experiencing a 3% decline. This decrease came after Minneapolis Federal Reserve President Neel Kashkari advocated for more stringent capital regulation.

Global investor sentiment was further impacted by discouraging economic data from China, combined with an unexpected interest rate cut by its central bank. China reported a mere 3.7% increase in industrial production in July compared to the previous year, falling short of expectations. Retail sales growth was also underwhelming, prompting the People’s Bank of China to reduce interest rates by 15 basis points to 2.5%. However, this move failed to allay concerns and instead intensified worries about China’s ailing real estate market. Market experts suggested that skepticism was growing about the effectiveness of Chinese government stimulus measures, contributing to the overall market unease.

The stock market’s turbulence coincided with a week marked by prominent earnings reports from major retailers. Home Depot exceeded analyst expectations, reporting higher earnings per share and revenue, which provided a slight boost to its stock. The week ahead also promised releases from Target and Walmart, further shaping investor sentiment. On the data front, July’s U.S. retail sales figures surprised economists, with a 0.7% month-over-month increase, surpassing the estimated 0.4% rise. These developments highlighted a robust consumer outlook amidst the broader economic uncertainties.

Data by Bloomberg

On Tuesday, the stock market witnessed widespread declines across all sectors, with a notable decrease of 1.16%. Among the sectors, Energy suffered the most significant drop, plummeting by 2.44%, while Financials and Utilities also experienced substantial declines of 1.80% and 1.69%, respectively. Consumer Discretionary and Materials sectors faced losses of 1.37% and 1.65%, highlighting a challenging day for these segments. Industrials and Real Estate both slid by 1.27% and 1.07%, respectively. Communication Services and Consumer Staples followed suit with decreases of 1.01% and 1.02%. Information Technology encountered a decline of 0.91%, while Health Care demonstrated relatively milder losses of 0.36%.

Major Pair Movement

The US Dollar Index extended its strength, marking a fourth successive daily gain and reaching a one-month peak on Tuesday. This recovery was driven by increased risk aversion and a rebound in Treasury yields. Wall Street stocks faced over a 1% decline, while US 10-year Treasury yields initially dropped but later rebounded above 4.20%. Meanwhile, the US Retail Sales surpassed expectations by rising 0.7% in July, exceeding the projected 0.2%. However, the NY Empire Manufacturing Index decreased to -19 from -1. Upcoming economic indicators include Building Permits, Housing Starts, and Industrial Production, with particular attention on the forthcoming FOMC meeting minutes.

EUR/USD initially rose to 1.0950 before retreating to 1.0900, influenced by a resurgent US Dollar. Eurozone data on GDP, Employment, and Industrial Production will be unveiled on Wednesday. In the UK, robust wage data fueled expectations of a Bank of England (BoE) rate hike, boosting the Pound. GBP/USD steadily advanced, closing above 1.2700. The UK’s upcoming Consumer Price Index (CPI) inflation report for July will be closely monitored, with an anticipated decline from 7.9% to 6.7%.

USD/JPY remained stable around 145.50, testing support near 146.00 but finding strength above 145.00. Canada witnessed a rebound in its Consumer Price Index to 3.3% in July, surpassing the expected 3%, briefly lifting the Canadian Dollar. USD/CAD sustained its upward trend, closing just below 1.3500.

Picks of the Day Analysis

EUR/USD (4 Hours)

EUR/USD Retreats from Peak as US Dollar Stays Resilient Amid Economic Reports

The EUR/USD currency pair experienced a brief peak at 1.0951 on Tuesday, only to retract to 1.0900, highlighting ongoing seller influence and erasing daily gains. The US Dollar retains its robustness following favorable economic data. Eurozone data presented a mixed picture, with the German ZEW Expectation Index surpassing predictions at -12.3, while the Current Situation Index fell to -71.3, worse than expected. Eurozone Q2 growth, employment data, and June’s industrial production are awaited. In the US, retail sales exceeded forecasts, rising 0.7% in July, despite a lower-than-expected NY Empire State Manufacturing Index for August. The Dollar initially rose post-data but later dipped before rebounding, driven by risk aversion and US yield recovery. Wednesday brings building permits, industrial production figures, and Federal Reserve meeting minutes.

Chart EURUSD by TradingView

Based on technical analysis, the EUR/USD moves flat on Tuesday, creating a flat move in the bands of the Bollinger Bands. Currently, the price is moving between the middle and the lower of the Bollinger Bands. The Relative Strength Index (RSI) presently stands at 40, signifying that the EUR/USD is currently in a consolidation phase with a slight bearish undertone.

Resistance: 1.0935, 1.1038

Support: 1.0874, 1.0789

XAU/USD (4 Hours)

XAU/USD Hits 3-Month Low at $1,896.33 Amid Risk-Averse Markets and Mixed Data

On Tuesday, the XAU/USD pair fell to its lowest point since June at $1,896.33 per troy ounce, currently hovering around $1,906. While demand for the US Dollar has eased with Wall Street’s opening, overall market sentiment remains risk-averse, benefiting the Greenback. Weaker-than-expected Chinese data earlier in the day dampened investor confidence, raising concerns of a global growth slowdown driven by the Asian economic giant.

Positive data emerged from the United States, with July’s Retail Sales exceeding expectations at a 0.7% rise, surpassing the projected 0.4%. The Retail Sales Control Group saw an even more substantial increase of 1%, doubling the previous figure. Although this positive news halted the decline in stocks, Wall Street remained in negative territory, albeit improved from pre-opening levels.

Meanwhile, government bond yields retreated from recent multi-month highs, putting downward pressure on the US Dollar throughout the latter half of the day. The decline in yields was prompted by a warning from Fitch Ratings analysts, suggesting potential downgrades for certain American banks.

Chart XAUUSD by TradingView

Based on technical analysis, the XAU/USD witnessed a slight decrease on Tuesday, the price managed to reach the lower band of the Bollinger Bands during this movement. At present, the price is retracing higher. The Relative Strength Index (RSI) is currently at 37, indicating that the XAU/USD pair is exhibiting a somewhat bearish sentiment.

Resistance: $1,912, $1,923

Support: $1,902, $1,892

Economic Data

CurrencyDataTime (GMT + 8)Forecast
NZDOfficial Cash Rate10:005.50% (Actual)
NZDRBNZ Press Conference11:000.9%
GBPCPI y/y14:006.7%

Dividend Adjustment Notice – August 15, 2023

Dear Client,

Please note that the dividends of the following products will be adjusted accordingly. Index dividends will be executed separately through a balance statement directly to your trading account, and the comment will be in the following format “Div & Product Name & Net Volume ”.

Please refer to the table below for more details:

The above data is for reference only, please refer to the MT4/MT5 software for specific data.

If you’d like more information, please don’t hesitate to contact [email protected].

US Stocks Rebound as Tech and Chip Sectors Drive Gains, Amidst Mixed Market Trends

On Monday, US stocks rebounded with the S&P 500 and Nasdaq Composite both gaining ground. The broader market index rose 0.58%, closing at 4,489.72, while the Nasdaq surged by 1.05% to end at 13,788.33. In contrast, the Dow Jones Industrial Average edged up 0.07%, finishing at 35,307.63.

Nvidia, a key chip company, saw a notable resurgence, its shares climbing 7.1% after an 8.5% slump the prior week. The boost came from Morgan Stanley reaffirming Nvidia as a top pick ahead of its earnings report. Other chip stocks followed suit, with the VanEck Semiconductor ETF (SMH) up 3%, despite a more than 6% decline in August.

These gains unfolded amid a recent struggle for stocks to maintain momentum in the latter part of 2023’s summer. While the S&P 500 and Nasdaq faced declines of 0.3% and 1.9% respectively in the previous week, the Dow bucked the trend, posting a 0.6% gain in the same period – its fourth positive week in five.

Looking ahead, the upcoming week was poised to provide insights into the US consumer’s state, with anticipated earnings reports from major companies like Home Depot, Target, and Walmart, along with the release of July’s retail sales data. These reports followed mixed inflation data from the previous week, which showed a moderated yet still elevated price increase above the Federal Reserve’s 2% target.

Data by Bloomberg

On Monday, the US stock market exhibited varied sectoral performance. The overall market saw a positive movement of 0.57%. The Information Technology sector led the gains with an impressive 1.85% increase, followed by Communication Services at +1.04%, and Consumer Discretionary at +0.39%. Health Care and Materials sectors also contributed positively, rising by 0.33% and 0.19% respectively. However, some sectors experienced slight gains or remained nearly unchanged, including Industrials (+0.03%).

On the other hand, several sectors faced declines. Financials registered a decrease of -0.18%, Energy was down by -0.33%, while Consumer Staples and Real Estate both experienced more pronounced declines at -0.52% and -0.54% respectively. The Utilities sector saw the most significant decrease, ending the day with a decline of -0.83%.

Major Pair Movement

The US Dollar Index achieved its highest daily close in over a month, surpassing 103.15, supported by rising US yields even as the Federal Reserve’s stability is expected. Retail Sales data and NY Empire Manufacturing Index awaited. The Euro faced fluctuations, briefly dipping below 1.0900 but recovering, while GBP/USD stabilized around 1.2700 after hitting 1.2616, accompanied by the upcoming UK employment and inflation reports.

USD/JPY extended gains, reaching its highest daily close near 145.50 since November. Japan’s Q2 GDP and Industrial Production data anticipated. USD/CHF hit a one-month peak before retreating, with Swiss Producer and Import Price Index due. USD/CAD maintained an upward trend above 1.3400 ahead of Canada’s CPI report. AUD/USD declined for a fifth day due to commodity drops, RBA minutes expected. NZD/USD hit a November-low close below 0.6000 ahead of the RBNZ decision. Gold and Silver slid but stabilized, Gold above $1,900 and Silver around $22.55.

Picks of the Day Analysis

EUR/USD (4 Hours)

US Dollar Strengthens as EUR/USD Faces Bearish Pressure

The EUR/USD faced downward pressure as it dropped below key moving averages, testing levels below 1.0900. While a recovery from the lows could alleviate some bearish sentiment, the overall trend remains downward, contributing to the US Dollar’s resilience across the market.

The US Dollar Index closed above 103.00, achieving its highest daily close in over a month on Tuesday, driven by rising US Treasury yields. Despite expectations of an unchanged interest rate policy by the Federal Reserve (Fed), the Greenback remains robust. US yields continue their upward trajectory, with the 10-year approaching 4.20% and the 2-year nearing 5%. Retail Sales data from the US is scheduled for release. Meanwhile, the Euro faced losses against the Swiss Franc and the Pound on Monday, partly due to Germany’s Wholesale Price Index dropping 0.2% in July, although the annual rate performed slightly below expectations. The upcoming ZEW Survey release will provide further insights into the Euro’s performance.

Chart EURUSD by TradingView

Based on technical analysis, the EUR/USD exhibited a downward movement on Monday and initiated a push towards the lower boundary of the Bollinger Bands. Nevertheless, it subsequently experienced a minor upward shift, with the potential to rise further towards the central line of the Bollinger Bands. The Relative Strength Index (RSI) presently stands at 38, signifying that the EUR/USD is currently in a consolidation phase with a slight bearish undertone.

Resistance: 1.0935, 1.1038

Support: 1.0874, 1.0789

XAU/USD (4 Hours)

XAU/USD Gold Prices Plunge Amidst Rising US Dollar Demand

Gold prices experienced a sharp decline on Monday due to increased demand for the US Dollar in a risk-averse climate. The week began with investors closely monitoring China, where real estate giant Country Garden Holdings’ warning of a $7.6 billion first-half loss triggered concerns of contagion. This led to a surge in speculative interest towards the safe-haven US Dollar.

Although worries eased briefly during European trading hours, they resurfaced before Wall Street’s opening. XAU/USD dropped to $1,902.68 per troy ounce, almost matching July’s low. However, the positive sentiment on Wall Street interrupted the US Dollar’s rally, allowing XAU/USD to recover slightly from its low. While equities posted modest gains, they curtailed the downside for the American currency.

Amidst a sparse macroeconomic calendar, the focus remains on the upcoming releases from the United States and the United Kingdom. The US is set to reveal Retail Sales data on Tuesday, while the UK will provide updates on employment and inflation in the coming days.

Chart XAUUSD by TradingView

Based on technical analysis, the XAU/USD witnessed a slight decrease on Monday, the price managed to reach the lower band of the Bollinger Bands during this movement. At present, the price is retracing higher. The Relative Strength Index (RSI) is currently at 37, indicating that the XAU/USD pair is exhibiting a somewhat bearish sentiment.

Resistance: $1,912, $1,923

Support: $1,902, $1,892

Economic Data

CurrencyDataTime (GMT + 8)Forecast
AUDMonetary Policy Meeting Minutes09:30 
AUDWage Price Index q/q09:300.9%
GBPClaimant Count Change14:0019.6K
CADCPI m/m20:300.3%
USDRetail Sales m/m20:300.4%
USDEmpire State Manufacturing Index20:30-0.9

Dividend Adjustment Notice – August 14, 2023

Dear Client,

Please note that the dividends of the following products will be adjusted accordingly. Index dividends will be executed separately through a balance statement directly to your trading account, and the comment will be in the following format “Div & Product Name & Net Volume ”.

Please refer to the table below for more details:

The above data is for reference only, please refer to the MT4/MT5 software for specific data.

If you’d like more information, please don’t hesitate to contact [email protected].

Modification on US CFD Shares – August 14, 2023

Dear Client,

To provide a favorable trading environment to our clients, VT Markets will modify the trading setting of US Shares on August 21, 2023:

The above data is for reference only, please refer to the MT4/MT5 software for specific data.

Friendly reminders:

All specifications for US shares stay the same except leverage.

As a result, the margin requirements for the trading products above will be lowered.

If you’d like more information, please don’t hesitate to contact [email protected].

Week Ahead: Markets to Focus on RBNZ Rate Statement and US Retail Sales

Important economic events will have a significant impact on the forex market this week. Keep an eye out for the Reserve Bank of New Zealand’s (RBNZ) Rate Statement and the US data for retail sales. This information could greatly influence the markets, so it’s crucial for traders to be cautious and stay on top of the latest developments for a successful week of trading.

Here are some notable highlights for the week:

Australia Wage Price Index (15 August 2023) 

The seasonally adjusted Wage Price Index in Australia showed that wages increased by 3.7% year-on-year in Q1 2023, following a year-on-year growth of 3.4% in Q4 2022. 

Data for Q2 2023 is scheduled for release on 15 August, with analysts anticipating another increase of 3.8%.

Canada Consumer Price Index (15 August 2023) 

Canada’s Consumer Price Index (CPI) increased by 0.1% in June 2023 compared to the previous month. 

Analysts anticipate a 0.2% increase in the figures for July, which are set to be released on 15 August.

US Retail Sales (15 August 2023)

Retail sales in the US rose by 0.2% month-on-month in June 2023, following a 0.5% increase in May. 

Analysts expect a 0.3% growth in the figures for July, scheduled for release on 15 August.

UK Consumer Price Index (16 August 2023) 

Consumer price inflation in the UK dropped to 7.9% in June 2023, marking the lowest level since March 2022. 

The upcoming CPI figures are expected to show a further decline to 7.4%.

Reserve Bank of New Zealand Rate Statement (16 August 2023) 

During its July meeting, the Reserve Bank of New Zealand maintained the official cash rate (OCR) at 5.5%.

Analysts predict that the RBNZ will keep the OCR unchanged at 5.5% following its upcoming meeting on 16 August.

Federal Funds Rate (17 August 2023) 

The Federal Reserve raised the target range for the federal funds rate by 25 bps to 5.25–5.5%, in line with market expectations. 

Additionally, the central bank also resumed its tightening campaign after a pause in June.

Employment in Australia (17 August 2023) 

Employment in Australia surged by 32,600 in June 2023. Meanwhile, the unemployment rate stood at 3.5%, remaining unchanged from May. It continues to hover close to the 50-year lows reached in October 2022.

Analysts anticipate that employment figures for July 2023 will show an increase of 25,100, with the data scheduled for release on 17 August.

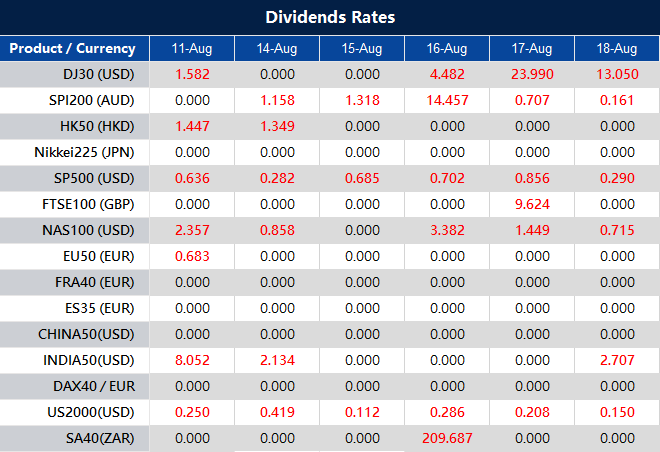
Dividend Adjustment Notice – August 11, 2023

Dear Client,

Please note that the dividends of the following products will be adjusted accordingly. Index dividends will be executed separately through a balance statement directly to your trading account, and the comment will be in the following format “Div & Product Name & Net Volume ”.

Please refer to the table below for more details:

The above data is for reference only, please refer to the MT4/MT5 software for specific data.

If you’d like more information, please don’t hesitate to contact [email protected].

Dow Edges Higher on Disney Rally and Moderate Inflation Data

The Dow Jones Industrial Average saw a modest increase on Thursday, propelled by a surge in Disney’s stock following their post-earnings announcement of a price hike for ad-free Disney+ subscriptions. The market was also buoyed by a key inflation report that revealed slightly lower year-over-year inflation growth than economists had predicted. The blue-chip index gained 52.79 points, or 0.15%, closing at 35,176.15. While all three major indexes had initially climbed more than 1% earlier in the day, the Nasdaq Composite and S&P 500 are projected to conclude the week with slight declines of 1.2% and 0.2%, respectively, while the Dow is set for a 0.3% advance.

The inflation report for July showed an annual consumer price increase of 3.2%, slightly under the 3.3% consensus projected by economists polled by Dow Jones. Despite this moderate figure, the core July CPI reading, which excludes food and energy, marked a substantial increase of 4.7% on an annual basis, well above the Federal Reserve’s targeted 2% inflation rate. Additionally, Disney’s positive earnings announcement drove a 4.9% surge in their stock, making them the top performer in the Dow. Other positive contributors included Wynn Resorts, which advanced 2.6% due to better-than-expected earnings. As earnings season continued, more than 90% of S&P 500 companies had reported their quarterly earnings, with around 80% surpassing Wall Street expectations, according to FactSet data.

Data by Bloomberg

On Thursday, the overall market saw a slight uptick of 0.03%. Among the sectors, Communication Services led the gains with a notable increase of 0.43%, followed by Consumer Discretionary at 0.28%, and Materials at 0.09%. Energy, Financials, and Information Technology all saw minor gains of 0.08% and 0.01%, respectively.

However, Health Care experienced a slight decline of -0.04%, while Consumer Staples, Industrials, Real Estate, and Utilities encountered more notable drops, with decreases of -0.20%, -0.28%, -0.31%, and -0.32% respectively.

Major Pair Movement

During the NorAm session, the dollar index initially weakened due to a near-forecast U.S. CPI reading causing a brief drop in Treasury yields, almost touching last Friday’s lows. However, the dollar swiftly rebounded, erasing its losses along with rising Treasury yields. The expected and confirmed 0.2% monthly rise in both all-items and core CPI led to an initial decline in Treasury yields and a temporary weakening of the dollar against the euro and other currencies supported by risk-on sentiment. But the dollar regained strength, propelled by hawkish comments from San Francisco Federal Reserve Bank President Mary Daly and driven by a de-risking event after Treasury yields surged post a lackluster 30-year Treasury auction. This shift favored the dollar, causing EUR/USD to lose its earlier gains, while USD/JPY bounced back from intraday lows toward 2023’s highs.

Meanwhile, sterling’s early gains turned into a 0.3% loss as risk sentiment waned, compounded by concerns about the BoE’s potential economic slowdown following its final rate hikes. EUR/JPY approached a 15-year high due to the BoJ’s unchanged policy rate and steady cap on 10-year JGB yields, which was unaffected by a post-BoJ meeting peak. Amid ongoing worries about China’s hesitant economic recovery and trade conflicts, the Australian dollar shed its earlier gains, and the Chinese yuan (CNH) fell 0.2%.

Picks of the Day Analysis

EUR/USD (4 Hours)

EUR/USD Reverses Gains Amidst US Inflation Data and Stronger Dollar

The EUR/USD initially surged above 1.1050 following US inflation data, but later retreated, erasing its daily gains as the US Dollar gained strength. The pair remained confined within a well-known range, influenced by key moving averages, while the robust US Dollar continued to limit its movement. The US inflation report for July indicated an annual Consumer Price Index (CPI) rate of 3.2%, slightly below the market consensus of 3.3%, with a monthly increase of 0.2%. Despite the rise, the report resembled pre-pandemic levels and did not signal the end of deflationary pressures. The US Dollar strengthened during the American session due to worsening market sentiment and higher US Treasury yields, with the US 10-year yield reaching 4.10%, its highest in three days. The US Dollar Index was on track for its strongest daily close in a month, surpassing 102.50. The report also highlighted an increase in Initial Jobless Claims to 248,000, above the expected 230,000. The upcoming US Producer Price Index data and Europe’s July inflation readings are expected to impact further developments. The EUR/USD’s price action hinges on USD dynamics, with potential weakening tied to improved risk sentiment and ongoing deflation in the US. However, current momentum still indicates Dollar strength.

Chart EURUSD by TradingView

Based on technical analysis, the EUR/USD created a higher spike as the US CPI data was released lower than expected and reached the upper band of the Bollinger Bands. However, it then moved lower to reach the middle band and is currently experiencing a slight upward movement above the middle band of the Bollinger Bands. The Relative Strength Index (RSI) is currently at 51, indicating that the EUR/USD is in a consolidation phase.

Resistance: 1.1038, 1.1121

Support: 1.0915, 1.0839

XAU/USD (4 Hours)

XAU/USD Prices React to US CPI Release and Dollar Fluctuations

Gold prices experienced selling pressure, hovering around $1,920 after reaching a peak of $1,930.09 post the United States Consumer Price Index (CPI) release. The XAU/USD pair initially rose as China’s eased travel restrictions lifted sentiment and speculative interest shifted away from the US Dollar ahead of the inflation update. The CPI data, in line with expectations, showed a 0.2% monthly increase in July and a 3.2% yearly rise, slightly below the anticipated 3.3%. The core annual reading, at 4.7%, was a slight decline from June’s 4.8%. These figures supported the idea of a prolonged pause in Federal Reserve monetary tightening, leading to a decline in the US Dollar against major counterparts. However, Dollar strength returned later, erasing rivals’ gains influenced by the CPI data. Optimism waned after comments by Federal Reserve Bank of San Francisco President Mary Daly, emphasizing data-dependent rate decisions and noting that the CPI data, though as expected, doesn’t signal victory on inflation.

Chart XAUUSD by TradingView

Based on technical analysis, the XAU/USD witnessed a slight decrease on Thursday following a previous upward movement triggered by the release of the US CPI data. The price managed to reach the middle band of the Bollinger Bands during this movement. At present, the price is retracing lower and is marginally positioned above the lower band of the Bollinger Bands. The Relative Strength Index (RSI) is currently at 37, indicating that the XAU/USD pair is exhibiting a somewhat bearish sentiment.

Resistance: $1,923, $1,936

Support: $1,914, $1,902

Economic Data

CurrencyDataTime (GMT + 8)Forecast
GBPGross Domestic Product m/m14:000.2%
USDProducer Price Index m/m20:300.2%
USDCore Producer Price Index m/m20:300.2%
USDPrelim UoM Consumer Sentiment22:0071.4
Back To Top
server

Hello there 👋

How can I help you?

Chat with our team instantly

Live Chat

Start a live conversation through...

  • Telegram
    hold On hold
  • Coming Soon...

Hello there 👋

How can I help you?

telegram

Scan the QR code with your smartphone to start a chat with us, or click here.

Don’t have the Telegram App or Desktop installed? Use Web Telegram instead.

QR code