Sterling rose at first against major peers after UK labour market figures for the three months to February. GBP/USD was still slightly lower near 1.3525 in European trade on Tuesday.
ONS data showed the ILO unemployment rate fell to 4.9% from an expected 5.2%. The economy added 25K jobs, down from the previous 84K.
Uk Wage Growth And Inflation Watch
Average earnings excluding bonuses increased 3.6% year-on-year versus 3.5% expected, and down from 3.8% previously. Earnings including bonuses rose 3.8% versus 3.6% expected, compared with 4.1% in the prior period after an upward revision from 3.9%.
The lower unemployment rate has been linked to market pricing for the Bank of England to keep rates unchanged at the 30 April meeting. Attention then turns to March CPI data due Wednesday, with headline inflation forecast at 3.3% year-on-year, up from 3.0% in February, alongside higher energy prices linked to the Middle East war.
Later this week, preliminary S&P Global PMI data for April is due Thursday, followed by March retail sales on Friday.
We remember this time in 2025 when a surprisingly strong labor market, with unemployment falling to 4.9%, kept the Pound Sterling buoyant. This data supported the view that the Bank of England (BoE) would keep interest rates on hold, which anchored the GBP/USD pair around the 1.35 level. The current environment presents a starkly different picture for traders to navigate.
Rate Cut Timing And Derivative Positioning
Today, the economic landscape has shifted considerably, making a repeat of last year’s bullish sentiment unlikely. Inflation has cooled significantly, with the March 2026 Consumer Price Index (CPI) now standing at 2.3%, a marked improvement from the 3.3% rate that was feared this time in 2025. While the labor market remains resilient with the unemployment rate at 4.3%, the urgency for the BoE to maintain high rates has faded.
This change in fundamentals means the key focus for derivative traders is now the timing of the first BoE interest rate cut. Since August 2023, the bank rate has been held steady at 5.25%, but markets are now actively pricing in cuts for the coming months. This contrasts sharply with April 2025, when the debate was centered on rates staying higher for longer.
For traders of currency derivatives, the weaker outlook for UK rates explains why GBP/USD is currently struggling around 1.24. We should consider strategies that benefit from this new reality, such as buying GBP put options to protect against a surprisingly dovish BoE statement. Cautious positioning is wise, as the path of least resistance for the Pound appears to be downwards.
The uncertainty surrounding when the BoE will act creates an ideal environment for volatility-based trades. Upcoming CPI and jobs data releases will be major catalysts for market movement. We see value in using options strategies like straddles ahead of these key announcements, which can profit from a significant price swing in either direction regardless of the data’s outcome.
New Zealand inflation was 3.1% year-on-year in the first quarter, slightly above the Reserve Bank of New Zealand target range. Rising energy prices are seen as a factor that could lift inflation further.
The RBNZ has said it will be cautious on monetary policy, due to the risk of further price pressures. It has also warned that waiting for clear evidence of second-round effects could come too late.
Late May Rate Decision In Focus
A key interest rate rise at the late May meeting is presented as a possibility. This is linked to how conditions in the Gulf develop.
Any rate rise could give the New Zealand dollar short-term support. Medium-term conditions are described as weaker due to growth headwinds and stagflation risks.
We see that inflation for the first quarter came in at 3.1%, which is just outside the Reserve Bank’s target band. This is an acceleration from the 2.8% we saw at the end of 2025, raising concerns about price pressures becoming embedded. The central bank has clearly signaled its discomfort with this trend, emphasizing its cautious stance.
A key driver behind this is the recent surge in energy costs, with Brent crude now holding above $95 a barrel following renewed tensions in the Strait of Hormuz last month. These higher prices are feeding directly into the inflation figures and are likely to persist for now. This makes the Reserve Bank’s job much harder as it tries to balance inflation against a slowing economy.
Trading Implications For The Kiwi
This situation puts a potential interest rate hike firmly on the table for the late May meeting, creating significant event risk and likely increasing implied volatility. Traders could consider buying short-dated NZD/USD call options to position for a potential spike if the bank does hike. This strategy offers a defined risk if the bank decides to hold rates steady instead.
However, the medium-term picture for the kiwi looks less promising due to clear growth headwinds. We saw GDP growth slow to just 0.2% in the final quarter of 2025, and recent business confidence surveys for this year have been weak. This points to a risk of stagflation, where prices rise but the economy stagnates.
For traders with a multi-month view, any strength in the New Zealand Dollar following a potential rate hike could be seen as a selling opportunity. We saw a similar pattern back in 2023, where initial gains on hawkish policy faded as weak growth data eventually took over. Buying NZD/USD put options dated for the third quarter could be a way to position for this expected longer-term weakness.
GBP/USD edged lower to about 1.3520 in Asian trading on Tuesday, after modest gains the day before. On the daily chart, it remains within an ascending channel, holding above the nine-period and 50-period EMAs, with the nine-period EMA above the 50-period EMA.
On Monday, GBP/USD rose 0.1% to around 1.3530 after retreating from last week’s peak near 1.3600. Recent sessions have ranged between 1.3500 and 1.3600, following a rebound from early April lows near 1.3160.
Geopolitical Risk In Focus
Market focus is on the US-Iran ceasefire due to expire on Wednesday night, after a two-week period. President Trump said an extension is “highly unlikely”, after the US seized an Iranian cargo ship in the Gulf of Oman and Iran’s Revolutionary Guard threatened retaliation and restated plans to close the Strait of Hormuz until the naval blockade ends.
West Texas Intermediate futures rose more than 6% to $89 a barrel overnight. GBP/USD opened the week near 1.3480 after a gap down, then recovered, trading near 1.3525, up 0.13%, as the US Dollar Index (DXY) fell about 0.05%.
We recall a similar period of hesitation back in 2025 when GBP/USD consolidated around the 1.3500 handle. At that time, escalating US-Iran tensions caused market uncertainty, yet the currency pair remained supported by its short-term moving averages. The market was reluctant to price in the geopolitical risk, a pattern we see repeating today.
Currently, with Brent crude futures trading back above $92 per barrel due to renewed friction in the Strait of Hormuz, the parallels to last year are clear. UK inflation data released last week came in at 2.8%, slightly hotter than expected, putting pressure on the Bank of England to delay any potential rate cuts. This economic backdrop is creating a floor for the pound, much like the technical support did in 2025.
Volatility And Options Positioning
As of today, April 21, 2026, GBP/USD is struggling to hold above the 1.2400 level, showing a similar consolidation pattern to the one we observed last year. While the pair remains above its 50-day moving average, bullish momentum has clearly faded in recent sessions. The key macro driver is the upcoming UK GDP release, which will guide expectations for the next Bank of England meeting.
This environment of high event risk and stagnant price action suggests an increase in implied volatility. The Cboe Volatility Index (VIX) has already crept up to 21, reflecting broader market anxiety not seen since the fourth quarter of 2025. For derivative traders, this means option premiums are becoming more expensive, rewarding well-planned strategies.
Given the uncertainty, traders could consider strategies that profit from a significant price move in either direction, such as a long straddle using at-the-money options. Alternatively, for those anticipating that the pair will remain range-bound between 1.2350 and 1.2500 in the coming weeks, selling an iron condor could be a viable approach. Protective puts can also be used to hedge downside risk on existing long positions ahead of the upcoming data releases.
The UK claimant count rate stayed at 4.4% in March. This rate measures the share of people claiming unemployment-related benefits.
No change was reported from the previous month. The figure was released as part of the UK labour market data.
Labour Market Stability
The UK claimant count remaining unchanged at 4.4% for March suggests the labour market is stable but not accelerating. This removes any immediate pressure on the Bank of England to make a surprise interest rate move in either direction. For the next week or two, we should expect implied volatility in UK assets to stay low.
However, we must remember that last week’s CPI inflation print came in slightly hotter than expected at 3.1%, which is still well above the Bank’s target. This stubborn inflation, combined with a steady jobs market, keeps the possibility of a summer rate hike firmly on the table. This underlying tension means the current market calm could be fragile.
Given this, the FTSE 100, which has been trading in a tight 200-point range for six weeks, is a candidate for premium-selling strategies. With implied volatility near yearly lows, selling short-dated covered calls against long stock positions or considering iron condors could be attractive. We are essentially betting that the index will continue its sideways drift ahead of the next major data release.
For currency traders, GBP/USD is likely to remain tethered to the 1.25-1.26 range on this news. This contrasts with the sharp moves we saw in 2025 whenever employment data surprised the market, indicating that traders are now more focused on inflation. Short-term range-trading strategies using options could prove effective until a new catalyst emerges.
The main event to watch will be the wage growth data due in early May. Governor Bailey has repeatedly stated this is a key metric, and a strong number there would likely override this steady jobs report.
Wage Growth Volatility Hedge
We should therefore consider buying some cheap, out-of-the-money options as a hedge against a potential volatility spike in a few weeks.
The UK Claimant Count Change was 26.8K in March. The forecast was 21.4K.
This means the Claimant Count Change was 5.4K higher than expected. The data point refers to the monthly change in the number of people claiming unemployment-related benefits.
Claimant Count Signals Labour Market Weakness
The recent UK claimant count figures for March, coming in higher than expected, signal a clear weakening in the labour market. We see this as a significant indicator that the economic slowdown is gathering pace. This is the third consecutive month this figure has surprised to the upside, forming a worrying trend.
This data point increases the probability that the Bank of England will consider an interest rate cut sooner than previously anticipated, perhaps as early as the third quarter. When we combine this with the latest CPI inflation figure for March, which dipped to 2.7%, the case for monetary easing builds. We should be positioning for this by looking at derivatives that profit from falling short-term interest rates, like SONIA futures.
For currency traders, this outlook suggests a bearish stance on the British Pound. The prospect of lower interest rates makes the currency less attractive to foreign investors seeking yield. We could look at buying GBP/USD put options or selling the currency in the futures market against the dollar, as the Federal Reserve appears to be on a more stable path.
This softening economic picture, confirmed by the flat GDP growth we saw in the final quarter of 2025, also spells trouble for UK equities. A weaker job market leads to lower consumer spending, which will eventually hit company profits. We should consider using FTSE 100 options to hedge our long positions or to speculate on a potential market dip in the coming weeks.
Looking back at the economic resilience of late 2025, the market had priced in a much stronger UK economy for this year. This new labour data forces a significant repricing of that expectation. The current situation is unlike the inflation-driven volatility of 2024; now, the primary driver is a genuine concern over economic growth, which could lead to more sustained market moves.
The Indian Rupee extended losses against the US Dollar on Tuesday, with USD/INR rising to near 93.50. Selling pressure followed the Reserve Bank of India withdrawing measures aimed at limiting one-way moves in the currency.
The RBI removed curbs on state-run banks offering non-deliverable forwards (NDFs) to resident and non-resident users, and ended restrictions on rebooking foreign exchange derivative contracts. The changes were reported by Reuters.
Geopolitical Talks And Market Reaction
Talks between the US and Iran were reported as set to resume either Tuesday night or Wednesday morning. The Wall Street Journal said Iran told regional mediators it would send a team to Islamabad on Tuesday, but Tehran has not confirmed this.
Washington confirmed Vice President JD Vance would travel to Islamabad to lead the US team. On Monday, Iran’s foreign ministry spokesperson Esmail Baghaei said there was “no plan for a second round of negotiations with the US for now.”
Foreign Institutional Investors sold Indian shares worth Rs. 1,059.53 crore on Monday. In the last three sessions of the previous week, FIIs bought Rs. 1,731.71 crore, averaging Rs. 577.24 crore.
Markets are watching Kevin Warsh’s confirmation hearing and US March Retail Sales at 12:30 GMT. Retail Sales are forecast to rise 1.4% month-on-month, after 0.6% in February.
USD/INR moved back above the 20-day EMA at 93.08, with RSI (14) in the 40.00–60.00 range. Levels noted were 94.00 on the upside and 92.46 on the downside.
April 2025 Positioning And Strategy
Looking back to the situation in April 2025, the Reserve Bank of India’s decision to remove curbs on forex trading was a significant signal. We saw this as the central bank stepping back, willing to tolerate more currency weakness and allowing market forces to play a larger role. For us, this meant positioning for a weaker Rupee, as the primary supporter of the currency was becoming more hands-off.
The uncertainty around the US-Iran talks at that time created significant volatility, which presented a clear opportunity in the options market. Given the binary nature of the outcome—a deal causing risk-on sentiment or a collapse causing risk-off—we should have considered buying volatility through straddles or strangles. This would have allowed us to profit from a large price swing in USD/INR, regardless of the direction the talks went.
We also noted the persistent selling by Foreign Institutional Investors, a trend that was well-established by early 2025. FIIs had pulled out over $3 billion from Indian equities in the first quarter of that year, and the selling in April confirmed this bearish sentiment. This capital outflow was a fundamental reason to maintain a long position on the US Dollar against the Rupee.
The focus on strong upcoming US data, particularly the retail sales figures for March 2025, suggested a widening economic divergence. A strong US economy, which was later confirmed when the retail sales data came in at a robust 1.6%, supported the case for a stronger dollar. This reinforced the strategy of buying USD call options or selling INR futures, anticipating further dollar strength.
From a technical standpoint, the key level for us was the 20-day EMA at 93.08. As the USD/INR pair held above this mark, it provided a clear signal to initiate or add to long positions. We should have used this level to manage risk, placing stop-loss orders just below it while targeting the psychological level of 94.00.
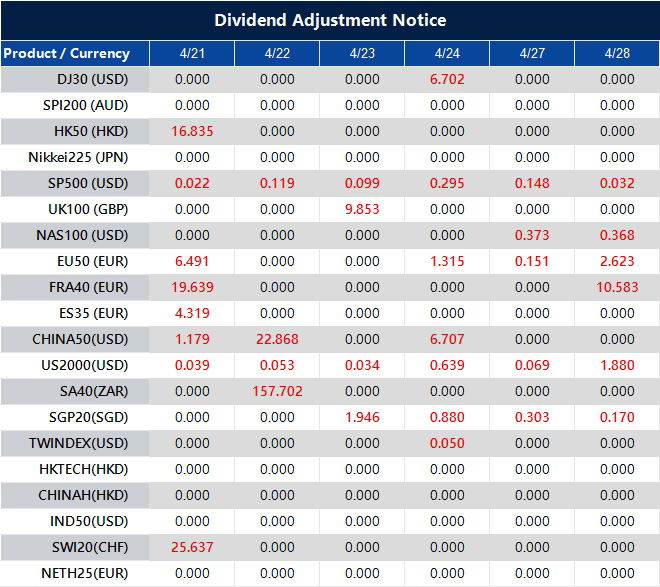
Please note that the dividends of the following products will be adjusted accordingly. Index dividends will be executed separately through a balance statement directly to your trading account, and the comment will be in the following format “Div & Product Name & Net Volume”.
Please refer to the table below for more details:
The above data is for reference only, please refer to the MT4/MT5 software for specific data.
If you’d like more information, please don’t hesitate to contact [email protected].
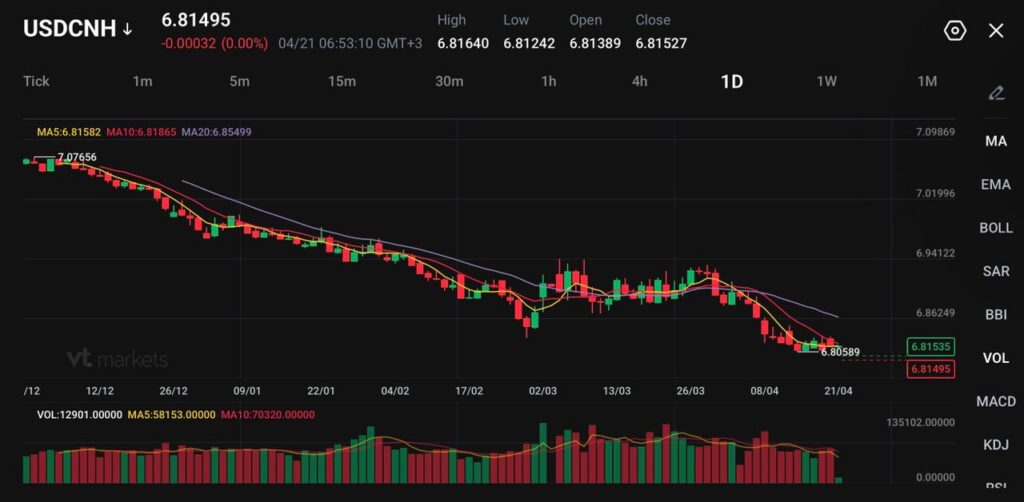
USDCNH trades at 6.81495, with price hovering close to the recent low near 6.80589.
The yuan has been one of the stronger emerging-market currencies since late February, but official fixing policy is still leaning against a faster move higher.
The next big line in the market is around 6.80, while the short-term moving averages are starting to flatten just above spot.
USDCNH is holding near 6.815, which keeps the broader yuan-strength story intact. The pair remains close to the recent floor around 6.8059, and the bigger move since late 2025 still points lower from the earlier high near 7.0766.
China is planning to issue the largest yuan sovereign bonds in Hong Kong since 2023 this month, increasing supply to global investors just as yuan assets stand out as a haven amid the Iran war https://t.co/yUUNvSkwK0
The market is still rewarding a softer dollar backdrop and the view that geopolitical stress may ease if diplomacy around Iran makes progress.
That said, the move has become more measured. The yuan is still firming, but the rally no longer looks as clean as it did earlier in the year. That slowdown fits a market where the dollar has softened, yet Beijing has become less willing to allow a sharp one-way appreciation.
PBOC Resists Yuan Strength
The clearest local driver remains the fixing. The PBOC has repeatedly set the midpoint weaker than market estimates since November, and that has been read as an effort to prevent the yuan from strengthening too quickly. That policy stance does not reverse the trend by itself, but it does slow the pace and keep traders from pressing the move too aggressively.
China keeps benchmark lending rates unchanged as economic growth revs up, Mideast risks loom https://t.co/QPtgCvNN2x
That matters because USDCNH is no longer trading only on dollar weakness or Iran headlines. It is also trading on how much appreciation Beijing is willing to tolerate. If the central bank keeps guiding the fix on the softer side of market expectations, the yuan can still rise, but the path is likely to stay gradual rather than explosive.
Iran Hopes Soften Dollar
The external backdrop is still supportive. Hopes for renewed US-Iran talks have helped cool some of the dollar’s safe-haven demand, which has in turn supported Asian currencies, including the yuan. The broader dollar tone weakened when markets started to believe diplomacy might reduce the odds of a more severe energy shock.
The United States expressed confidence that peace talks with Iran would go ahead in Pakistan and a senior Iranian official said Tehran was considering joining, but significant hurdles and uncertainty remained as the end of a ceasefire approached https://t.co/ErI17ffqGu
That support is conditional. The same reports also make clear that the geopolitical picture remains fluid and that the risk of disappointment is still alive. If talks fail again or Hormuz stress returns, the dollar could firm quickly, and USDCNH would likely bounce off the recent lows.
USDCNH Technical Outlook
USDCNH is trading near 6.8150, holding close to recent lows as the pair continues to grind lower within a broader downtrend. Price action remains subdued, with the market showing limited momentum but maintaining a clear bearish structure following the steady decline from the 7.07 highs.
From a technical standpoint, the bias remains firmly bearish. Price is trading below all key moving averages, with the 5-day (6.8158) and 10-day (6.8186) acting as immediate resistance just above current levels. The 20-day (6.8550) continues to slope downward, reinforcing the ongoing downside pressure and lack of bullish conviction.
Key levels to watch:
Support: 6.8050 → 6.7800 → 6.7500
Resistance: 6.8200 → 6.8550 → 6.9000
The pair is currently consolidating near the 6.80–6.82 support zone, where selling pressure has slowed slightly. A clean break below 6.8050 could open the door for a deeper move toward 6.7800, with further downside potential if momentum accelerates.
On the upside, 6.8200 is acting as immediate resistance. Any bounce into this area may attract sellers again, unless price can reclaim and hold above the 6.8550 region, which would be the first sign of a broader trend shift.
Overall, USDCNH remains in a controlled downtrend with shallow consolidations, suggesting continued yuan strength against the dollar. The near-term focus is on whether the 6.80 support gives way, or if the pair stabilises and forms a base for a corrective rebound.
What Traders Should Watch Next
The next move depends on whether the softer dollar backdrop lasts and whether the PBOC keeps pushing back against further yuan appreciation.
If Iran diplomacy continues to calm markets and the fixing does not turn markedly weaker, USDCNH can keep leaning toward 6.80.
If the peace story fades or Beijing becomes more active in restraining the currency, the pair may start building a rebound from the current floor.
USDCNH is staying near 6.81 because the yuan is still benefiting from a softer dollar backdrop and reduced safe-haven demand, while official policy settings are slowing any sharper move lower. The pair was recently around 6.8144 to 6.8154 in trading.
Why Has The Yuan Been Stronger Than Many Other Emerging-Market Currencies?
The yuan has been one of the better-performing emerging-market currencies since the Iran conflict began in late February, gaining more than 0.5% against the dollar over that stretch. That strength came from a softer dollar backdrop and relatively steady policy management from Beijing.
Why Is The PBOC Still Setting The Fix Weaker Than Market Estimates?
The PBOC appears to be leaning against excessive yuan strength to keep the currency more stable and avoid a rapid one-way move. Market participants have interpreted the softer-than-expected midpoint settings as an effort to manage the pace of appreciation rather than fully block it.
Does That Mean Beijing Wants A Weaker Yuan?
Not necessarily. The signal looks more like a preference for stability than a push for outright weakness. The yuan can still firm, but the central bank seems to prefer a gradual move instead of a sharp rally.
Why Do Iran Peace-Talk Hopes Matter For USDCNH?
They matter because improving diplomacy reduces some of the dollar’s safe-haven support. When investors become less defensive on geopolitics, the dollar tends to soften and Asian currencies, including the yuan, usually get some support.
What Is The Main Risk To Further Yuan Strength?
The main risks are a renewed rise in geopolitical stress, a rebound in the US dollar, or more active pushback from the PBOC through weaker fixings. Any of those could slow or reverse the recent move lower in USDCNH.
Why Is 6.80 Such An Important Level?
The 6.80 area is the next major support zone traders are watching. It sits just below the recent low near 6.8059 and has become the obvious downside reference if yuan strength continues.
Start trading now – Click here to create your real VT Markets account
WTI crude fell after modest gains, trading near $85.40 a barrel in Asian hours on Tuesday. Prices eased as near-term supply concerns reduced, amid reports that Iran will send a delegation to Islamabad for a second round of talks with the US before the truce expires.
Bloomberg reported that US President Donald Trump said Vice President JD Vance will travel to Pakistan to restart negotiations, “either Tuesday night or Wednesday morning.” Trump also said the truce is unlikely to be extended if no deal is reached this week, and that the Strait of Hormuz will remain blocked until an agreement is secured.
Strait Of Hormuz Shipping Disruptions
Shipping through the Strait of Hormuz slowed on Monday after weekend tensions, with Iran reportedly firing warning shots at vessels and the US military seizing an Iranian cargo ship. Reuters cited ship-tracking data showing one vessel exiting and two entering the Gulf over 12 hours, versus a typical daily flow of about 130 ships.
Reuters, citing Citi, said that if disruptions last another month, losses could reach about 1.3 billion barrels, with prices nearing $110 in Q2 2026. Bloomberg reported that Kuwait declared force majeure on oil shipments due to the blockade, while Societe Generale estimated demand has already fallen about 3%.
The current standoff presents a classic binary event for oil markets, creating extreme volatility. We are balanced between a potential supply shock if talks fail and a relief rally if a deal is reached. This uncertainty makes simple directional bets through futures contracts exceptionally risky.
Given this environment, we should prioritize options strategies that can capitalize on a large price swing. Implied volatility in WTI options is likely at highs not seen since the market disruptions of early 2022, making buying options expensive but reflecting the significant perceived risk. A straddle or strangle, which involves buying both a call and a put option, is a pure play on this volatility, profiting from a sharp move in either direction.
For those leaning toward an escalation, buying June 2026 call options with strike prices between $95 and $100 offers a leveraged bet on prices breaking out. However, these must be viewed as high-risk wagers, as a sudden truce would make them worthless quickly. Using call spreads can help define the risk and reduce the upfront cost of such a trade.
Market Scenarios And Hedging Approaches
The gravity of the situation is clear when we look at the numbers. The Strait of Hormuz handles roughly 20% of global oil consumption, equivalent to nearly 21 million barrels per day. A prolonged closure would remove this supply from the market, making the forecast of $110 oil a very real scenario and validating Kuwait’s force majeure declaration.
Conversely, a successful diplomatic outcome would cause the geopolitical risk premium to vanish, likely sending prices tumbling back toward the low $80s. Traders can hedge long exposure by purchasing put options, which would profit from a sudden price drop. The reported 3% fall in demand already shows that the market is beginning to buckle under the pressure of a potential supply crisis.
ZEW is due to publish Germany’s Economic Sentiment Index and Current Situation Index for April at 09:00 GMT on Tuesday. Germany’s Economic Sentiment is forecast at -5.0, down from -0.5 in March, while the Current Situation reading is seen at -70 versus -62.0.
Eurozone Economic Sentiment is expected at -3.6 in April, compared with -8.5 previously. Ahead of the release, EUR/USD is lower as the US Dollar strengthens amid cautious markets and possible US-Iran peace talks.
If the data is stronger than forecast, EUR/USD may test 1.1800, then 1.1849 (April 17 high), and 1.1926 (February 9 high). On the downside, support levels cited are 1.1728 (April 20 low), 1.1680 (100-day EMA), and 1.1588 (April 8 low).
The ZEW Economic Sentiment measure reflects a balance between optimistic and pessimistic responses. In 2022, the Euro accounted for 31% of all foreign exchange transactions, with average daily turnover of over $2.2 trillion; EUR/USD accounted for about 30%, followed by EUR/JPY 4%, EUR/GBP 3%, and EUR/AUD 2%.
The ECB holds eight meetings a year, uses interest rates to pursue price stability, and has a 2% inflation target measured by HICP. Germany, France, Italy, and Spain account for 75% of the Eurozone economy, and trade balance shifts can affect currency demand.
Looking back to April 2025, we saw expectations for the German ZEW index to be deeply negative at -5.0. Today, the situation is markedly different, with the latest reading for April 2026 showing a much more optimistic 42.9. This significant improvement in investor sentiment suggests a dramatic shift in the economic outlook over the past year.
A year ago, traders were watching the EUR/USD around the 1.17 level, but the entire landscape has changed. The pair is now trading much lower, near 1.07, reflecting different economic pressures and a stronger US dollar. This fundamentally alters the strike prices and risk profiles for any new options contracts.
The European Central Bank’s policy is also a critical factor. With Eurozone inflation now hovering around 2.4%, much closer to the ECB’s 2% target, the aggressive rate-hike narrative of the past is gone. The market is now focused on the timing of potential ECB rate cuts later this year, which could limit the Euro’s upside.
Despite the positive ZEW sentiment, we must acknowledge the weakness in hard data. The German economy contracted by 0.3% last year, and industrial production remains a concern. This divergence between soft sentiment data and hard economic output is a key risk factor for traders to monitor.
Given this environment, selling volatility on EUR/USD may be a prudent strategy for the weeks ahead. With the ECB’s dovish tilt likely capping rallies and underlying economic fragility offering support, the pair could remain range-bound. This makes strategies that profit from low volatility, such as writing short-term strangles, potentially more attractive.
Written on April 21, 2026 at 8:21 am, by josephine