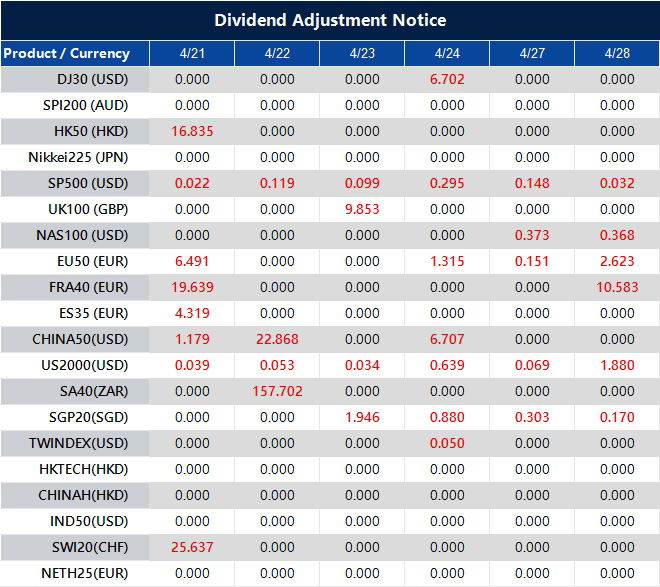
Please note that the dividends of the following products will be adjusted accordingly. Index dividends will be executed separately through a balance statement directly to your trading account, and the comment will be in the following format “Div & Product Name & Net Volume”.
Please refer to the table below for more details:
The above data is for reference only, please refer to the MT4/MT5 software for specific data.
If you’d like more information, please don’t hesitate to contact [email protected].
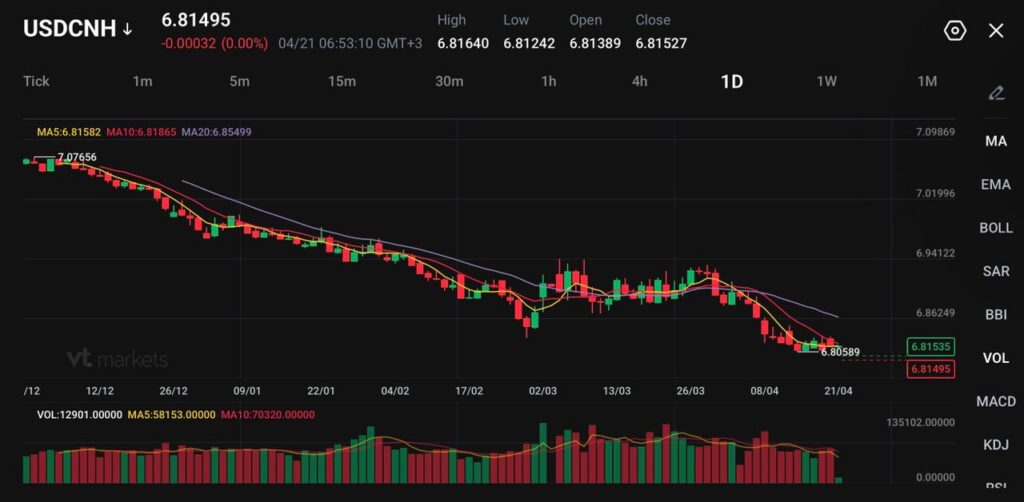
USDCNH trades at 6.81495, with price hovering close to the recent low near 6.80589.
The yuan has been one of the stronger emerging-market currencies since late February, but official fixing policy is still leaning against a faster move higher.
The next big line in the market is around 6.80, while the short-term moving averages are starting to flatten just above spot.
USDCNH is holding near 6.815, which keeps the broader yuan-strength story intact. The pair remains close to the recent floor around 6.8059, and the bigger move since late 2025 still points lower from the earlier high near 7.0766.
China is planning to issue the largest yuan sovereign bonds in Hong Kong since 2023 this month, increasing supply to global investors just as yuan assets stand out as a haven amid the Iran war https://t.co/yUUNvSkwK0
The market is still rewarding a softer dollar backdrop and the view that geopolitical stress may ease if diplomacy around Iran makes progress.
That said, the move has become more measured. The yuan is still firming, but the rally no longer looks as clean as it did earlier in the year. That slowdown fits a market where the dollar has softened, yet Beijing has become less willing to allow a sharp one-way appreciation.
PBOC Resists Yuan Strength
The clearest local driver remains the fixing. The PBOC has repeatedly set the midpoint weaker than market estimates since November, and that has been read as an effort to prevent the yuan from strengthening too quickly. That policy stance does not reverse the trend by itself, but it does slow the pace and keep traders from pressing the move too aggressively.
China keeps benchmark lending rates unchanged as economic growth revs up, Mideast risks loom https://t.co/QPtgCvNN2x
That matters because USDCNH is no longer trading only on dollar weakness or Iran headlines. It is also trading on how much appreciation Beijing is willing to tolerate. If the central bank keeps guiding the fix on the softer side of market expectations, the yuan can still rise, but the path is likely to stay gradual rather than explosive.
Iran Hopes Soften Dollar
The external backdrop is still supportive. Hopes for renewed US-Iran talks have helped cool some of the dollar’s safe-haven demand, which has in turn supported Asian currencies, including the yuan. The broader dollar tone weakened when markets started to believe diplomacy might reduce the odds of a more severe energy shock.
The United States expressed confidence that peace talks with Iran would go ahead in Pakistan and a senior Iranian official said Tehran was considering joining, but significant hurdles and uncertainty remained as the end of a ceasefire approached https://t.co/ErI17ffqGu
That support is conditional. The same reports also make clear that the geopolitical picture remains fluid and that the risk of disappointment is still alive. If talks fail again or Hormuz stress returns, the dollar could firm quickly, and USDCNH would likely bounce off the recent lows.
USDCNH Technical Outlook
USDCNH is trading near 6.8150, holding close to recent lows as the pair continues to grind lower within a broader downtrend. Price action remains subdued, with the market showing limited momentum but maintaining a clear bearish structure following the steady decline from the 7.07 highs.
From a technical standpoint, the bias remains firmly bearish. Price is trading below all key moving averages, with the 5-day (6.8158) and 10-day (6.8186) acting as immediate resistance just above current levels. The 20-day (6.8550) continues to slope downward, reinforcing the ongoing downside pressure and lack of bullish conviction.
Key levels to watch:
Support: 6.8050 → 6.7800 → 6.7500
Resistance: 6.8200 → 6.8550 → 6.9000
The pair is currently consolidating near the 6.80–6.82 support zone, where selling pressure has slowed slightly. A clean break below 6.8050 could open the door for a deeper move toward 6.7800, with further downside potential if momentum accelerates.
On the upside, 6.8200 is acting as immediate resistance. Any bounce into this area may attract sellers again, unless price can reclaim and hold above the 6.8550 region, which would be the first sign of a broader trend shift.
Overall, USDCNH remains in a controlled downtrend with shallow consolidations, suggesting continued yuan strength against the dollar. The near-term focus is on whether the 6.80 support gives way, or if the pair stabilises and forms a base for a corrective rebound.
What Traders Should Watch Next
The next move depends on whether the softer dollar backdrop lasts and whether the PBOC keeps pushing back against further yuan appreciation.
If Iran diplomacy continues to calm markets and the fixing does not turn markedly weaker, USDCNH can keep leaning toward 6.80.
If the peace story fades or Beijing becomes more active in restraining the currency, the pair may start building a rebound from the current floor.
USDCNH is staying near 6.81 because the yuan is still benefiting from a softer dollar backdrop and reduced safe-haven demand, while official policy settings are slowing any sharper move lower. The pair was recently around 6.8144 to 6.8154 in trading.
Why Has The Yuan Been Stronger Than Many Other Emerging-Market Currencies?
The yuan has been one of the better-performing emerging-market currencies since the Iran conflict began in late February, gaining more than 0.5% against the dollar over that stretch. That strength came from a softer dollar backdrop and relatively steady policy management from Beijing.
Why Is The PBOC Still Setting The Fix Weaker Than Market Estimates?
The PBOC appears to be leaning against excessive yuan strength to keep the currency more stable and avoid a rapid one-way move. Market participants have interpreted the softer-than-expected midpoint settings as an effort to manage the pace of appreciation rather than fully block it.
Does That Mean Beijing Wants A Weaker Yuan?
Not necessarily. The signal looks more like a preference for stability than a push for outright weakness. The yuan can still firm, but the central bank seems to prefer a gradual move instead of a sharp rally.
Why Do Iran Peace-Talk Hopes Matter For USDCNH?
They matter because improving diplomacy reduces some of the dollar’s safe-haven support. When investors become less defensive on geopolitics, the dollar tends to soften and Asian currencies, including the yuan, usually get some support.
What Is The Main Risk To Further Yuan Strength?
The main risks are a renewed rise in geopolitical stress, a rebound in the US dollar, or more active pushback from the PBOC through weaker fixings. Any of those could slow or reverse the recent move lower in USDCNH.
Why Is 6.80 Such An Important Level?
The 6.80 area is the next major support zone traders are watching. It sits just below the recent low near 6.8059 and has become the obvious downside reference if yuan strength continues.
Start trading now – Click here to create your real VT Markets account
WTI crude fell after modest gains, trading near $85.40 a barrel in Asian hours on Tuesday. Prices eased as near-term supply concerns reduced, amid reports that Iran will send a delegation to Islamabad for a second round of talks with the US before the truce expires.
Bloomberg reported that US President Donald Trump said Vice President JD Vance will travel to Pakistan to restart negotiations, “either Tuesday night or Wednesday morning.” Trump also said the truce is unlikely to be extended if no deal is reached this week, and that the Strait of Hormuz will remain blocked until an agreement is secured.
Strait Of Hormuz Shipping Disruptions
Shipping through the Strait of Hormuz slowed on Monday after weekend tensions, with Iran reportedly firing warning shots at vessels and the US military seizing an Iranian cargo ship. Reuters cited ship-tracking data showing one vessel exiting and two entering the Gulf over 12 hours, versus a typical daily flow of about 130 ships.
Reuters, citing Citi, said that if disruptions last another month, losses could reach about 1.3 billion barrels, with prices nearing $110 in Q2 2026. Bloomberg reported that Kuwait declared force majeure on oil shipments due to the blockade, while Societe Generale estimated demand has already fallen about 3%.
The current standoff presents a classic binary event for oil markets, creating extreme volatility. We are balanced between a potential supply shock if talks fail and a relief rally if a deal is reached. This uncertainty makes simple directional bets through futures contracts exceptionally risky.
Given this environment, we should prioritize options strategies that can capitalize on a large price swing. Implied volatility in WTI options is likely at highs not seen since the market disruptions of early 2022, making buying options expensive but reflecting the significant perceived risk. A straddle or strangle, which involves buying both a call and a put option, is a pure play on this volatility, profiting from a sharp move in either direction.
For those leaning toward an escalation, buying June 2026 call options with strike prices between $95 and $100 offers a leveraged bet on prices breaking out. However, these must be viewed as high-risk wagers, as a sudden truce would make them worthless quickly. Using call spreads can help define the risk and reduce the upfront cost of such a trade.
Market Scenarios And Hedging Approaches
The gravity of the situation is clear when we look at the numbers. The Strait of Hormuz handles roughly 20% of global oil consumption, equivalent to nearly 21 million barrels per day. A prolonged closure would remove this supply from the market, making the forecast of $110 oil a very real scenario and validating Kuwait’s force majeure declaration.
Conversely, a successful diplomatic outcome would cause the geopolitical risk premium to vanish, likely sending prices tumbling back toward the low $80s. Traders can hedge long exposure by purchasing put options, which would profit from a sudden price drop. The reported 3% fall in demand already shows that the market is beginning to buckle under the pressure of a potential supply crisis.
ZEW is due to publish Germany’s Economic Sentiment Index and Current Situation Index for April at 09:00 GMT on Tuesday. Germany’s Economic Sentiment is forecast at -5.0, down from -0.5 in March, while the Current Situation reading is seen at -70 versus -62.0.
Eurozone Economic Sentiment is expected at -3.6 in April, compared with -8.5 previously. Ahead of the release, EUR/USD is lower as the US Dollar strengthens amid cautious markets and possible US-Iran peace talks.
If the data is stronger than forecast, EUR/USD may test 1.1800, then 1.1849 (April 17 high), and 1.1926 (February 9 high). On the downside, support levels cited are 1.1728 (April 20 low), 1.1680 (100-day EMA), and 1.1588 (April 8 low).
The ZEW Economic Sentiment measure reflects a balance between optimistic and pessimistic responses. In 2022, the Euro accounted for 31% of all foreign exchange transactions, with average daily turnover of over $2.2 trillion; EUR/USD accounted for about 30%, followed by EUR/JPY 4%, EUR/GBP 3%, and EUR/AUD 2%.
The ECB holds eight meetings a year, uses interest rates to pursue price stability, and has a 2% inflation target measured by HICP. Germany, France, Italy, and Spain account for 75% of the Eurozone economy, and trade balance shifts can affect currency demand.
Looking back to April 2025, we saw expectations for the German ZEW index to be deeply negative at -5.0. Today, the situation is markedly different, with the latest reading for April 2026 showing a much more optimistic 42.9. This significant improvement in investor sentiment suggests a dramatic shift in the economic outlook over the past year.
A year ago, traders were watching the EUR/USD around the 1.17 level, but the entire landscape has changed. The pair is now trading much lower, near 1.07, reflecting different economic pressures and a stronger US dollar. This fundamentally alters the strike prices and risk profiles for any new options contracts.
The European Central Bank’s policy is also a critical factor. With Eurozone inflation now hovering around 2.4%, much closer to the ECB’s 2% target, the aggressive rate-hike narrative of the past is gone. The market is now focused on the timing of potential ECB rate cuts later this year, which could limit the Euro’s upside.
Despite the positive ZEW sentiment, we must acknowledge the weakness in hard data. The German economy contracted by 0.3% last year, and industrial production remains a concern. This divergence between soft sentiment data and hard economic output is a key risk factor for traders to monitor.
Given this environment, selling volatility on EUR/USD may be a prudent strategy for the weeks ahead. With the ECB’s dovish tilt likely capping rallies and underlying economic fragility offering support, the pair could remain range-bound. This makes strategies that profit from low volatility, such as writing short-term strangles, potentially more attractive.
Written on April 21, 2026 at 8:21 am, by josephine
AUD/JPY slipped to about 113.95 in early European trading on Tuesday. The Japanese Yen strengthened against the Australian Dollar as markets became more cautious ahead of possible US-Iran peace talks.
Bloomberg reported that US Vice President JD Vance will travel to Pakistan later on Monday to resume negotiations, either Tuesday night or Wednesday morning. He is expected to be joined by Jared Kushner and special envoy Steve Witkoff.
Negotiations And Market Caution
Talks remained uncertain after US President Donald Trump said on Tuesday that he is not likely to extend the two-week ceasefire with Iran. This increased the pressure on negotiators to reach an agreement to end the war.
Markets are watching Middle East events and any progress in US-Iran negotiations. A longer conflict could support the Yen as a safe-haven currency and weigh on AUD/JPY.
On the daily chart, price remains above the 20-day Bollinger simple moving average and the 100-day exponential moving average (EMA). The Relative Strength Index (14) is 67.56, just below overbought levels, while the upper Bollinger band caps the upside.
Support is seen near the Bollinger middle band at about 111.75, then around the 100-day EMA at 108.51 and the lower Bollinger band at 108.41. Resistance is near the upper band at 115.10.
Key Levels And Technical Focus
Looking back at the situation in 2025, we saw the AUD/JPY cross facing uncertainty from potential US-Iran peace talks. The Japanese Yen was poised to strengthen on any signs of prolonged conflict. The key technical levels we were watching were the 108.51 EMA for support and the 115.10 level for a bullish breakout.
Those talks ultimately led to a fragile de-escalation, which temporarily reduced the Yen’s safe-haven appeal and caused carry traders to pile back in. This propelled the pair well through the 115.10 resistance level, eventually topping out near 118.50 late last year. The bullish sentiment we saw forming in 2025 did indeed play out for several months.
Today, the main driver has shifted from that specific geopolitical risk to the vast interest rate gap between the two nations. The Reserve Bank of Australia has kept rates firm at 4.5% to combat inflation, which is still running at 3.8%. This contrasts sharply with the Bank of Japan, which only recently moved its policy rate to a mere 0.1% in January.
This wide interest rate differential of over 400 basis points makes holding long AUD/JPY positions attractive for the positive carry. Traders should consider using options, like buying calls or selling puts, to capitalize on this while managing downside risk if geopolitical tensions resurface. The stability of iron ore prices around $110 per tonne provides a fundamental support for the Aussie dollar.
Gold prices in India fell on Tuesday, based on data compiled by FXStreet. Gold was priced at INR 14,428.73 per gram, down from INR 14,513.10 on Monday.
The price per tola slipped to INR 168,293.80 from INR 169,277.90 a day earlier. Other listed rates were INR 144,287.30 for 10 grams and INR 448,784.40 per troy ounce.
How FXStreet Calculates Local Gold Prices
FXStreet converts international gold prices into Indian rupees using USD/INR and local units. The figures are updated daily at the time of publication and are for reference, as local prices may differ slightly.
Gold is often used as a store of value and a medium of exchange, and is also used in jewellery. It is also used as a hedge against inflation and currency depreciation.
Central banks are the largest holders of gold and may buy it to diversify reserves. World Gold Council data says central banks added 1,136 tonnes worth about $70 billion in 2022, the highest annual purchase on record.
Gold often moves inversely to the US Dollar and US Treasuries, and can also move opposite to risk assets. Its price can be affected by geopolitical risks, recession fears, interest rates, and the US Dollar because gold is priced in dollars (XAU/USD).
Key Market Drivers To Watch
With inflation proving difficult to tame, gold remains a critical asset for hedging. We saw this throughout 2025, as core inflation remained stubbornly above the 3% level in both the US and Europe. This persistent price pressure continues to support the case for holding gold as a store of value.
Central bank buying provides a strong underlying bid for the market. Looking back, we saw central banks add over 1,000 tonnes to their reserves in both 2022 and 2023, a trend that continued through 2025. This consistent demand from official sources creates a solid floor under the price, limiting downside risk for traders.
The primary focus for the coming weeks will be on future interest rate policy. After holding rates steady for most of 2025, the market is now pricing in potential rate cuts by the US Federal Reserve in the third quarter of this year, 2026. As a non-yielding asset, gold becomes more attractive as interest rates are expected to fall.
This anticipation of lower rates is already putting pressure on the US Dollar. As gold is priced in dollars, a weaker dollar typically pushes the metal’s price higher. This inverse relationship will be a key driver of gold’s performance moving forward.
For derivative traders, this environment suggests preparing for upward volatility. Buying call options could be a prudent strategy to gain exposure to potential price spikes caused by a confirmed shift in central bank policy. This allows for participation in the upside while defining the maximum risk on the trade.
We must also watch for any instability in the broader financial markets. A significant sell-off in equities, driven by recession fears or geopolitical events, would likely trigger a flight to safety. Gold’s status as a safe-haven asset means it would benefit directly from such a move.
AUD/USD failed to build on Monday’s rebound from 0.7115, a three-day low, and edged lower in Tuesday’s Asian session. It traded near 0.7165, down 0.15%, and remained close to last Friday’s highest level since June 2022.
Market direction stayed linked to the US-Iran dispute, including tensions around the Strait of Hormuz ahead of a second round of peace talks in Pakistan. This cautious mood supported the US Dollar, while higher crude oil prices added inflation concerns that also backed the Dollar and weighed on AUD/USD.
Fed And Rba Policy Divergence
Further US Dollar gains were limited as markets reduced expectations of a US Federal Reserve rate hike. Pricing pointed to a roughly 45-50% chance of a Fed rate cut by year-end, compared with a more restrictive policy stance from the Reserve Bank of Australia.
RBA Deputy Governor Andrew Hauser said last week the bank remains focused on stopping medium-term inflation expectations from rising. Markets priced a 65% chance of a 25 basis point rise in May and projected a potential peak rate of 4.85% by mid-2026.
We are seeing the AUD/USD hover near its highest point since June 2022, around the 0.7165 level. While there is some selling pressure, any significant drops seem to find support, as they did recently at 0.7115. This suggests an underlying strength in the pair, even with day-to-day hesitation.
The core support for the Aussie dollar comes from the RBA’s firm stance against inflation, which we saw last year in 2025 persistently above their target. With Australia’s latest Q1 CPI data showing inflation at a stubborn 3.6%, the market is now pricing in a 65% chance of a rate hike next month to 4.60%. This contrasts sharply with the US, where Core PCE has cooled to 2.8%, making a Fed rate cut by year-end a real possibility.
Geopolitical Risk And Oil Driven Volatility
However, ongoing tensions in the Strait of Hormuz and their effect on crude oil are keeping a lid on the pair. WTI crude prices are elevated, currently trading around $85 a barrel, reviving inflation fears globally and supporting the safe-haven US dollar. We saw a similar dynamic with energy prices back in 2022, where geopolitical events caused sharp, unpredictable market swings.
Given this tug-of-war, we should consider strategies that benefit from a gradual rise while managing risk from high volatility. A bull call spread could be effective, allowing us to profit from a move higher but with a defined cost and risk profile. This approach helps offset the expensive option premiums caused by the current geopolitical uncertainty.
Gold prices in Malaysia fell on Tuesday, based on FXStreet data. Gold was priced at MYR 609.83 per gram, down from MYR 613.46 on Monday.
Gold also dropped to MYR 7,112.83 per tola from MYR 7,155.31 a day earlier. FXStreet listed MYR 6,098.15 for 10 grams and MYR 18,967.92 per troy ounce.
How FXStreet Calculates Malaysia Gold Prices
FXStreet calculates Malaysia’s gold prices by converting international prices using the USD/MYR rate and local units. Prices are updated daily at publication time and are for reference, as local rates may differ slightly.
Gold has been used as a store of value and a medium of exchange, and is widely used in jewellery. It is also used as a safe-haven asset and as a hedge against inflation and currency depreciation.
Central banks hold the most gold and added 1,136 tonnes worth around $70 billion in 2022, according to the World Gold Council. This was the highest annual purchase since records began, with China, India and Turkey increasing reserves.
Gold often moves inversely to the US Dollar, US Treasuries, and some risk assets. Prices can also react to geopolitical events, recession fears, interest rates, and the US Dollar because gold is priced in dollars (XAU/USD).
Key Market Forces Shaping Gold Prices
While we see a minor dip in the gold price today, April 21, 2026, it is essential to consider the larger context. Looking back, we saw gold prices surge to record highs above $2,400 per ounce in 2024, demonstrating remarkable strength even when interest rates were elevated. This resilience suggests a fundamental shift in the market that derivative traders must now navigate.
A primary driver has been the relentless purchasing by central banks, a trend that accelerated through 2024 and 2025. We saw central banks, particularly those in emerging markets, add over 1,000 tonnes to their reserves again in 2024, continuing the record pace from the previous two years. This persistent demand provides a strong floor for prices and signals a long-term strategic move away from traditional reserve assets.
The key variable for the coming weeks will be the outlook on US interest rates and the dollar. After holding rates firm through most of 2025 to fight lingering inflation, recent economic data, such as the Q1 2026 jobs report showing a slight uptick in unemployment to 4.1%, is fueling speculation of a policy shift. Any confirmation of future rate cuts would likely weaken the dollar and serve as a significant catalyst for gold, making call options or long futures positions attractive.
Geopolitical tensions, which we saw simmer throughout 2025 with ongoing conflicts in Eastern Europe and the Middle East, continue to underpin gold’s safe-haven appeal. This creates an environment where implied volatility may rise, presenting opportunities for traders using options. For those anticipating instability, buying straddles or strangles could be a viable strategy to profit from a large price move in either direction, irrespective of the Fed’s immediate actions.
The People’s Bank of China (PBOC) set the USD/CNY central rate for Tuesday at 6.8594. This compared with the previous day’s fix of 6.8648 and a Reuters estimate of 6.8112.
The PBOC’s main monetary policy aims are price stability, including exchange rate stability, and supporting economic growth. It also works on financial reforms, such as opening and developing the financial market.
Governance And Independence
The PBOC is state-owned by the People’s Republic of China and is not an autonomous body. The Chinese Communist Party Committee Secretary, nominated by the Chairman of the State Council, has key influence over the bank’s management and direction, and Pan Gongsheng holds both this role and the governor post.
Policy tools include the seven-day Reverse Repo Rate, the Medium-term Lending Facility, foreign exchange interventions and the Reserve Requirement Ratio. The Loan Prime Rate is China’s benchmark rate and changes can affect loan, mortgage and savings rates, as well as the Renminbi exchange rate.
China has 19 private banks, a small share of the system. The largest include WeBank and MYbank, and private capitalised domestic lenders have been allowed since 2014.
Given today’s stronger-than-expected fixing by the People’s Bank of China, we see a clear signal of their discomfort with recent yuan weakness. The central bank is actively pushing back against market estimates, suggesting an intent to enforce currency stability in the short term. This action follows a period where the yuan has depreciated over 1.5% against the dollar in the last quarter alone.
Implications For Markets And Trading
This move comes amid conflicting economic data, which we believe is forcing the PBOC’s hand. While China’s Q1 2026 GDP growth came in slightly below target at 4.8%, recent export figures for March showed a surprising 6% year-over-year increase, largely aided by the weaker currency. Today’s fixing indicates that managing capital outflow risks and maintaining stability is taking precedence over using a weaker exchange rate to further boost exports.
For derivative traders, this suggests that implied volatility in USD/CNH options is likely overpriced and should decline in the coming weeks. We should consider strategies that profit from a decrease in volatility, such as selling short-dated strangles, as the central bank has now signaled its intention to keep the currency within a tighter range. The probability of the yuan rapidly weakening past the 6.90 level has been significantly reduced by this official intervention.
Looking back, this action contrasts with the policy stance we observed through much of 2025. We recall several cuts to the Reserve Requirement Ratio (RRR) last year, which were implemented to stimulate a sluggish domestic economy. Those easing measures contributed to the yuan’s gradual slide, a trend the PBOC now appears determined to pause.
A more stable yuan typically provides a calming effect across regional emerging markets. We should anticipate reduced pressure on other Asian currencies that often move in tandem with the yuan. This could present opportunities in derivatives on regional stock indices, such as the Hang Seng, which often react positively to signs of stability from mainland China.
USD/JPY moved up in Asian trading on Tuesday and reached 159.00 after mixed moves the day before. The pair stayed within the same range seen over the past month, which kept near-term direction unclear.
The yen weakened as concerns grew that Japan’s economy could face pressure if energy supplies are disrupted, linked to shipping problems through the Strait of Hormuz. At the same time, expectations of tighter Bank of Japan policy and worries about possible market action by authorities limited further yen losses.
BoJ Policy And Intervention Risk
Reuters reported that the Bank of Japan is expected to keep rates unchanged in April due to Middle East uncertainty, but may signal it could raise rates as soon as June because higher imported energy costs may affect inflation. Japanese officials also said they will not accept excessive volatility and are ready to take “bold” action, keeping the risk of intervention in focus.
The US dollar traded near a nearly two-month low reached last Friday as markets reduced expectations of a US Federal Reserve rate rise. Differences between Bank of Japan and Federal Reserve policy outlooks continued to limit the pair, and further gains would need stronger buying.
We remember looking at this situation in 2025, when the pair was stuck around the 159 level amid uncertainty. The fears of intervention were realized later that year when authorities sold dollars heavily in the third quarter, spending a record ¥10 trillion as the rate approached 160. That action, combined with the policy shifts that followed, has since pushed the pair significantly lower.
The divergent policy expectations mentioned back then fully played out over the last year. The Bank of Japan followed through with two small rate hikes, bringing its policy rate to 0.25%, while the Federal Reserve has cut its benchmark rate three times to the current 4.50%. This interest rate differential compression is the main reason we are now trading near 145.50, a far cry from the highs of 2025.
Options Strategy For a Rangebound Market
For the coming weeks, selling volatility appears to be the most sensible strategy for derivative traders. With the major policy shifts now in the past and the pair settling into a new equilibrium, implied volatility in USD/JPY options has fallen to its lowest level in 18 months. We see an opportunity in constructing short strangles or iron condors centered around the 145 strike price to collect premium from this stable environment.
However, we should stay alert to new inflation data that could disrupt this calm. The most recent US CPI reading for March 2026 came in slightly above forecasts at 3.1%, causing some to question whether the Fed will continue its easing cycle. Traders should consider using some of the premium earned from selling options to buy cheap, far out-of-the-money call options as a hedge against any unexpected return of dollar strength.