India’s HSBC Manufacturing Purchasing Managers’ Index (PMI) fell to 53.8 in March. It had been 56.9 in the previous reading.
A PMI figure above 50 indicates expansion in manufacturing activity. The March result therefore still shows growth, but at a slower pace than before.
Manufacturing Growth Losing Steam
The drop in India’s manufacturing PMI to 53.8, while still in expansion territory, signals a significant loss of momentum from the previous month’s 56.9. This deceleration suggests that the rapid growth seen earlier in the year is now cooling, which could lead to downward revisions in corporate earnings estimates. We expect this to introduce a more cautious or bearish sentiment into the equity markets.
Considering this slowdown, traders may anticipate a pullback in equity indices like the NIFTY 50. This view is supported by recent government data showing that the Index of Industrial Production (IIP) for January 2026 also underperformed, growing by only 3.8%. A prudent strategy would be to buy put options on the NIFTY to hedge against or speculate on a potential market correction in the next few weeks.
This weaker economic data could also exert pressure on the Indian Rupee. We have already seen foreign portfolio investors turn net sellers in the first half of March 2026, pulling out approximately $500 million from Indian equities, which weakens the currency. Traders should consider buying USD/INR call options to position for a potential depreciation of the Rupee.
Looking back at a similar PMI drop in the second quarter of 2025, the market saw a rise in volatility, with the India VIX index jumping nearly 15% over the following month. This historical pattern suggests that even if the market’s direction isn’t clear, an increase in price swings is probable. This makes option strategies that profit from rising volatility, such as long straddles, more attractive.
The Reserve Bank of India will certainly take note of this slowdown ahead of its next policy meeting. While February’s consumer inflation rate of 5.1% prevents any immediate consideration of rate cuts, this report could prompt the RBI to soften its hawkish stance. Any signal of a prolonged pause in rate hikes could influence interest-rate-sensitive derivatives and banking sector stocks.
Gold prices in the Philippines fell on Tuesday, based on FXStreet-compiled data. Gold was priced at PHP 8,371.24 per gram, down from PHP 8,510.53 on Monday.
Gold fell to PHP 97,640.81 per tola from PHP 99,265.18 a day earlier. Other listed prices were PHP 83,712.37 for 10 grams and PHP 260,374.20 per troy ounce.
How Local Gold Prices Are Calculated
FXStreet converts international gold prices into PHP using the USD/PHP exchange rate and local measurement units. Prices are updated daily using market rates at the time of publication, and local rates may differ slightly.
Central banks are the largest holders of gold, and they added 1,136 tonnes worth around $70 billion to reserves in 2022, according to the World Gold Council. These purchases were the highest yearly total since records began, with China, India and Turkey among the emerging economies increasing reserves.
Gold often moves inversely to the US Dollar and US Treasuries, and can also move opposite to risk assets. Price changes can be affected by geopolitical events, recession fears, interest rates, and US Dollar strength, as gold is priced in dollars (XAU/USD).
We are seeing gold prices take a slight step back today, March 24, 2026, which appears linked to a resilient US Dollar. This dip follows a period of strength, presenting a moment of hesitation in the market. For traders, this small drop is less a signal of a major downturn and more a reflection of the metal’s inverse relationship with the dollar.
Trading Implications And Near Term Outlook
Underlying support for gold remains exceptionally strong, which should caution against taking aggressive short positions. Looking back, we saw central banks continue their historic buying spree throughout 2025, absorbing over 1,037 tonnes globally, nearly matching the record set a few years prior. This consistent demand from official sources creates a solid price floor that is difficult to breach.
The main headwind for gold continues to be uncertainty around central bank interest rate policy, particularly from the US Federal Reserve. After a series of cuts in 2025, the Fed has signaled a pause, leaving future policy data-dependent. As a non-yielding asset, gold struggles when interest rates are perceived to be staying higher for longer.
This environment of strong underlying support clashing with interest rate pressure creates ideal conditions for volatility trading. We believe strategies using options to benefit from price swings, rather than a specific direction, could be most effective in the coming weeks. For instance, buying call options can serve as a cheap hedge against any sudden geopolitical flare-ups, while put options could be used to trade around key central bank announcements.
Create your live VT Markets account and start trading now.
Start trading now – Click here to create your real VT Markets account
WTI rebounded after falling over 9% the previous day and traded near $91.00 per barrel during Asian hours on Tuesday. Prices rose on supply fears linked to the Iran conflict and the risk of attacks on Middle East energy infrastructure.
Reports said Saudi Arabia has signalled a possible move towards more direct military action, as US-aligned Gulf states edge closer to involvement. The situation worsened after Israel and the United States carried out a new wave of strikes on Iran.
Escalation Risks In The Gulf
Israel confirmed a second round of strikes aimed at infrastructure in Tehran. Iran increased attacks on Gulf neighbours and warned it would target regional power plants if its own facilities face further attacks.
Oil fell on Monday after US President Donald Trump delayed planned strikes on Iranian energy sites by five days, citing discussions with Tehran. Iranian officials rejected this, with Foreign Minister Abbas Araghchi denying engagement and Parliament Speaker Mohammad Bagher Ghalibaf saying no talks occurred.
Disruption to the Strait of Hormuz has raised concerns, as about 20% of global oil supply usually passes through it. Some transit has resumed under strict Iranian control, and Kpler reported several LPG vessels crossed the strait and are heading to India.
We are now facing extreme volatility in the oil markets, with the WTI price swinging over 9% in a single day before settling near $91. This environment is driven entirely by geopolitical headlines, not traditional supply and demand fundamentals. For the coming weeks, every news alert from the Middle East will be a potential trading signal.
The critical factor remains the Strait of Hormuz, through which about 21% of global petroleum liquids consumption passes. While some vessels are transiting, the situation mirrors the high-risk environment of the 1980s Tanker War, where even rumors of attacks caused dramatic price spikes. We must assume that any direct military engagement by Saudi Arabia will lead to a full, albeit temporary, closure of this chokepoint.
Options Strategies For Elevated Volatility
Given this uncertainty, implied volatility on crude options has surged, making outright long calls or puts very expensive. We are therefore looking at strategies that can manage this cost, such as debit or credit spreads, to bet on price direction. The high volatility itself can be traded through structures like long straddles or strangles if we expect an even larger price move in either direction.
A move toward $100 a barrel is now a distinct possibility if the conflict broadens, making call options with strike prices in the $95-$100 range attractive. However, we also recognize the potential for a sudden reversal on any news of de-escalation, similar to the drop we saw yesterday. Consequently, holding some protective put options is a prudent hedge against a sharp decline back into the low $80s.
We must remember the brief Saudi production outage in mid-2025, which caused an $8 spike from a much smaller disruption. The latest data we have from the Energy Information Administration shows that global strategic reserves are at a two-decade low, meaning governments have less capacity to cushion the market from a major supply shock. This lack of a safety net amplifies the upward price risk on any further escalation.
Create your live VT Markets account and start trading now.
Start trading now – Click here to create your real VT Markets account
USD/JPY rebounded after a pullback of about 165 pips from near its highest level since July 2024, rising to around 158.75–158.80 in Tuesday’s Asian session. The move followed renewed buying after the prior day’s decline.
The Japanese yen weakened after inflation data showed the National Consumer Price Index fell below the Bank of Japan’s 2% target. It was also the lowest reading since March 2022, which reduced expectations of an immediate rate rise as higher energy prices risk weighing on growth.
Middle East Tensions Lift Dollar Support
Middle East tensions continued to support inflation concerns and reduced expectations for further US Federal Reserve rate cuts. US Treasury yields rose, boosting the US dollar and supporting USD/JPY amid worries about escalation involving Iran.
On the 4-hour chart, USD/JPY held above the 100-period exponential moving average (EMA), near 158.20. The MACD slipped slightly below its signal line around zero with a flat histogram, suggesting weaker upside pace, while the RSI near 48 stayed close to the midline.
Support is seen at 158.20 and then 157.65, with a break below 157.65 pointing towards the mid-157.00s. Resistance is at 159.30, then 159.80 and the 160.00 level.
Looking back at late 2025, we saw the USD/JPY pair finding buyers near the 158.00 level, driven by weak Japanese inflation and geopolitical fears supporting the US Dollar. That period’s soft Japanese CPI data pushed back any hope for an immediate Bank of Japan rate hike. This created a clear opportunity for those betting on a stronger dollar.
Policy Outlook Shifts In Early 2026
The situation has since evolved as we stand here in March 2026. Japan’s latest national CPI for February came in at 2.1%, finally edging above the Bank of Japan’s target and fueling speculation that intervention or a policy shift is becoming more likely. We believe the central bank’s patience is now being tested more than at any point last year.
Meanwhile, the US Federal Reserve continues to hold its ground, though inflation has cooled to 3.0% as of last month’s reading. US 10-year Treasury yields are hovering around 4.1%, which is still attractive but down from the highs of 2025, suggesting the market is beginning to price in eventual rate cuts later this year. The acute fears surrounding the Iran conflict have also lessened, reducing the dollar’s safe-haven appeal compared to a few months ago.
Given the current USD/JPY price of around 162.50, the easy gains from buying the pair may be behind us. We recommend traders use options to define their risk, as the chance of a sudden, sharp reversal has increased. Buying call options with strikes around 164.00 allows for participation in further upside while capping the maximum loss to the premium paid.
A more cautious approach would be to implement bull call spreads for the coming weeks. For example, buying a 163.00 strike call and simultaneously selling a 165.00 strike call can significantly reduce the cost of the trade. This strategy profits from a moderate rise in USD/JPY but protects against the increasing risk of yen strength.
The primary risk to this outlook is a surprise hawkish pivot from the Bank of Japan, which could send the pair sharply lower toward the 160.00 psychological level. Therefore, any long positions, even through derivatives, should be managed with vigilance. We see the 160.50 area as the new key support level to watch.
Create your live VT Markets account and start trading now.
Start trading now – Click here to create your real VT Markets account
EUR/JPY slips to about 183.85 in early European trading on Tuesday, moving below 184.00 as the Yen strengthens amid Middle East conflict. Reports said the Israeli military launched a new wave of strikes on Tehran, while US President Donald Trump indicated a pause in US attacks on energy infrastructure after talks with Iran.
Cooler-than-expected Japanese inflation reduces near-term pressure on the Bank of Japan to raise interest rates. This may limit further Yen gains and support the cross.
Technical Picture And Key Levels
On the daily chart, EUR/JPY remains above the 100-day exponential moving average at about 181.70, keeping a mildly bullish bias. Price is near the Bollinger middle band at 183.53, pointing to consolidation, while the RSI at 52.71 is just above neutral.
Support is seen at 183.50, then 182.00, with a deeper floor near 181.70. Resistance sits near 184.70, with the upper Bollinger Band around 185.80.
With EUR/JPY softening due to Middle East tensions, we must consider the increased demand for the Yen as a safe haven. This geopolitical risk means we should anticipate higher volatility in the coming weeks. The current dip to around 183.85 is a direct result of capital flowing towards safety.
However, we should not ignore the underlying monetary policy divergence that has supported this pair for years. Looking back, the Bank of Japan’s historic decision in March 2024 to end negative interest rates was a major shift, yet subsequent rate hikes have been cautious due to inconsistent inflation data. This contrasts with the European Central Bank, which began its own rate-cutting cycle in mid-2024, creating a fundamental tailwind for the cross.
For derivative traders, the immediate takeaway is the likely rise in implied volatility from the subdued levels we saw in late 2025. The CBOE Volatility Index (VIX) has already ticked up over 15 this month, reflecting broader market anxiety which will spill over into currency options pricing. This makes buying options more expensive, but also potentially more necessary as a hedging tool.
Options Hedging Approach
A prudent strategy would be to purchase put options to protect against a sharp decline if the conflict escalates. We could target strikes below the key 100-day EMA support level around 181.70. This acts as an insurance policy on any long positions we hold, safeguarding against a sudden break in market structure.
At the same time, the cooler Japanese inflation data suggests the uptrend could resume if geopolitical fears recede. We can use this technical setup by selling out-of-the-money calls, perhaps with a strike price above the 185.80 resistance level. Using the premium from selling these calls can help finance the purchase of the protective puts, creating a collar that brackets our exposure.
Create your live VT Markets account and start trading now.
Start trading now – Click here to create your real VT Markets account
USD/CHF recovered from the prior day’s losses and traded near 0.7880 in the Asian session on Tuesday, rebounding towards 0.7900. The move came as the US Dollar found support from safe-haven demand amid rising geopolitical tensions.
A Wall Street Journal report said US-aligned Gulf states are moving towards direct involvement in the Iran conflict as attacks on energy infrastructure increase. It added that Saudi Arabia has signalled a possible military shift, while Israel and the US carried out new strikes on Iran.
Geopolitical Risks Lift Safe Haven Demand
Tehran stepped up attacks on Gulf neighbours and issued threats, and Israel confirmed a second wave targeting infrastructure in Tehran. Earlier, the US Dollar had weakened against major peers after US President Donald Trump delayed planned strikes on Iranian energy infrastructure by five days, referring to productive talks with Iran.
Iran’s Foreign Minister Abbas Araghchi said there had been no engagement with Washington. On Monday, Iranian Parliament Speaker Mohammad Bagher Ghalibaf also said no negotiations had taken place, and senior military adviser Mohsen Rezaei said the conflict would continue until Iran receives full compensation for damage.
Traders are awaiting the flash S&P Global US PMI data for March later on Tuesday. Switzerland’s ZEW Survey – Expectations for March and the SNB Quarterly Bulletin for Q1 are due on Wednesday.
We recall how last year, around this time in 2025, geopolitical flare-ups in the Middle East drove significant safe-haven demand for the US Dollar. The conflict between Iran, Israel, and the US created immense uncertainty, pushing the USD/CHF pair up towards the 0.7900 level as traders abandoned risk. That environment rewarded long-dollar positions.
Central Bank Divergence Takes The Lead
The landscape has since shifted from geopolitics to a focus on central bank policy divergence. While tensions in the Gulf have cooled over the past year, the primary driver now is the differing outlooks of the Federal Reserve and the Swiss National Bank. We are now watching economic data far more closely than military headlines for cues on the pair’s direction.
Recent data shows US inflation is finally softening, with the latest February 2026 CPI figure coming in at 2.8%, slightly below consensus. This has increased market chatter that the Fed may signal a pivot towards rate cuts by the third quarter. This potential for monetary easing puts downward pressure on the dollar’s long-term strength.
Conversely, the Swiss National Bank remains concerned about its own sluggish economy and low inflation, which was last reported at only 0.5% year-over-year. The SNB surprised markets with a 25 basis point rate cut just last week, reinforcing its dovish stance to prevent the franc from strengthening too much. This makes holding the franc less attractive from a yield perspective.
For derivative traders, this creates an environment where the USD’s yield advantage is starting to erode, but the SNB is actively trying to weaken its own currency. We should consider positioning for a potential decline or range-bound price action in USD/CHF from its current level around 0.8850. Buying medium-term put options on USD/CHF could offer a favorable risk-reward to capitalize on a dollar downturn driven by Fed rate cut expectations.
Given the opposing pressures from both central banks, implied volatility may be underpriced. If we anticipate that the market will break decisively one way or the other as central bank paths become clearer, purchasing a long straddle could be a viable strategy. This would allow us to profit from a significant price move in either direction, bypassing the challenge of predicting the winner in this monetary policy tug-of-war.
Create your live VT Markets account and start trading now.
Start trading now – Click here to create your real VT Markets account
GBP/USD fell back towards 1.3400 in Tuesday’s Asian session after small gains the day before. The move came as risk aversion rose, linked to reports that US-aligned Gulf states may move closer to direct involvement in the Iran conflict.
A Wall Street Journal report said Saudi Arabia has signalled a possible military shift. Israel carried out another attack on Iran despite comments from US President Donald Trump about pausing strikes on energy infrastructure after talks described as productive.
Rising Geopolitical Risk
Iran’s Foreign Minister Abbas Araghchi said there had been no engagement with Washington. Iranian Parliament Speaker Mohammad Bagher Ghalibaf also said on Monday that no negotiations had taken place, while adviser Mohsen Rezaei said the conflict would continue until Iran receives full compensation for damage incurred.
Markets are awaiting Tuesday’s flash S&P Global PMI data for March in both countries. UK manufacturing PMI is forecast at 51.1 versus 51.7, and services at 53.0 versus 53.9, with weaker readings potentially affecting expectations for Bank of England policy.
The Bank of England held rates at 3.75% at its March meeting on Thursday. Governor Andrew Bailey said the Middle East conflict is expected to shock the economy and lift inflation near term, and noted the Strait of Hormuz as key for restoring safer shipping and easing energy prices.
We recall the risk aversion that gripped markets in March 2025 as tensions with Iran flared up, driving GBP/USD down from the 1.3400 level. That period validated the safe-haven appeal of the dollar, while the Pound bore the brunt of the geopolitical shock to energy prices. Looking back, the Bank of England’s fears were realized as Brent crude briefly spiked over $115 per barrel that spring, forcing inflation to remain elevated for two more quarters.
Volatility And Policy Outlook
Today, with the pair trading near 1.2850, the market’s memory of that volatility remains a key factor for us. While direct conflict has subsided, options pricing shows a persistent risk premium on any news out of the Strait of Hormuz. Implied volatility for GBP/USD, currently around 8.5%, is still elevated compared to the pre-2025 average of 6%, suggesting traders should be prepared for sharp, sudden moves.
The Bank of England’s response to that inflation shock has left its key rate at 4.25%, yet the economy is now showing signs of strain. Last month’s UK services PMI fell to 51.5, a concerning echo of the slowdown we saw begin in the flash PMI data from March 2025. This divergence between a hawkish central bank and a weakening economy makes long volatility strategies, such as buying straddles on GBP/USD, attractive ahead of key data releases.
Create your live VT Markets account and start trading now.
Start trading now – Click here to create your real VT Markets account
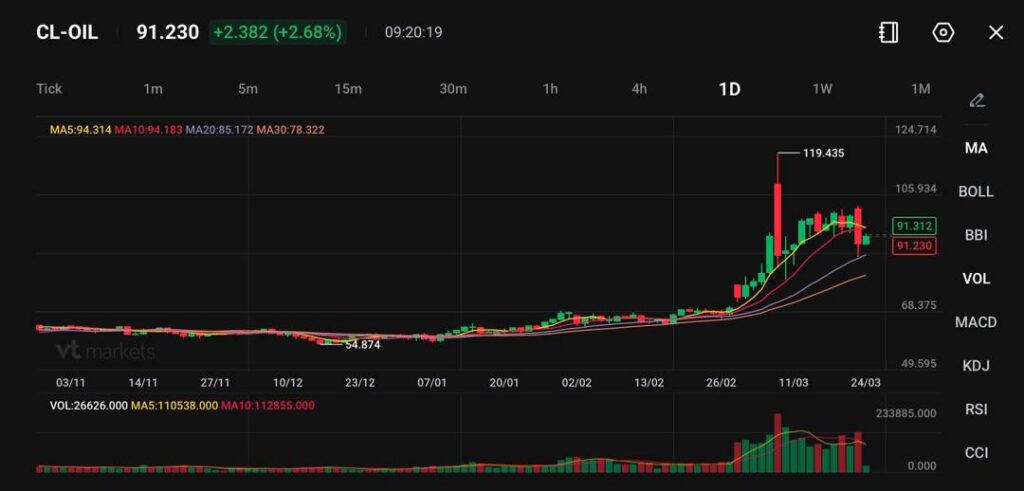
WTI trades near 91.23, up +2.382 (+2.68%), while Brent rebounds above $100 per barrel.
Risk sentiment remains fragile as Strait of Hormuz disruptions persist and conflict escalates.
Governments respond with stockpile releases and demand cuts, highlighting supply stress.
Oil prices pushed higher again after a brief pullback, reinforcing how sensitive markets remain to developments in the Middle East.
WTI crude is trading near 91.23, up +2.68%, while Brent crude has climbed back above $100 per barrel, reversing earlier losses. The rebound follows a short-lived relief rally that faded quickly as geopolitical tensions intensified.
Contracts representing millions of barrels of oil changed hands about 15 minutes before a social media post from Trump that sent crude prices tumbling by as much as 14% https://t.co/NMfXrpUftb
The market reaction shows that any dip in oil prices is being treated as temporary, with traders continuing to price in supply risks.
Oil may remain volatile, with upward pressure persisting as long as supply disruptions are unresolved.
Strait of Hormuz Remains the Core Risk
The situation around the Strait of Hormuz continues to dominate the oil narrative. Despite diplomatic signals, there is little evidence of de-escalation.
The strait remains effectively constrained, limiting the flow of crude and LNG through one of the world’s most critical energy corridors.
Iran attacks in Strait of Hormuz are ‘economic terrorism against every nation,’ UAE oil CEO says https://t.co/3iuwXC7lLT
Iran’s continued missile activity and the lack of confirmed negotiations have kept markets on edge. Even with a short extension to diplomatic timelines, traders are not pricing in a quick resolution.
This sustained uncertainty is preventing oil from correcting meaningfully lower.
If the strait remains restricted, oil prices could reprice higher as global inventories tighten.
Global Response Highlights Supply Stress
Governments are already taking steps to manage the shock.
Japan has announced plans to release oil from joint stockpiles by the end of March, while South Korea is pushing for nationwide energy-saving measures. These actions reflect growing concern over prolonged supply constraints.
Meanwhile, reports that Iranian oil is being offered to Indian refiners at a premium to ICE Brent suggest that even sanctioned supply is being reintroduced under strained conditions.
These developments underline how tight the global energy market has become.
Risk Sentiment Turns Choppy Across Markets
The oil rebound has weighed on broader market sentiment.
Asian equities saw only a modest recovery, while U.S. and European futures declined, reflecting uncertainty over growth and inflation.
At the same time, the U.S. dollar regained strength, and Treasury yields resumed their climb, signalling a shift back toward defensive positioning.
Higher oil prices raise inflation risks, which in turn complicate central bank policy and pressure risk assets.
Continued energy price strength could weigh on equities and support the dollar in the near term.
Technical Analysis
Crude Oil (CL-OIL) is trading near $91.23, up around 2.68% on the session, showing a short-term rebound after the recent pullback from the $119.43 spike high. The move suggests buyers are stepping back in around key support, though the broader structure is still in a cooling phase after the earlier surge.
From a technical perspective, oil remains in an overall uptrend, but momentum has clearly softened. Price is now sitting just below the 5-day MA (94.31) and 10-day MA (94.18), both of which are turning lower and acting as immediate resistance. Meanwhile, the 20-day MA (85.17) and 30-day MA (78.32) remain well below price and continue to slope upward, indicating that the broader bullish structure is still intact.
Key levels to watch:
Support:$90 → $85 → $78
Resistance:$94–95 → $100 → $105+
The $90 region is proving to be an important near-term support zone. Holding above this level keeps the structure constructive and supports the idea of consolidation rather than reversal. A break below it, however, could trigger a deeper retracement toward the $85 region, where the 20-day average aligns.
On the upside, price needs to reclaim $94–95 to regain momentum. A sustained move above this area would likely open the path back toward $100, followed by the $105–110 zone, though the $119 high remains a distant and strong resistance level for now.
Overall, oil appears to be transitioning from a parabolic rally into a consolidation phase, with buyers defending key support but struggling to reclaim short-term control. The next move will likely depend on whether price can decisively break back above $95 or lose the $90 floor, which would define the next directional leg.
Macro Data and Central Banks in Focus
Beyond geopolitics, markets are also watching incoming economic data.
Upcoming flash PMI readings for the Eurozone, UK, and U.S. will provide insight into how the energy shock is impacting economic activity.
At the same time, Japan’s core inflation slowing below the 2% target adds another layer of complexity for central banks trying to balance growth and inflation risks.
These macro factors will play a key role in shaping expectations for monetary policy in the coming weeks.
What Traders Should Watch Next
Markets remain driven by a mix of geopolitical and macro forces. Key areas to monitor include:
Developments around the Strait of Hormuz
Oil price behaviour above the $100 Brent level
Government responses to energy shortages
Central bank reactions to inflation risks
Upcoming PMI data releases
For now, oil’s rebound highlights a market that remains tightly linked to geopolitical developments, with volatility likely to persist as supply risks evolve.
Learn more about trading Energies on VT Markets here.
FAQs
Why Did Oil Prices Rise Again Today? Oil prices rebounded because geopolitical tensions remain high and supply disruptions through the Strait of Hormuz continue to restrict global energy flows.
Where Are Oil Prices Trading Now? WTI crude is trading near 91.23, up +2.68%, while Brent crude has climbed back above $100 per barrel.
Why is the Strait of Hormuz So Important for Oil? The Strait of Hormuz handles roughly 20% of global oil shipments, making it one of the most critical chokepoints for global energy supply.
Is the Oil Rally Likely to Continue? Oil could remain supported if supply disruptions persist. However, short-term pullbacks may occur as markets react to news and policy responses.
How Are Governments Responding to the Oil Shock? Countries are releasing strategic reserves and implementing energy-saving measures. Japan plans to release oil from stockpiles, while South Korea is reducing energy usage.
Why Are Markets So Volatile Right Now? Volatility is driven by uncertainty around the Middle East conflict, fluctuating oil prices, and concerns about inflation and economic growth.
Start trading now – Click here to create your real VT Markets account
Dow Futures (YM) has been falling since the all-time high on 10 February 2026 at 50,611, as part of a correction that began from the April 2025 low. The decline is described as a double three Elliott Wave pattern, with wave W dropping to 46,333 and wave X rebounding to 48,275 on a one-hour chart.
After the wave X peak, wave ((A)) fell to 45,453 and wave ((B)) rose to 47,210, which is treated as complete. The current wave Y is continuing lower with a zigzag-style internal move.
Near Term Technical Levels
Near-term price action is expected to stay weak if rebounds remain below 47,210 and especially below 48,275. Fibonacci extension levels from the 10 February 2026 high give a downside target zone of 41,268 to 43,925, based on the 100% to 161.8% extension range.
The move is framed as a corrective phase within the wider cycle. The 41,268–43,925 area is presented as a place where buying could appear after the correction concludes.
We are seeing the Dow in a corrective phase, pulling back from the major rally that began in April 2025. This current decline appears to be a complex, structured move rather than a simple dip. The expectation is for more downside as long as the index remains below the key resistance level of 47,210.
This technical outlook is reinforced by a rise in market uncertainty, with the VIX volatility index recently climbing above 22 for the first time since October 2025. This move coincides with recent inflation data for February coming in slightly higher than anticipated, which has dampened expectations for near-term interest rate cuts from the Federal Reserve. This broader economic environment supports the case for a continued pullback in equities.
For the near term, this suggests that strategies like buying put options or using bear put spreads could be effective. These approaches allow traders to profit from a potential decline toward our target zone. This provides a way to participate in the expected downward move while maintaining a clearly defined risk, should the market unexpectedly rally past resistance.
Positioning And Strategy
Our primary downside target is the zone between 41,268 and 43,925. A drop to this level would represent a market correction of approximately 15% from the February 10th all-time high. Historically, corrections of this magnitude are not uncommon following the kind of significant rally we witnessed over the last year.
As the Dow approaches this target area, the strategy should shift from bearish to neutral. We would then look to close short positions and start watching for signs that the correction is complete. At that point, traders can begin to prepare for the next potential long-term move higher by considering strategies like selling cash-secured puts or buying call options.
Create your live VT Markets account and start trading now.
Start trading now – Click here to create your real VT Markets account
The Australian Dollar fell against major peers, down 0.6% to about 0.6760 in Asian trade on Tuesday. Risk aversion returned after Iran said it is not involved in peace talks with the US.
On Monday, US President Donald Trump said military attacks on Iran’s power plants were paused for five days. He said talks with Tehran were “very good and productive” and aimed at a “complete and total resolution” of hostilities in the Middle East.
Dollar Strength Returns
The risk-off move supported the US Dollar after it had dropped following Trump’s remarks. The US Dollar Index (DXY) was up 0.25% at around 99.40.
The AUD also faced pressure from weak Australian S&P Global PMI figures for March. Composite PMI fell to 47.0 from 52.4 in February, and readings below 50.0 indicate contraction.
Markets are also waiting for Australia’s February CPI data on Wednesday. The report is expected to have limited effect on the Reserve Bank of Australia outlook, as it does not capture the recent rise in energy prices linked to the Iran conflict.
The renewed risk aversion, driven by Iran’s dismissal of peace talks, is strengthening the US Dollar and directly weighing on risk-sensitive currencies like the Australian Dollar. This geopolitical tension creates a clear “risk-off” environment. We see traders moving capital into safe-haven assets, a trend that is likely to continue as long as the situation in the Middle East remains uncertain.
Options And Volatility Signals
The sharp drop in Australia’s Composite PMI to 47.0 is a significant red flag for the domestic economy, signaling a contraction for the first time in several months. This weak data, which follows last week’s report showing a 0.8% fall in retail sales for February, suggests that the internal economic momentum is fading fast. This provides a fundamental reason for Aussie dollar weakness beyond just global sentiment.
Given this dual threat of geopolitical instability and domestic economic slowing, we are positioning for further downside in the AUD/USD pair. Put options offer a defined-risk way to profit from a potential drop towards the 0.6650 support level. We saw a similar dynamic in mid-2025 when concerns about global growth sent the Aussie tumbling, and history suggests these moves can be swift.
The conflicting statements from Washington and Tehran are also increasing market uncertainty, which is reflected in the options market. Implied volatility for AUD/USD one-month options has jumped to 12.2%, its highest level this year. This makes strategies like buying straddles or strangles interesting for those expecting a large price move in either direction, though the current bias is clearly to the downside.
This economic downturn places immense pressure on the Reserve Bank of Australia, making any future interest rate hikes highly improbable. In fact, overnight index swaps are now pricing in a 35% probability of an RBA rate cut by its June meeting. Any confirmation of this dovish pivot in the coming weeks would act as another catalyst for a lower Australian Dollar.
Create your live VT Markets account and start trading now.
Start trading now – Click here to create your real VT Markets account