TD Securities said gold’s bull run is losing support as official sector buying weakens. It linked this to energy shocks facing Asian energy importers and Middle Eastern producers, which may reduce surpluses and gold purchases.
The note also referred to reports that Turkey has considered using gold reserves to support the lira. It added that headwinds for official sector demand are the toughest since the Russia-Ukraine period.
Official Sector Demand Weakens
TD said institutional and retail participation in gold is already high. It also said the “debasement” trade is fading, with fewer expected US Federal Reserve cuts, no excess money supply growth, and lower concerns about Fed independence tied to a Supreme Court decision related to Lisa Cook’s trial.
TD described recent price strength as driven by successive waves of buying from different capital pools. It said this raises the risk of a positioning washout.
TD’s simulations indicated many scenarios could trigger CTA selling in the coming week. It said this would involve algorithms cutting long positions for the first time since February 2024.
Positioning Washout Risk Rises
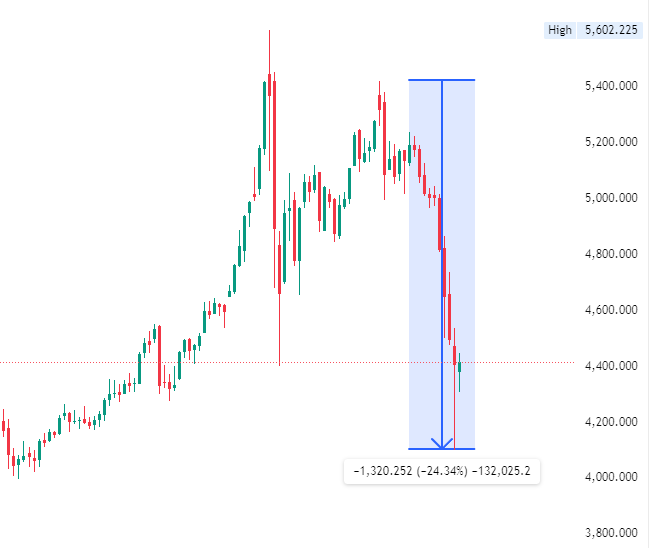
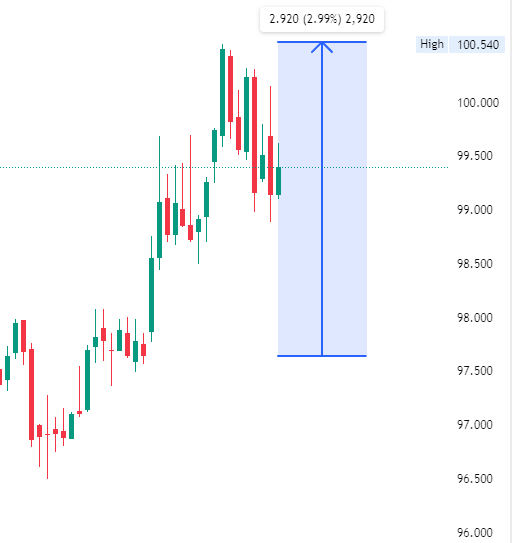
Gold’s upward trend appears increasingly fragile as the primary buyers are showing signs of exhaustion. Soaring energy costs, with crude oil having pushed back above $95 a barrel in early 2026, are straining the finances of key Asian importers. This significantly reduces the surplus cash their central banks have to continue buying gold at the aggressive pace we saw through 2024 and 2025.
This slowdown in official demand is becoming more apparent, with recent reports indicating that central bank net purchases in the last quarter of 2025 were the lowest in over two years. Nations dealing with their own economic shocks are also less likely to be buyers and may even consider selling reserves to stabilize their currencies. These factors remove a key pillar of support that has been driving the market.
From a positioning standpoint, the trade is dangerously crowded, leaving little room for new buyers to push prices higher. We’ve seen this before, where heavy institutional ownership precedes a sharp correction when the narrative shifts. Derivative traders must note that computer-driven trend-following funds (CTAs) are now at risk of liquidating the huge bullish positions they have held since the rally began in earnest back in February 2024.
The trigger for this selling is the fading economic reason to own gold, as the Federal Reserve has signaled its pause on rate cuts will likely extend through 2026 due to persistent inflation. Without the prospect of cheaper money, a minor price dip could easily start a waterfall of automated selling from these CTA funds. This makes the risk of a rapid positioning washout to the downside particularly high in the weeks ahead.
Create your live VT Markets account and start trading now.
Start trading now – Click here to create your real VT Markets account
The EU has signed a free trade agreement with Australia as it seeks to broaden its economic links amid geopolitical risk. The deal follows agreements with Mercosur, India and Indonesia, and still needs approval from the European Parliament.
The agreement includes tariff cuts and higher quotas for some dairy products, plus beef and sheep meat. It also protects geographical product names, affecting how certain foods can be marketed.
Trade And Security Implications
The European Commission estimates the deal could raise annual bilateral trade by about €20 billion over the next decade. The deal also includes a security and defence partnership and provisions linked to access to Australia’s critical raw materials.
The article was produced using an Artificial Intelligence tool and reviewed by an editor.
The EU is clearly trying to secure its supply chains, and this new Australian trade agreement is a major part of that strategy. While the deal mentions agriculture, its real focus is geopolitical security and critical raw materials. For us, this creates clear opportunities in specific commodity and equity derivatives over the next few weeks as the market digests the details.
We expect downward pressure on European agricultural producers, particularly in the beef and dairy sectors, due to increased Australian quotas. We saw what happened with beef futures back in 2025 when the Mercosur deal was finally ratified, causing a temporary dip in European producer stocks. Consequently, buying put options on select European food producers could be a prudent short-term move to hedge against this incoming competition.
Critical Raw Materials And Market Positioning
The most significant angle is the improved access to Australia’s critical raw materials, like lithium and rare earths. Australia remains the world’s top lithium producer, with government figures from the 2024-2025 fiscal year showing exports of the material grew by over 30%. Securing this supply is a huge strategic win for EU industry and de-risks a major bottleneck.
We should be looking at call options on major Australian resource companies, as their long-term access to the vast EU market is now more secure. This also helps European EV and battery manufacturers, who have been struggling with volatile input costs. Considering the long-term nature of this supply security, longer-dated call options on these EU industrial names might also be attractive.
This agreement is also likely to affect the EUR/AUD currency pair, as increased and more secure trade should favour the Australian economy. The Australian dollar has already seen a slight firming to 1.64 against the Euro this past month on preliminary trade whispers. We could see the Aussie dollar strengthen further, making options that bet on this trend worth considering.
Create your live VT Markets account and start trading now.
Start trading now – Click here to create your real VT Markets account
In 2026, gold often dips during market fear as institutions sell their most liquid assets to raise quick cash.
The dollar remains a primary short-term headwind, suppressing gold prices as global capital flows into dollar-denominated safety.
Large-scale players view sharp pullbacks as strategic accumulation points rather than a signal to exit the market.
Sustained high energy costs and oil prices are reintroducing long-term inflation issues that fundamentally support gold.
Central banks are consistently shifting reserves away from fiat currencies, maintaining a strong foundation for a $5,000 reset.
The $5,000 Reset: Is Gold’s 2026 Rally Just Getting Started?
Gold‘s price action in 2026 has been somewhat erratic and left many confused. While the macro environment of geopolitical tensions and slowing global growth suggests further upside, gold has unexpectedly dipped during risk-off moments. Understanding this requires looking past short-term noise to the structural reset currently in progress.
Traditionally, gold thrives when fear and uncertainty enter the markets. However, in recent months, sharp selloffs in risk assets have not always translated into immediate gold strength. This comes from liquidity dynamics rather than a breakdown in gold’s safe-haven role.
When markets turn risk-off abruptly, institutions often look for liquidity. This means selling what they can, not necessarily what they want to. Gold is one of the most liquid global assets and one that is easy to liquidate and therefore becomes a source of quick cash. In these moments, it becomes more of a funding tool than a hedge or store of value.
Additionally, the threat of margin calls across equities and derivatives increase and this means larger players need to unwind positions across the board. Gold gets caught in this cross-asset liquidation cycle which results in short-term downside pressure, even if the environment is fundamentally bullish for gold.
For retail investors, this creates confusion as it deviates from the norms as to what they are told to expect. But the reality is that the first phase of fear is often liquidation, not accumulation.
The USD and the Fiscal Time Bomb
The USD remains a dominant short-term variable, as global demand for safety often flows into dollar-denominated assets first, tightening liquidity and suppressing gold prices. However, this strength is often temporary. Once the initial liquidity squeeze passes, institutions often rotate back into gold as a strategic hedge against monetary instability and currency debasement.
While the USD offers immediate safety, the long-term fiscal pressures across major economies limit the ability of policymakers to maintain tight monetary conditions indefinitely. This creates a fiscal environment where gold eventually outperforms fiat currencies as a core strategic asset.
One of the clearest divides in the gold market now is between institutional positioning and retail sentiment.
Retail investors react emotionally to price volatility. Sharp pullbacks create fear, leading many to exit positions prematurely as they feel that the rally is over.
Institutions, on the other hand, operate with longer time horizons and allocation strategies. They see dips as opportunities to accumulate at better levels rather than a signal of failure. They take a view on the wider macro-outlook, taking into consideration real interest rates, central bank policy, and long-term inflation expectations.
Institutions do not see volatility as a threat but just part of the market cycle.
Oil as a Leading Inflation Indicator
Whilst oil and gold are both commodities, the main drivers of each are significantly different.
Oil is closely tied to economic activity and supply-demand dynamics, whereas gold is driven by monetary conditions and investor psychology.
Where there is some correlation is through inflation. Rising oil prices can contribute to higher inflation expectations, which in turn supports gold. When energy costs surge, central banks face increased pressure, often leading to policy shifts that favour gold over time.
The spike in oil prices caused by the war in Iran has led markets to price in rate hikes from the ECB and Bank of England, with the BoE potentially raising rates four times this year pic.twitter.com/lD1Du1jphc
Before the conflict in the Middle East, periods of declining oil prices had signalled weakening global demand, triggering risk-off sentiment, which, as mentioned, can initially weigh on gold due to liquidity-driven selling.
Sustained higher prices in oil, which we have seen since the War started, can reintroduce the inflation issue for Central Banks, which in the long-term could support gold.
So, whilst oil does not drive gold directly, it does significantly influence the macro backdrop, which impacts gold prices.
Is 2026 Still the Year of the Bull?
Is 2026 still the year of the bull? Despite volatility, the case for a $5,000 reset is supported by central banks shifting away from fiat reliance and the persistent erosion of real returns. Current dips appear to be part of a liquidation cycle and a reset that allows the market to build a stronger foundation.
Ignore the Liquidation Noise: Recognise that initial price drops during crises often force sales, not a loss of value.
Watch Real Rates: Inflation expectations continue to erode real returns, making gold’s lack of yield irrelevant compared to the loss of purchasing power in fiat.
Follow the Institutions: Treat sharp pullbacks as strategic accumulation points, mirroring the behaviour of central banks and professional allocators.
Gold is no longer just a defensive asset; it is becoming increasingly strategic in an unpredictable world. Beneath the surface of 2026 volatility, the structural drivers for gold’s performance remain firmly in place.
The Big Questions
1) Why is gold falling during recent risk-off moments?
Gold is currently functioning as a primary source of institutional liquidity rather than a standard hedge. When markets turn volatile abruptly, institutions sell gold because it is easy to liquidate to raise quick cash or meet margin calls across other asset classes. This initial phase of market fear often triggers liquidation before the traditional accumulation phase begins.
2) How does the US Dollar influence gold prices in 2026?
The USD remains a dominant variable that typically pressures gold lower by making it more expensive for non-dollar buyers. Throughout 2026, global demand for safety has favoured dollar-denominated assets, which tightens liquidity and suppresses gold prices even when market uncertainty is high.
3) What is the difference between institutional and retail gold strategies?
Retail investors often react emotionally to price volatility and may exit positions prematurely during sharp pullbacks. In contrast, institutions operate with longer time horizons, viewing these dips as strategic opportunities to accumulate gold based on macro factors like real interest rates and central bank policy.
4) How do oil prices impact the gold market?
While driven by different fundamentals, oil influences gold through inflation expectations. Rising energy costs increase the pressure on central banks, often leading to policy shifts that favour gold as a long-term store of value.
5) Is the structural bull case for gold still intact?
The broader outlook for gold remains positive as central banks continue to accumulate the metal to reduce reliance on fiat currencies. Persistent fiscal pressures and eroding real interest rates across major economies support the case for non-yielding strategic assets despite short-term price fluctuations.
Start trading now – Click here to create your real VT Markets account
The United States Redbook Index year-on-year reading was 6.7% on 20 March.
The previous reading was 6.4%.
Consumer Spending Accelerates
The uptick in the Redbook Index to 6.7% signals that consumer spending is not just holding up; it is accelerating. This continued strength puts pressure on the Federal Reserve, making it harder for them to justify any near-term interest rate cuts. We are now looking at the Fed’s April meeting as a likely hold, with futures markets quickly pricing out the probability of a rate cut before the third quarter.
This renewed inflation concern suggests traders should consider bearish positions on interest rate products. We’ve seen yields on the 10-year Treasury note already climb back towards 4.5% this month, a level not seen since late last year. Buying put options on long-duration bond ETFs or directly shorting Treasury futures could be a direct way to trade the expectation of higher-for-longer rates.
For equities, this creates a split market. Strong consumer spending is a clear positive for retail and consumer discretionary stocks, supporting the case for call options on sector-specific ETFs. This aligns with the latest jobs report from early March, which showed surprising strength in the services sector with over 250,000 jobs added.
However, the prospect of sustained high interest rates is a headwind for growth and technology sectors that are sensitive to borrowing costs. Looking back, we saw a similar dynamic in late 2025 when strong economic data repeatedly delayed the Fed’s pivot, causing significant underperformance in tech stocks. This suggests a cautious stance or even protective puts on interest-rate-sensitive areas of the market.
Dollar Strength In Focus
In currency markets, a hawkish Fed is bullish for the U.S. dollar. The Dollar Index (DXY) has already broken above 105 this week, reacting to the widening interest rate differential with Europe where recent data has been weaker. Long positions in the dollar against currencies with more dovish central banks appear increasingly attractive in the coming weeks.
Create your live VT Markets account and start trading now.
Start trading now – Click here to create your real VT Markets account
GBP/USD came under selling pressure on Tuesday after modest gains on Monday, as the US Dollar rebounded and UK preliminary S&P Global PMI data came in weaker than expected. The pair traded near 1.3395 early in the US session, while the US Dollar Index was around 99.40.
Market sentiment also weakened amid rising risk aversion linked to the Iran conflict. A Wall Street Journal report said US-aligned Gulf states moved closer to direct involvement, with Saudi Arabia signalling a potential military shift.
Middle East Conflict And Risk Sentiment
Israel carried out another attack on Iran after US President Donald Trump indicated a pause in strikes on energy infrastructure. Iran’s Foreign Minister Abbas Araghchi said there had been no engagement with Washington, and Parliament Speaker Mohammad Bagher Ghalibaf said on Monday that no negotiations had taken place.
UK PMI figures showed slower business activity in March. The Composite PMI fell to 51.0 from 53.7 versus 52.8 expected; Services dropped to 51.2 from 53.9 versus 53.0 forecast; Manufacturing eased to 51.4 from 51.7, above the 51.1 estimate.
Focus turns to US preliminary PMI data later Tuesday, then UK CPI and PPI on Wednesday. The BoE held rates at 3.75%, and the Fed kept rates unchanged in the 3.50%–3.75% range.
Looking back to this time in 2025, we saw the GBP/USD pair struggling under 1.3400 as conflict flared in the Middle East. Today, the landscape is different, with the pair trading significantly lower near 1.2550 as the US Dollar Index has since climbed to 105.20. The market has spent a year digesting the new geopolitical and economic realities.
Macro And Policy Divergence Outlook
The direct military conflict involving Iran, which we saw escalating last year, has since subsided into a tense standoff, though rhetoric remains heated. Oil prices, after spiking above $110 per barrel in mid-2025, have stabilized, with Brent Crude recently trading in a range around $90 per barrel. Shipping volumes through the Strait of Hormuz are operating at about 90% of pre-conflict levels, but higher insurance premiums are now a permanent feature of the market.
Unlike the slowdown we saw in March 2025 when the Composite PMI hit a six-month low of 51.0, the UK economy is showing more resilience. The latest S&P Global Composite PMI for February 2026 registered a solid 53.0, indicating steady expansion in the services sector. This improvement comes as the headline Consumer Price Index has cooled considerably, with the latest data showing inflation at 3.4%.
This evolving data puts the Bank of England in a new position. After holding rates steady at 3.75% during the peak uncertainty last year, the BoE is now widely expected to begin an easing cycle to support the economy. We see markets pricing this in, with Overnight Index Swaps showing a greater than 75% probability of a 25-basis-point rate cut by the June meeting.
In contrast, the Federal Reserve faces a different picture, as core inflation in the US has proven more persistent, recently printing at 3.2% for February 2026. This stickiness, combined with a robust labor market, suggests the Fed will likely hold its benchmark rate steady for longer than the BoE. This growing policy divergence is becoming the primary driver for foreign exchange markets.
Given this backdrop, traders should consider positioning for further GBP/USD weakness driven by the widening interest rate differential. Using derivative instruments like 3-month put options on the GBP/USD allows for a defined-risk approach to this view. For those managing interest rate exposure, positioning in SONIA futures to reflect the anticipated BoE rate cuts appears to be the consensus trade.
Create your live VT Markets account and start trading now.
Start trading now – Click here to create your real VT Markets account
Copper prices on the LME fell about 1% today, giving back part of Monday’s rally. The rise on Monday followed President Trump’s temporary pause in planned US strikes on Iran’s energy infrastructure.
Prices then slipped after Tehran denied any ongoing negotiations. Copper is down about 10% this month.
The monthly fall has led to renewed Chinese buying. Mysteel data shows inventories fell by 78,700 tonnes last week to 486,200 tonnes, the largest weekly draw this year.
The report says this points to stronger physical demand after the recent price correction. The article was produced with the help of an AI tool and reviewed by an editor.
We recall from 2025 how geopolitical noise, like the temporary pause in US-Iran strike plans, created short-term volatility in copper. A subsequent 10% price drop was met by a surge in Chinese buying, highlighted by the largest inventory withdrawal of that year. That period showed us how physical demand provides a floor for prices during corrections.
Today’s market is significantly tighter, with copper prices recently trading above $9,000 per metric ton amid ongoing supply disruptions. LME warehouse inventories are hovering near just 112,000 tonnes, drastically lower than the nearly 500,000-tonne buffer we saw before the big draw in 2025. This leaves the market far more exposed to any demand-side surprises.
Chinese demand is also showing signs of recovery, as the Caixin manufacturing PMI recently rose to 50.9, signaling an expansion in activity. This is not the opportunistic bargain-hunting of 2025, but a fundamental return of demand into a market with very thin stockpiles. This combination points towards a market highly sensitive to any further positive economic data.
Given the low inventory cushion, derivative traders should consider positioning for increased price volatility. Any unexpected surge in buying or further supply issues could cause a sharp upward move. Buying call options could offer a defined-risk way to capture potential upside in the coming weeks.
The structure of the futures market should also be monitored closely for signs of extreme tightness. A move deeper into backwardation, where spot prices are higher than future prices, seems likely. This would present opportunities for calendar spread trades that profit from the front end of the curve strengthening relative to deferred months.
Start trading now – Click here to create your real VT Markets account
US unit labour costs rose 4.4% in the fourth quarter. This was above the forecast of 3.3%.
The data indicates faster growth in labour costs per unit of output than expected. The release compares the actual figure (4.4%) with the forecast (3.3%).
Labour Cost Surprise Challenges Rate Cut Timing
The fourth-quarter unit labor costs from 2025 have come in much hotter than anticipated, showing a 4.4% increase instead of the expected 3.3%. This is a strong signal that wage pressures are not easing as quickly as we had hoped. For the Federal Reserve, this data challenges the prevailing view that inflation is fully under control.
We believe this puts the possibility of a mid-year interest rate cut in jeopardy. The market is already reacting, with SOFR futures contracts now pricing in less than a 25% chance of a rate cut before September 2026, down from over 60% just last week. Traders should look at selling interest rate futures to position for a more hawkish Fed stance in the coming months.
This uncertainty is a clear catalyst for higher market volatility. The VIX index has already jumped from a low of 14 last month to over 18, and we anticipate it could test the 20 level. We see value in purchasing call options on the VIX or establishing put option spreads on the SPX to hedge against a potential market downturn.
This situation feels similar to what we observed in early 2022, when stubborn inflation data forced the Fed to abandon its transitory narrative and begin an aggressive hiking cycle. While we do not expect a repeat of that magnitude, history shows that the market often underestimates the Fed’s resolve when faced with persistent inflation. This historical precedent suggests a cautious and defensive posture is warranted.
Dollar Strength Likely On Higher For Longer Narrative
The U.S. dollar is also likely to strengthen on the back of higher-for-longer interest rate expectations. The U.S. Dollar Index (DXY) has already climbed 1.5% this month to a high not seen since late 2025. We think going long the dollar against currencies whose central banks remain dovish, such as the yen or the euro, is a trade with a favorable outlook.
Create your live VT Markets account and start trading now.
Start trading now – Click here to create your real VT Markets account
EUR/GBP traded near 0.8650 on Tuesday and was little changed on the day. The move came after weaker activity data from both the Eurozone and the UK, pointing to slower growth.
In the Eurozone, the preliminary HCOB Composite PMI fell to 50.5 in March from 51.9 in February, below expectations. Services eased to 50.1, while manufacturing rose to 51.4.
Eurozone Cost Pressures And Supply Risks
The report also noted higher energy prices linked to the war in the Middle East and added supply chain disruption. Supplier delivery times lengthened, and input costs rose at the fastest pace in more than three years.
In the UK, the S&P Global Composite PMI dropped to 51 in March from 53.7. Services fell to 51.2 from 53.9, and manufacturing also slowed.
TD Securities pointed to rising cost pressures from higher energy prices and supply issues. It expects UK inflation to hold at 3% year on year in February, with a possible rise in coming months.
Attention turns to comments from ECB officials later on Tuesday. Markets also await UK inflation data on Wednesday for further policy direction.
Trading Implications For Eurgbp Options
With both the Eurozone and the UK showing clear signs of a growth slowdown, the stability in EUR/GBP around 0.8650 looks fragile. We are seeing weak PMI data across the board, which points to a loss of economic momentum. This stagnation, combined with rising costs, is creating a difficult environment.
The main concern is the return of stagflation fears, fueled by rising energy prices from Middle East conflicts and new supply chain disruptions. We are seeing firms’ costs increase at the fastest rate in years, a worrying echo of the inflationary spike we witnessed a few years ago. This puts central banks in a bind, as they were hoping for a smoother path after the disinflationary trend we saw through 2024 and 2025.
For derivative traders, this uncertainty is an opportunity to look at volatility. With both the European Central Bank and the Bank of England facing tough choices, implied volatility on EUR/GBP options could be underpriced. Buying straddles or strangles could be a sound strategy to position for a significant breakout, regardless of the direction.
The upcoming UK inflation data is a critical catalyst. We saw UK inflation prove sticky throughout last year, struggling to fall below the 3% level, and another high reading could force the Bank of England to adopt a more hawkish tone than the ECB. This would create a divergence in policy expectations, likely pushing EUR/GBP lower.
On the other hand, if speeches from ECB officials highlight a greater concern for inflation over growth, the dynamic could reverse. Given that Eurozone inflation has also been stubborn, any signal that rate cuts are off the table would support the euro. The key is to use options to bet on which economy is perceived to be in a worse position.
Create your live VT Markets account and start trading now.
Start trading now – Click here to create your real VT Markets account
US private-sector hiring showed more momentum in early March. The NER Pulse, a weekly companion to the ADP National Employment Report, reported that firms added an average of 10K jobs per week in the four weeks through 7 March.
This was higher than the previous reading. Weekly US labour market data due on Thursday is expected to give more detail on whether the rise is short-lived or lasting.
Early March Hiring Signals
Looking back to early March of 2025, we saw a similar moment of indecision in the labor market. A small increase in private hiring suggested a recovery was building, but it wasn’t a strong enough signal to act on with conviction. The market held its breath for the official government data, which ultimately confirmed the underlying strength and rewarded those positioned for growth.
Today, we face a comparable situation as the February jobs report showed a healthy gain of 210,000 jobs, but this was paired with slowing annual wage growth of just 3.8%. This mixed signal, combined with a recent Consumer Price Index reading of 3.4%, creates significant uncertainty around the Federal Reserve’s next move. All eyes are now on the upcoming non-farm payrolls data due in the first week of April.
In the coming weeks, traders should consider buying volatility ahead of that jobs report. Purchasing at-the-money straddles on indices like the SPX is a direct bet that the market will move sharply in either direction once the data is released. With the VIX index currently sitting at a moderate 18, the cost of entry for these positions is not yet prohibitive.
For those with a directional bias, using options provides a defined-risk way to express a view. If we believe the labor market is re-accelerating, buying call options on rate-sensitive ETFs like the QQQ offers upside exposure with a capped downside. Conversely, if slowing wage growth is seen as a sign of a weakening consumer, put options could serve as an effective tactical position.
Traders can also use option spreads to cheapen the cost of their view or to hedge existing portfolios. A bull call spread could be used to position for a moderately positive jobs report at a lower premium cost than an outright call. Meanwhile, buying simple put options on individual stocks that have run up recently can act as inexpensive insurance against a market-wide negative reaction.
BNY’s Head of Markets Macro Strategy, Bob Savage, relayed comments from RBNZ Governor Anna Breman on the Middle East conflict and its effects on New Zealand. Breman expects the conflict to raise near-term headline inflation and weaken New Zealand’s growth momentum.
She referred to risks to global financial stability that could affect New Zealand banks. She said domestic banks are resilient due to strong capital and liquidity buffers, and indicated the RBNZ is not in a hurry to raise interest rates.
Rbnz Policy Response Framework
Breman said the Monetary Policy Committee will assess the right response to avoid acting too early or too late. The committee aims to stop temporary inflation rises from becoming embedded.
The RBNZ’s stated aim is low and stable inflation over the medium term to support New Zealanders’ wellbeing. The article notes it was produced with the help of an AI tool and reviewed by an editor, with content selected by the FXStreet Insights Team.
The Reserve Bank of New Zealand is signalling it will hold rates steady, even as inflation pressures from the Middle East conflict build. With new data showing annual CPI at 4.1% while last quarter’s GDP growth was a mere 0.2%, the RBNZ is clearly more worried about a recession than inflation right now. This suggests we should position for the Official Cash Rate to remain on hold through the next few policy meetings.
This dovish stance in the face of rising inflation makes us cautious on the New Zealand dollar. The central bank is essentially choosing to support a weak economy, which is likely to make the NZD underperform against currencies whose central banks are more focused on fighting inflation. We see value in using options to express a bearish view on the NZD/USD pair for the coming quarter.
Nzd Volatility And Curve Implications
Looking back at the sharp policy pivots we saw in 2025, the RBNZ’s current inaction creates significant uncertainty for the medium term. This environment is ideal for long volatility strategies, as the market could be underpricing the risk of a sudden policy change later this year. Implied volatility on NZD options has already climbed to a three-month high of 11.2%, and we expect this trend to continue.
In the rates market, this policy dilemma points towards a steeper yield curve. The RBNZ’s statements should keep short-term bond yields anchored, as no hikes are imminent. However, persistent inflation fears will likely cause investors to demand higher yields on longer-term government bonds, widening the spread between two-year and ten-year notes.
Create your live VT Markets account and start trading now.
Start trading now – Click here to create your real VT Markets account