Gold prices increase in Saudi Arabia, according to recent data.
On Monday, gold prices in Saudi Arabia increased. According to data from FXStreet, the price rose to 521.91 Saudi Riyals (SAR) per gram, up from SAR 518.67 on Friday. The price per tola also went up to SAR 6,087.57, compared to SAR 6,049.62 before.
FXStreet evaluates gold prices using global rates converted to Saudi currency. Prices are updated daily based on market changes, but local prices may differ slightly.
Gold prices in the United Arab Emirates have risen, reflecting recent data trends.
The Role of Gold as a Store of Value
Gold is known as a store of value and a medium of exchange because of its long history and attractive appearance. It is a popular investment during uncertain times, helping to protect against inflation and currency decline. Central banks hold large amounts of gold to back their currencies, purchasing 1,136 tonnes valued at around $70 billion in 2022. This was the highest yearly acquisition on record. The price of gold usually goes up when the US Dollar and US Treasuries decline. Its value changes due to events like geopolitical tensions, recession fears, and interest rates. Because gold does not earn interest, it tends to increase in value when interest rates are low. Its price often reacts to the strength of the US Dollar. Currently, gold prices are gaining strength, fitting its historical role as a safe investment during tough times. This slight increase is part of a larger trend observed in the second half of 2025, suggesting the market is preparing for potential economic changes as we approach the new year.Market Dynamics and Derivative Trading
The main factor driving gold’s rise appears to be the expectation of a shift in Federal Reserve policy in 2026. After keeping interest rates high throughout 2024 and 2025 to combat earlier inflation, recent economic data shows a slowdown. The CME FedWatch Tool now indicates a greater than 60% chance of a rate cut by the second quarter of 2026, making non-yielding gold more appealing. This shift puts pressure on the US Dollar, which has an opposite relationship with gold. The Dollar Index (DXY) has already weakened from its highs earlier in 2025 and is now trading near the 101 level. A weaker dollar makes gold cheaper for people holding other currencies, usually increasing demand. This trend is supported by central banks continuing to purchase gold aggressively. Following record buying in 2022, the World Gold Council reports that central banks added another 850 tonnes to their reserves in the first three quarters of 2025. This steady demand helps maintain a strong price for gold. For derivative traders, this situation suggests it may be wise to consider cautious long positions. They might look at buying call options that expire in March or April 2026 to benefit from a potential rally triggered by a Fed policy change. This approach minimizes risk while offering significant profit potential. With uncertainty about when changes might happen, volatility is likely to rise. Traders might also use options to take advantage of this volatility, such as through a long straddle strategy. This would allow them to profit from significant price movements in either direction, which often occurs around important economic announcements. Create your live VT Markets account and start trading now.Gold prices in Pakistan rise, reflecting increased value according to recent data
**Gold Prices as a Safe-Haven Asset**
Gold prices depend on international rates and local currency exchanges. These prices are a reference point and can vary slightly in local markets.
Gold is known as a safe-haven asset, used to protect against inflation and weak currencies. Central banks hold a lot of gold and bought 1,136 tonnes in 2022 for stability and diversification.
Gold often moves in the opposite direction of the US Dollar and US Treasuries. Geopolitical issues and interest rates can influence gold prices; a falling Dollar usually causes gold prices to rise.
Several factors can affect gold’s price, including global events and the US Dollar’s strength. When interest rates are low and geopolitical worries are high, gold prices often rise because it does not provide interest.
**Current Market Dynamics**
As of December 15, 2025, gold prices continue to rise, driven by a shift in market attitudes. Expectations of Federal Reserve rate cuts in early 2026 are weakening the US Dollar, making gold more appealing. Recent US inflation data for November showed a steady 3.1%, reinforcing the need for gold as a hedge.
This trend is not based solely on short-term speculation; it is backed by major institutions. Central banks, especially in emerging markets, have maintained significant purchases throughout 2025, following a record buy in 2022 and 2023. According to the World Gold Council, central banks added another 280 tonnes to their reserves in the third quarter of 2025, indicating strong demand regardless of price.
The overall economic outlook also supports gold’s safe-haven appeal. Recent manufacturing PMI data from Europe and China points to a global slowdown. This uncertainty, along with ongoing geopolitical tensions, is driving investors away from risky assets like stocks. In November 2025, gold ETFs saw more than $1.5 billion in net inflows.
For derivative traders, this environment suggests buying calls or setting up bull call spreads on gold futures might be a wise strategy to benefit from further price increases. Though implied volatility has risen, it remains below earlier highs this year, providing a chance to enter long positions before gold potentially breaks above $2,450. Traders should look out for pullbacks to make their moves, as any dips have been brief and shallow.
This pattern has been seen before, especially after the 2008 financial crisis when monetary easing began. As interest rates drop and currencies weaken, gold tends to experience a lasting bull market. The current situation resembles those past cycles, indicating that gold is likely to move higher in the coming weeks.
Create your live VT Markets account and start trading now.
Gold prices rise in India according to recent data sources.
Gold prices in India increased on Monday, according to FXStreet data. The price per gram rose to 12,602.59 INR from Friday’s 12,527.28 INR. Similarly, a tola climbed to 146,994.10 INR from 146,115.80 INR.
Gold prices in India reflect global prices adjusted for the USD/INR exchange rate. These prices are daily estimates and can vary by location. Currently, gold is priced at 391,984.50 INR per troy ounce.
The Importance of Gold
Gold has always been valued as a way to store wealth and as a method of exchange. People often see it as a stable investment, especially in uncertain times. It also serves as a hedge against inflation and is not tied to any specific government. Central banks are significant buyers of gold, using it to back their national currencies. In 2022, these banks added 1,136 tonnes of gold, worth about $70 billion, which set a new record for annual purchases. The price of gold typically moves in the opposite direction of the US Dollar and US Treasuries; it goes up when the Dollar goes down. Geopolitical issues can also push gold prices higher due to its reputation as a safe haven. Lower interest rates tend to support gold prices, while higher rates may lower them. Recent trends show gold prices rising, with the latest jump over 12,600 INR per gram indicating a shift in market sentiment. This rise suggests that traders should keep an eye on the factors affecting precious metals, as opportunities could arise in the coming weeks. The recent increase in gold appears tied to a weaker U.S. Dollar, which has been declining against other currencies. Following a series of aggressive interest rate hikes by the U.S. Federal Reserve in 2023, the market now expects a more neutral or even dovish approach as we head into 2026. This shift usually puts pressure on the dollar, thereby increasing gold prices.The Role of Central Banks in Gold Prices
We should also highlight the ongoing purchases by central banks, which have provided strong support for gold prices. This trend follows 2022’s record addition of 1,136 tonnes to global reserves. Reports from the World Gold Council for 2024 and 2025 confirm that emerging markets are leading these purchases, absorbing supply from the market. Moreover, global inflation remains a major concern, as many economies struggle to reach the 2% target. This persistent inflation increases gold’s appeal as a reliable asset. Ongoing geopolitical tensions in key regions also drive investment toward safe-haven assets like gold. For those involved in trading derivatives, this environment suggests considering bullish strategies. Taking long positions in gold futures or buying call options can allow for exposure to a potential continued rise in prices. These strategies would benefit if the upward momentum lasts through the end of the year. However, with growing market uncertainty, implied volatility is rising, which can make buying options costlier. Therefore, traders might opt for strategies like bull call spreads. This approach helps manage initial costs while still allowing for profit from a moderate increase in gold prices. Create your live VT Markets account and start trading now.Gold prices in Malaysia increased today, according to financial data.
Gold prices in Malaysia are up, currently at 569.10 Malaysian Ringgits (MYR) per gram, compared to 565.36 MYR last Friday. The price for a tola has increased to MYR 6,637.84 from MYR 6,594.25.
FXStreet provides daily updates on Gold prices, using international rates (USD/MYR) and local metrics. Local prices may vary slightly. Gold is often seen as a safe investment during uncertain times and offers protection against inflation and currency drop.
Gold Buying by Central Banks
Central banks are significant buyers of Gold, purchasing 1,136 tonnes in 2022, worth about $70 billion. This was the largest annual purchase ever recorded. Countries like China, India, and Turkey are increasing their Gold reserves. Gold usually moves opposite to the US Dollar and US Treasuries—its value goes up when the Dollar is weak and down when the Dollar strengthens. Various factors affect Gold prices, including geopolitical issues, fears of recession, and interest rates. Since Gold is priced in dollars (XAU/USD), shifts in the Dollar impact Gold prices. When the Dollar is strong, Gold prices may fall; when it weakens, Gold prices often rise. The recent increase in Gold prices suggests we should pay attention in the coming weeks. This rise coincides with expectations that major central banks may stop raising interest rates, which is good for non-yielding assets like Gold. Recent US inflation data for November 2025 showed a lower-than-expected rate of 2.8%, raising speculation about a possible Federal Reserve rate cut in early 2026. This news has driven the US Dollar Index down to around 101.5, far lower than earlier highs. A weaker Dollar usually makes Gold cheaper for buyers using other currencies, increasing demand.Strategies for Traders
For those trading derivatives, increasing long positions could be smart. Buying call options or setting up bull call spreads on Gold ETFs or futures could provide a cost-effective way to take advantage of potential price increases while managing risk. As we approach the next central bank meetings, implied volatility may rise, making these trades more appealing. Ongoing demand from official sources remains a strong support for Gold prices. Reports indicate that central banks bought over 950 tonnes through the third quarter of 2025, continuing the strong buying trend we saw in 2022 and 2023. This institutional buying helps stabilize the market. This situation contrasts sharply with the high-interest rate environment of 2024, which created challenges for Gold. The market is now shifting its expectations for 2026, and this changing sentiment is what traders should focus on. In the futures market, maintaining a long position seems wise, especially as pullbacks to key levels may present good entry points. With the current macroeconomic changes, dips are likely to be seen as buying chances. We should keep an eye on upcoming employment and inflation data for any updates to this outlook. Create your live VT Markets account and start trading now.Japan’s monthly tertiary industry index rises by 0.9%, exceeding the previous 0.3% increase
Japan’s Tertiary Industry Index rose by 0.9% in October, an increase from 0.3% the month before. This growth suggests a recovery in the service sector, which is a positive sign for the economy.
This data comes at a time when Japan’s economic performance is under close examination, especially in regard to market expectations and central bank decisions. We will provide further updates as more information becomes available.
Economic Resilience Observed
As of December 15, 2025, the unexpected 0.9% rise in Japan’s October Tertiary Industry Index is notable. It confirms a trend of economic resilience that we have been tracking throughout the second half of the year. Strength in the service sector supports the idea that the Japanese economy can handle stricter monetary policies. This good news arrives alongside core inflation, which remains stubbornly high, currently at 2.4% for November 2025, above the Bank of Japan’s target of 2%. With resilient service sector activity and ongoing inflation, there’s a greater chance of an interest rate hike by the Bank of Japan in the first quarter of 2026. We expect the central bank’s guidance to become more hawkish in upcoming meetings. For currency traders, this outlook may lead to a stronger yen in the coming weeks. The USD/JPY is pulling back from earlier highs above 155 this quarter, and this data suggests further declines. Traders might consider buying JPY call options or selling out-of-the-money USD call options to prepare for a potential shift toward the 148-150 range.Impact on Japanese Equities
This forecast negatively affects Japanese equities. A stronger yen generally presents challenges for the export-driven Nikkei 225, which has already experienced profit-taking after reaching record highs in mid-2025. We recommend using derivatives to protect long equity positions, such as buying Nikkei put options for insurance against a downturn caused by currency fluctuations. We should recall the Bank of Japan’s slow, cautious shift away from its ultra-loose policy that began in 2024. While the bank is unlikely to make hasty decisions, the accumulating data suggests it may need to take action. The key focus will be on subtle changes in the Bank of Japan’s language, as that will likely trigger the next major move. Create your live VT Markets account and start trading now.Dividend Adjustment Notice – Dec 15 ,2025
Dear Client,
Please note that the dividends of the following products will be adjusted accordingly. Index dividends will be executed separately through a balance statement directly to your trading account, and the comment will be in the following format “Div & Product Name & Net Volume”.
Please refer to the table below for more details:
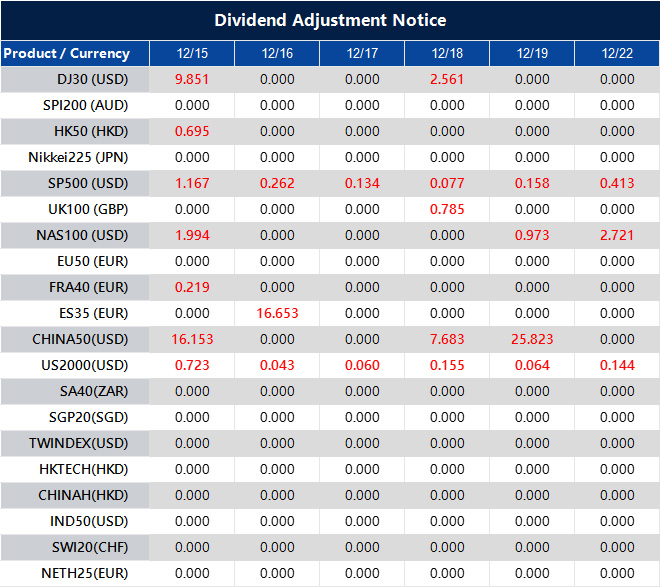
The above data is for reference only, please refer to the MT4/MT5 software for specific data.
If you’d like more information, please don’t hesitate to contact [email protected].
Fresh buyers boost silver market, reversing Friday’s losses and stabilizing around $62.50
Silver trading started the week positively, bouncing back from Friday’s drop, where it peaked around $64.65. During the Asian session, silver was priced in the mid-$62.00s, showing a 1.25% increase and hinting at continued upward momentum.
Technically, XAG/USD found support at the 100-hour Simple Moving Average, allowing it to stay above $62.00 and confirming the positive trend. However, with neutral hourly metrics and a slightly overbought daily RSI, traders should watch for challenges near $63.00. If momentum continues, XAG/USD may rise toward $63.80 and potentially surpass $64.00, challenging its recent peak near $64.65.
Downward Trends and Support Levels
If silver falls below $62.00, this could create a buying opportunity near the 100-hour SMA at $61.45. If prices drop further, they may slide under $61.00, heading toward $60.80, the previous low, which could lead to additional losses if broken. Silver, a precious metal used for both investment and industrial purposes, experiences price shifts driven by factors such as geopolitical events, interest rates, and the strength of the US Dollar. It is significantly affected by demand in electronics and solar energy and often moves in sync with gold prices. Traders use the Gold/Silver ratio to assess the value difference between these two metals. Recent price action shows that silver has a solid foundation near the 100-hour moving average, indicating that declines are being bought. For derivative traders, this may suggest selling out-of-the-money put options or implementing bull put spreads to collect premium as the uptrend continues. However, the overbought signal on the daily chart calls for caution, so it’s wise to avoid being overly aggressive with long positions at this time.Bullish Momentum and Market Sentiment
The fundamental backdrop supports this bullish trend, boosting our confidence. Recent data from the Silver Institute for Q3 2025 showed industrial demand rising by over 7% year-over-year, fueled by increased solar panel and electric vehicle manufacturing. Additionally, the US Dollar Index (DXY) fell below 98 last week, following the Federal Reserve’s indication of pausing its rate hikes, providing a strong boost for dollar-denominated assets like silver. This rally bears some resemblance to the speculative excitement that drove silver to a record high in 2011, a time also marked by a weak dollar and monetary policy concerns. As we take advantage of the current trend, using options to manage risk is smart in case of a sharp, unexpected downturn. For immediate price targets, any sustained move above $63.00 could encourage adding to long positions, potentially targeting the next resistance at $63.80. However, if the $61.45 support level fails to hold, it may signal a slowdown in the rally. A decisive break below this level could indicate a deeper correction, making protective puts worth considering for anyone holding long futures contracts. The Gold/Silver ratio has dropped significantly, hitting a 15-year low of 48 last month, indicating silver’s recent strong performance. While this reflects strong momentum, it also suggests that silver may be becoming overpriced compared to gold. Some may consider setting up pairs trades, predicting that gold may start to outperform silver as the ratio reaches a bottom. Create your live VT Markets account and start trading now.AUD/USD pair falls to around 0.6650 due to disappointing Chinese retail sales and industrial production figures
Recent Labor Market Data
New labor market data reveals that Australia’s economy lost 21,300 jobs in November, missing the expected gain of 20,000. The outlook for the US Dollar remains weak, with expectations for future interest rate cuts by the Federal Reserve. Current projections suggest a Federal Funds Rate of 3.4% by 2026. The value of the Australian Dollar (AUD) relies on several factors, including interest rates set by the Reserve Bank of Australia (RBA), the prices of commodities like Iron Ore, and the health of China’s economy. The RBA’s decisions and Australia’s Trade Balance also play a role in determining the AUD’s value. Generally, stronger economic conditions in China or rising Iron Ore prices support the Australian Dollar. Currently, the AUD is under pressure from disappointing data out of China, our largest trading partner. In November, both retail sales and industrial production fell short of forecasts. Additionally, the Caixin Manufacturing PMI for that month showed a contraction at 49.5. As a result, the AUD/USD pair is fluctuating around 0.6650.Fed Expectations Versus Market Reality
In Australia, last week’s labor market data revealed unexpected weakness, with over 21,000 jobs lost in November. This has led markets to bet on a possible interest rate cut by the RBA in 2026. Now, swap markets indicate nearly a 50% chance of a rate cut by mid-next year, a notable change. Even with these challenges for the Australian economy, the US Dollar is also facing difficulties. There’s a significant gap between the Federal Reserve’s recent guidance and market predictions for 2026. The Fed’s dot plot suggests only one rate cut for next year, while the fed funds futures are forecasting at least two or three. All attention is now on tomorrow’s US Nonfarm Payrolls report for November. Analysts expect about 150,000 new jobs to be created. If the actual number is much lower, it could strengthen the dovish narrative from the Fed and push the AUD/USD higher. Conversely, a strong report could challenge this view and likely drive the pair lower. Traders dealing in derivatives should be prepared for increased volatility around this release. We also need to keep an eye on commodity prices, a critical factor for the value of the AUD. For example, Iron Ore futures have dropped from their late October highs and are now trading below $130 per tonne. If commodity prices continue to fall, it could add more pressure on the AUD in the coming weeks. This situation feels similar to late 2023 when expectations for central bank shifts often overshadowed local data. During that time, we experienced increased fluctuations as traders balanced international and domestic influences. This indicates that managing positions during crucial data releases will require careful consideration of event risks. Create your live VT Markets account and start trading now.Weakened Chinese economic data leads to a drop in the New Zealand Dollar to around 0.5780 against the US Dollar
The NZD/USD pair fell to about 0.5780 during the Asian trading session on Monday. This decline was due to weak economic data from China. China’s Retail Sales increased by just 1.3% year-on-year in November, missing the expected 2.9%.
Chinese Industrial Production grew by 4.8% year-on-year, slightly lower than the forecast of 5.0%. These numbers have put pressure on the New Zealand Dollar because China is New Zealand’s biggest trading partner. Reserve Bank of New Zealand Governor Anna Breman stated that the economic outlook meets expectations, and the Official Cash Rate remains at 2.25%.


