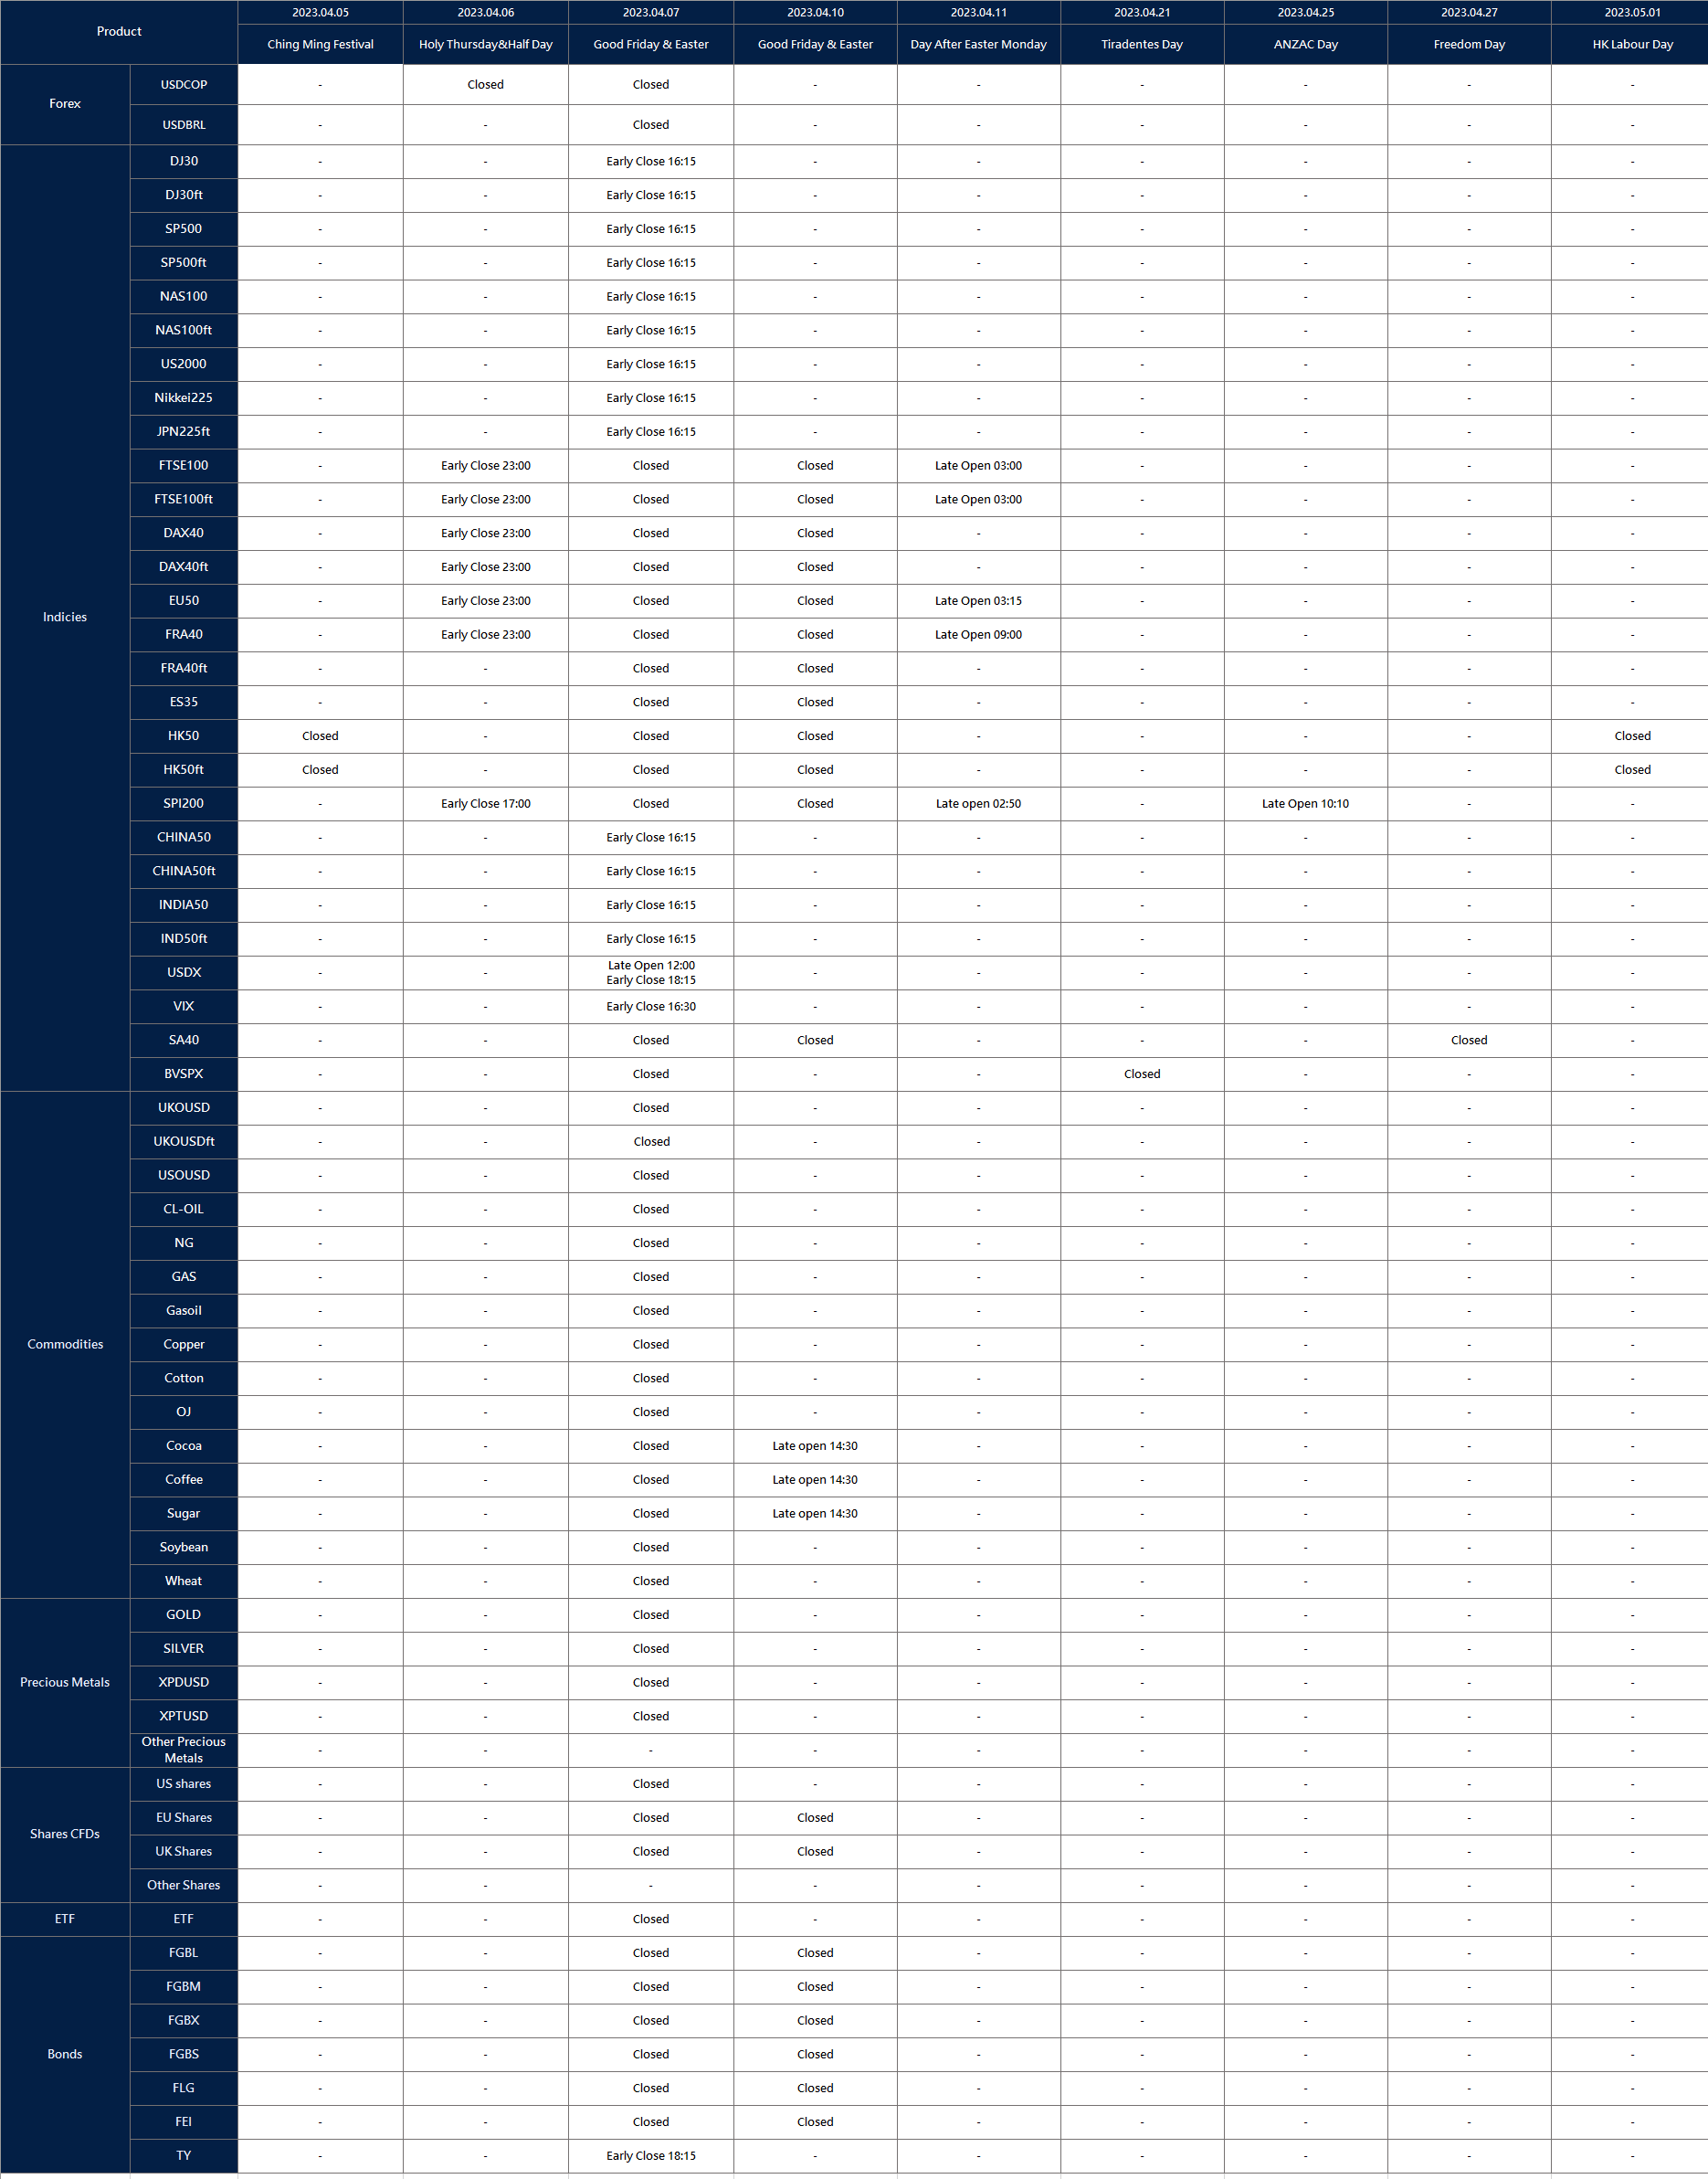
Changes in trading hours for upcoming holidays – April 03, 2023

Dear Client,

Please note that the following instruments’ trading hours will be affected by the upcoming holidays.

Note: The dash sign (-) indicates normal trading hours.

The above data is for reference only, please refer to the MT4/MT5 software for specific data.

If you’d like more information, please don’t hesitate to contact [email protected].

US Technology Shares Rally as Inflation Concerns Ease

US technology shares have continued to rally this week as concerns over inflation have eased following a modest increase in the Fed’s preferred measure of inflation in February. The rise in tech shares coincided with a rise in Treasury prices, which saw the two-year yield fall to around 4.05% while the 10-year maturity dipped to 3.48%. In addition, the US dollar gained strength against major currencies.

The personal consumption expenditures price index, which excludes food and energy, rose by 0.3% in February, slightly below the median estimate. However, the overall PCE price index rose by 5% from a year earlier, which is still above the Fed’s 2% target but down from January’s figures.

In the benchmark, the S&P 500 surged by 1.4% on the day, resulting in a weekly gain of 3.5%, the largest since November. The tech-heavy Nasdaq 100 also increased by 1.7%, enabling it to achieve its highest quarterly gain since June 2020.

All sectors in the S&P 500 stayed in positive territory, with Communication Services, Real Estate, and Consumer Discretionary getting the best performance among all groups, rallying by more than 2% on Friday.

Main Pairs Movement

On Friday, the US dollar strengthened due to slower growth in US consumer spending, leading to hopes that the Federal Reserve will not aggressively increase interest rates. The DXY index gained momentum after positive inflation data and closed at a daily high of 102.59.

Meanwhile, the EURUSD pair weakened and dropped below 1.0900 due to weaker Eurozone inflation numbers, while the US Core PCE Price Index was upbeat, putting pressure on the euro. The GBPUSD also slid by 0.4% on Friday, closing at 1.2329.

Despite the positive US PCE price index report, gold prices fell by 0.56% on Friday. The XAUUSD pair dropped sharply during the American trading session and closed at $1969 by the end of the day.

Technical Analysis

EURUSD (4-Hour Chart)

On Friday, the EUR/USD pair initially dropped to the 1.0870 area following the release of upbeat US Core Consumer inflation data, but later regained some traction and is currently trading at 1.0895 with a 0.08% daily loss. The pair remains in negative territory due to the overall strength of the US Dollar but has rebounded slightly as the greenback trimmed its intraday gains ahead of the US session.

In terms of economic data, the US Personal Consumption Expenditures (PCE) Price Index declined to 5% every year in February, and the annual Core PCE Price Index, which is the Federal Reserve’s preferred inflation gauge, also edged lower to 4.6%. This has fueled speculation that the Fed may pause its rate-hiking cycle in response to the recent turmoil in the banking sector, which has further boosted the US Dollar. Meanwhile, the Eurozone’s Harmonized Index of Consumer Prices (HICP) declined to 6.9% every year in March, but this data was largely ignored by investors.

From a technical perspective, the RSI indicator currently sits at 38, suggesting a loss of bullish momentum as it drops below the mid-line. The Bollinger Bands also indicate downside momentum, with the price falling toward the moving average, indicating that the downside trend may persist. In conclusion, as long as the 1.0874 resistance line holds, the market is likely to remain bearish. A four-hour close below 1.0800 could attract more sellers and push the pair lower to 1.0749.

Resistance: 1.0824, 1.0874

Support: 1.0780, 1.0748

XAUUSD (4-Hour Chart)

On Friday, the XAU/USD pair initially rose to a daily high of around 1,987 level after the release of lower-than-expected Core Personal Consumption Expenditure – Price Index (PCE) data from the US. However, during the US trading session, the pair retreated slightly and is currently trading at 1,976, indicating a 0.19% loss daily. The preliminary PCE price index data showed a slight decline to 4.6% YoY in February, indicating a slow fall in US consumer inflation and raising the possibility that the Fed will not take any action at its May meeting. However, the Fed officials’ statement that more work needs to be done to bring down inflation could act as a headwind for the precious metal Gold. The Fed Funds Future Curve, a market gauge of future Fed policy moves, is currently showing a 58% probability of a 0.25% hike in May versus a 42% probability of no change.

In terms of technical analysis, the RSI indicator is currently at 41, suggesting a bearish bias in the short-term outlook as the RSI is declining towards the mid-line. As for the Bollinger Bands, the price remained under selling pressure and moved lower, indicating the possibility of further downside movements. Overall, the market is expected to be slightly bearish as long as the resistance line at 1,999 holds. If the price move above this resistance level in the four-hour timeframe, it could pave the way for additional gains.

Resistance: 1975, 1988

Support: 1956, 1937

Economic Data

CurrencyDataTime (GMT + 8)Forecast
AUDRetail Sales (MoM)09:300.2%
CNYCaixin Manufacturing PMI (Mar)09:4551.7
EURGerman Manufacturing PMI (Mar)15:5544.4
GBPManufacturing PMI (Mar)16:3048.0
USDISM Manufacturing PMI (Mar)22:0047.5

Market Focus: All eyes on US Jobs Data and RBA Rate Statement

This week marks the start of the second quarter of 2023, and it’s lined up with some major economic events. Keep your eyes on news from the Reserve Bank of Australia and the Reserve Bank of New Zealand on their imminent interest rate announcements. Also, the eagerly-anticipated US jobs report is set to be released this week. It’s a big week all around, with headlines and developments that you won’t want to miss. 

Here are key events to watch out for:

Switzerland Consumer Price Index | 3 April 2023 

Switzerland CPI increased by 0.70% in February 2023 from the previous month.

For March, analysts expect the reading to increase by 0.5%.

US ISM Manufacturing PMI | 3 April 2023 

The US ISM Manufacturing PMI edged higher to 47.7 in February 2023 from 47.4 in January.

For March, analysts expect it to increase to 49.

Reserve Bank of Australia Rate Statement | 4 April 2023 

RBA raised its cash rate by 25bps to 3.60% at its March 2023 meeting, the tenth rate hike since May last year.

Analysts expect the central bank to raise another 25bps to 3.85% at this month’s meeting. 

Reserve Bank of New Zealand Rate Statement | 5 April 2023 

RBNZ raised its official cash rate during its first meeting of the year by 50bps to 4.75%, the highest since January 2009.

For this month, analysts expect RBNZ to increase its interest rates by 25bps to 5%. 

US ADP Non-farm Employment Change | 5 April 2023 

US private businesses unexpectedly created 242,000 jobs in February 2023, well above an upwardly revised 119,000 in January.

For March 2023, analysts expect that ADP Non-Farm Employment Change will add 200,000 jobs.  

US ISM Services PMI | 5 April 2023 

The US ISM Services PMI was at 55.1 in February 2023, slightly lower from 55.2 in January.

For March, analysts expect the index to be at 54. 

Canada Employment Change | 6 April 2023 

The Canadian economy created 21,800 jobs in February 2023, while the unemployment rate stood at 5%. This was close to the record-low of 4.9% observed in June and July 2022.

For March 2023, analysts expect that Canada will add 10,000 jobs, while the unemployment rate is expected at 5.4%

US Employment Change | 7 April 2023 

The US economy unexpectedly created 311,000 jobs in February 2023, following a downwardly revised 504,000 in January. The country’s unemployment rate edged up to 3.6% in February 2023, up from a 50-year low of 3.4% seen in January 2023.

For March 2023, analysts expect the US to add 240,000 jobs, while the unemployment rate will remain at 3.6%.

Federal Reserve Officials Suggest Monetary Tightening, Markets Respond Positively

Recent market gains were heavily influenced by statements from Federal Reserve officials who suggested the need for further monetary tightening, despite recent bank failures. Boston Fed President, Susan Collins, highlighted the importance of tightening policies. Meanwhile, Richmond Fed President, Thomas Barkin, stated that the Fed could increase rates further if inflation risks persist. Minneapolis Fed President, Neel Kashkari, expressed his commitment to bringing inflation back to 2% but also acknowledged that the impact of recent financial-system turmoil is not fully clear.

While some investors anticipated a decrease in US interest rates by around 70 basis points to 4.3% by year-end, some strategists disagree with the market’s expectations of rate cuts this year. Despite financials being under pressure, the S&P 500 benchmark gained 0.6%. The tech-heavy Nasdaq 100 also rose 0.9%, pushing further into a bull market. Ten out of eleven sectors in the S&P 500 remained in positive territory, with the Real Estate sector achieving the best performance among all groups, rising 1.22% for the day. Additionally, the Dow Jones Industrial Average rose 0.4%, while the MSCI world index rallied by 1.2% daily on Thursday.

Main Pairs Movement

The US Dollar experienced a 0.46% daily loss due to data on Thursday showing a moderate increase in Americans filing new claims for unemployment benefits. However, there were no significant signs that tightening credit conditions were impacting the tight US labor market. The DXY index remained weak for the day, with heavy selling during the UK trading session, closing at 102.17 level at the end of the day.

On the other hand, the euro rose to a one-week high against the US dollar on Thursday, boosted by German inflation data and a decrease in concerns over the banking sector. The EURUSD surged by 0.56% on Thursday, reaching the weekly high of 1.0926 level ahead of the American trading hour, and closed at 1.0905 level. Additionally, the GBPUSD also experienced a 0.58% daily gain.

Gold witnessed a significant rally on Thursday, experiencing an 0.80% daily gain and reversing the previous week’s loss ahead of key inflation data from the United States and Eurozone. The XAUUSD saw demand during American trading hours and touched the weekly high of the $1984 mark.

Technical Analysis

EURUSD (4-Hour Chart)

The EUR/USD pair advanced higher on Thursday, extending its daily rally to a daily high around the 1.0920 area but then surrendered some of its daily gains amid the risk-positive market environment. The pair is now trading at 1.09031, posting a 0.55% gain daily. EUR/USD stays in the positive territory amid the weaker US Dollar across the board, as the greenback continued to fall after the US Bureau of Labor Statistics (BLS) revealed unemployment claims. The US Weekly Initial Jobless Claims rise to 198K, coming in worse than the market expectation of 196K. The higher-than-expected Initial Jobless Claims and lower-than-forecast Gross Domestic Product suggest the labor market may be weakening and could encourage the Fed to pause and not hike rates at their next meeting, which exerted bearish pressure on the US Dollar. In the Eurozone, the Euro hits fresh highs following the easing Eurozone inflation data, as the data released on Thursday showed that inflation in Germany, the Consumer Price Index (CPI), declined to 7.4% YoY in March.

For the technical aspect, RSI indicator 68 figures as of writing, suggesting that the pair could witness some short-term corrections as the RSI retreated slightly from the overbought zone. As for the Bollinger Bands, the price dropped after touching the upper band, therefore some downside movements can be expected. In conclusion, we think the market will be slightly bearish as long as the 1.0915 resistance line holds. An upward extension could be expected if the pair break above the 1.0915 level.

Resistance: 1.0915, 1.0990

Support: 1.0831, 1.0748

XAUUSD (4-Hour Chart)

As higher-than-expected Initial Jobless Claims and lower-than-forecast Gross Domestic Product suggest the US Federal Reserve may pause its rate-hiking agenda on Thursday, the pair XAU/USD witnessed fresh buying and advanced sharply to refresh its daily high above the 1,980 mark during the US trading session. The Gold price is trading at 1,982 at the time of writing, rising 0.91% daily. Despite Fed Chairman Jerome Powell saying privately that the Federal Reserve expects one more rate hike this year but markets disagree, as investors estimated that the US Federal Reserve would not hike rates at the May meeting with chances of a 0.25% hike falling slightly to 44%. Meanwhile, demand for safe-haven assets remains subdued as easing concerns about the banking sector’s health underpin the market mood, which further undermined the US Dollar and lifted the Gold price higher. On top of that, the Fed’s preferred gauge for inflation, the US Core Personal Expenditures – Price Index (PCE) for February, will be revealed on Friday.

For the technical aspect, the RSI indicator is 60 figures as of writing, suggesting the bearish tilt in the short-term technical outlook as the RSI has retreated slightly from 60. As for the Bollinger Bands, the price failed to extend the upside traction and edged lower, therefore some downside movements can be expected. In conclusion, we think the market will be slightly bearish as long as the 1,988 resistance line holds. However, technical indicators remain near overbought readings with uneven directional strength, still supporting the bullish bias.

Resistance: 1988, 2003

Support: 1969, 1952

Economic Data

CurrencyDataTime (GMT + 8)Forecast
CNYManufacturing PMI (Mar)09:3051.5
GBPGDP (QoQ) (Q4)14:000.0%
GBPGDP (YoY) (Q4)14:000.4%
EURGerman Unemployment Change (Mar)15:553K
EURCPI (YoY) (Mar)17:007.1%
USDCore PCE Price Index (MoM) (Feb)20:300.4%
CADGDP (MoM) (Jan)20:300.3%
EURECB President Lagarde Speaks23:00 

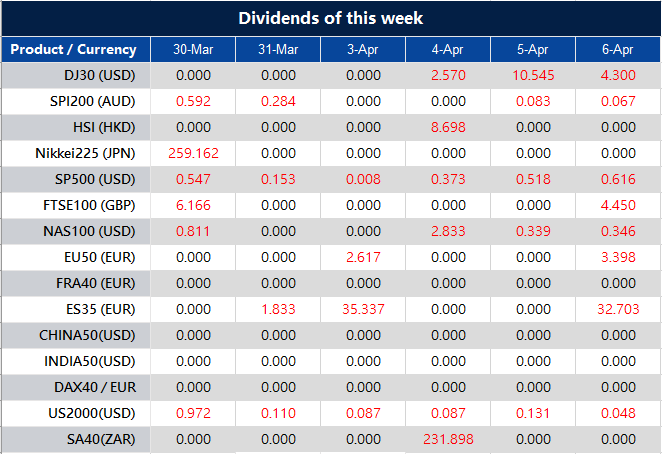
Weekly Dividend Adjustment Notice – March 30, 2023

Dear Client,

Please note that the dividends of the following products will be adjusted accordingly. Index dividends will be executed separately through a balance statement directly to your trading account, and the comment will be in the following format “Div & Product Name & Net Volume ”.

Please refer to the table below for more details:

The above data is for reference only, please refer to the MT4/MT5 software for specific data.

If you’d like more information, please don’t hesitate to contact [email protected]

US Stock Markets Make Gains as Tech and Financial Shares Rally

US stock markets experienced gains on Wednesday, with tech and financial shares leading the way, as investor risk appetite recovered from recent banking sector turmoil. The financial sector was hit hard by the collapse of three US banks this month but managed to rally on Wednesday, despite reports that the Federal Deposit Insurance Corp. was considering tightening the squeeze on larger banks to help cover the almost $23bn in costs from the bank failures.

In the benchmark, the tech-heavy Nasdaq 100 entered a bull market, rising 20% from a December low. This was an impressive feat, given the recent banking sector turmoil. The S&P500 climbed back above 4,000 with 1.42% daily gain on Wednesday, and all eleven sectors stayed in positive territory, showing that the market regained recovery strength.

The Real Estate and Information Technology sectors performed the best among all groups, rallying with more than a 2% gain daily. This is a significant development, as Wall Street analysts have found it challenging to predict how the stock market will react in the coming months, given the uncertainties surrounding the Fed’s future actions. Their average year-end goal for the S&P 500 has remained constant at 4,050 for three straight months, a phenomenon not seen since 2005.

The Dow Jones Industrial Average rose 1%, and the MSCI world index edged higher with a 0.2% gain for the day. This indicates that investor sentiment is gradually recovering, despite the recent banking sector turmoil.

Main Pairs Movement

On Wednesday, the US dollar showed some signs of recovery as it gained ground against most of its major counterparts. The DXY index rose 0.22% to 102.67, rebounding from a near seven-week low of 101.91 seen last week. Meanwhile, the Japanese yen was particularly volatile as Japan’s fiscal year-end drew near.

The EURUSD was little changed on Wednesday, as ECB rate-setters continued to talk about the need to raise interest rates further, offering support to the Euro. However, the pair slid sharply following touching the daily high of 1.0872 level during the UK trading session, and closed at 1.0844 for the day. On the other hand, the GBPUSD lost upside traction after reaching the daily high of 1.2361 level, and closed at 1.2312 level, experiencing a 0.23% daily loss.

The Gold traded slightly lower at $1,965 per troy ounce as financial markets remained optimistic despite concerns about the banking sector. Additionally, the macroeconomic calendar remained quiet for the third consecutive day, leaving little to motivate speculative interest and making room for some appreciation of the US Dollar. The XAUUSD dropped dramatically during Asian trading session but then hovered in a range from $1961 to $1969 marks during US trading hours.

Technical Analysis

EURUSD (4-Hour Chart)

Based on the early trading session on Wednesday, the EURUSD price has been fluctuating within a narrow range of around 1.0850. However, after the release of the unexpected rising of US data Pending Home Sales (MoM) in February, the EURUSD dropped to 1.0830, which is close to the previous low on Tuesday at 1.08177. The macroeconomic calendar has been sparse in terms of data releases. The European Central Bank had a non-monetary policy meeting, which ended without any statement as usual. ECB officials have been supporting the case of further rate hikes, but there are different views on the banking situation.

Looking at the 4-hour chart, it appears that the bulls are still in control. Technical indicators are above their midlines with modest upward slopes, and the pair is comfortably consolidating above its moving averages, with the 20 Simple Moving Average (SMA) around 1.0800. A test of the Fibonacci support level is possible if there is a definite downward extension below the 20 SMA, although further losses are unlikely in the immediate future.

Resistance levels: 1.0903, 1.0990

Support levels: 1.0748, 1.0669

XAUUSD (4-Hour Chart)

The precious metals market has seen some consolidation this week after significant gains since the start of March. The price of gold (XAU/USD) rose above $1,950 and peaked around the $2,000 resistance level, while the silver price (XAG/USD) has been showing a steady uptrend and is currently trading above $23 with more room for growth before reaching its year-to-date high in January. As of typing this, the gold price is trading at $1,963 with an RSI of 59.83. Gold trading has been volatile in the past two weeks due to events such as banking bankruptcies and high-stakes central bank meetings. However, investors are now looking forward to the next Federal Reserve meeting in May and keeping an eye on the upcoming US Personal Consumption Expenditures Price Index release on Friday and the Chinese Purchasing Managers Index releases.

Although gold is still below its record highs, it has started a short-term consolidation period. According to economists at Credit Suisse, a sustained move above $2,000 is necessary to reinvigorate upward pressure. If gold fails to defend its 55-day moving average, there could be further weakness toward the recent range low at $1,805 before reaching the crucial 200-day moving average.

Resistance: 1980, 2003

Support: 1934, 1914

Economic Data

CurrencyDataTime (GMT + 8)Forecast
GBPBOE Inflation LetterTBDN/A
EURGerman CPI (YoY) (Mar)20:007.3%
USDGDP (QoQ) (Q4)20:302.7%
USDInitial Jobless Claims20:30196K

US Equity Market Falls as Tech Stocks Decline and Investors Anticipate Inflation Data

On Tuesday, the US equity market took a slight hit as investors reassessed their bets on the Federal Reserve’s interest rate policies. The three-day advance of US stocks came to a halt as technology shares declined, while Treasuries saw a slight dip.

Investors have been favoring tech stocks in recent weeks, moving away from financials following the collapse of three US banks. However, this trend has begun to reverse as there is increasing speculation that turbulence in the banking sector will be contained.

As investors gear up for a slew of data on the American economy this week, including the central bank’s preferred measure of inflation, the data is expected to play a role in the Fed’s upcoming rate decision.

In the benchmark, the Nasdaq 100 slumped 0.5%, paring a March advance to 4.7%. Tech stalwarts such as Apple Inc. and Alphabet Inc. were among the biggest drags. The S&P500 fell 0.2%, with six out of eleven sectors staying in negative territory. The communication service dropped 1.02%, performing the worst among all groups. Meanwhile, the Dow Jones Industrial Average fell 0.1%, and the MSCI world index fell 0.1% on Tuesday.

Main Pairs Movement

The US Dollar saw daily losses of 0.42% on Tuesday as easing worries about a banking crisis led investors to favor riskier currencies. The DXY index was heavily sold throughout the day, closing at the 102.43 level by the end of the day.

Daily, the EURUSD saw a 0.44% gain, reaching a four-day high near 1.0850. The positive traction was triggered by the broadly weak greenback, and the pair closed at the 1.084 level. Investors have rising expectations for an unchanged Fed policy, which has helped to support the EURUSD.

The weakness of the US Dollar acted as a tailwind for the GBPUSD on Tuesday. The pair rose 0.45% daily for the day, benefiting from the broader weakness of the greenback.

Gold prices surged with a 0.86% daily gain on Tuesday, trading near a daily high of $1,970.03 per troy ounce. The weakness of the US Dollar supported the XAU/USD pair, which trimmed half of its losses from Monday. However, a better market mood subdued demand for the bright metal. The pair managed to rebound from a daily low of $1950 mark to the $1970 mark in the second half of Tuesday.

Technical Analysis

EURUSD (4-Hour Chart)

On Tuesday, the EUR/USD pair continued its upward trend, hitting a daily high of 1.0840 before the opening of Wall Street. The market’s optimism is fueled by receding concerns about the banking sector’s health, which is benefiting the Euro and high-yielding assets in general. Asian shares ended a two-day losing streak and closed in the green, helping European and American futures stay afloat. Although Treasury yields rose, the US Dollar weakened. The rise in yields can be attributed to falling bond prices in a risk-on scenario. While the Eurozone did not release any significant macroeconomic figures, the United States released the preliminary estimate of the February Goods Trade Balance, which showed a deficit of $91.6 billion, worse than expected, and Wholesale Inventories for the same period, up a modest 0.2% MoM.

Charts EURUSD by TradingView

The EUR/USD pair has seen two consecutive days of gains, with a steady recovery since it hit 1.0750 on Monday. Buyers are protecting the pair’s downside at around 1.0745, with the 61.8% Fibonacci retracement of the 2022 yearly decline. In the daily chart, the pair is above bullish moving averages, with the 20 Simple Moving Average extending its bullish slope above and also the bullish 100 SMA. Technical indicators are heading north within positive levels and flirting with two-month highs. According to the 4-hour chart, there is an increased chance of upward momentum as the pair has recovered above a mildly bearish 20 SMA, and the 100 SMA has crossed above the 200 SMA.

Resistance levels: 1.0903, 1.0990

Support levels: 1.0784, 1.0669

XAUUSD (4-Hour Chart)

The Russian central bank recently announced that it purchased 1 million ounces of Gold, which has provided support to the domestic Gold industry. However, Commerzbank strategists do not expect the bank to continue purchasing Gold due to the limited success of re-routing exports to Asia compared to Crude Oil. Additionally, the largest buyers of Gold in Russia, the banks, have been affected by sanctions imposed by the West. Despite the increase in Gold reserves, the Gold price remains volatile due to uncertainty over future interest rates. The 10-year US T-bond yield holding above 3.5% has limited the upside for Gold. On Tuesday, Gold settled around $1,950 in a quiet start to trading but gained traction and turned positive, reaching $1,960 amid selling pressure surrounding the US Dollar. The Gold price is expected to be supported in the long term due to the pressure on central banks to fight inflation and avoid a replay of the 1970s. However, short-term movements will be determined by developments in growth and inflation.

Charts XAUUSD by TradingView

Technically, the Gold price appears to be exhibiting a measured move pattern resembling a zig-zag pattern consisting of three waves, starting from the $2,003 highs. In this pattern, waves 1 and 3 typically have the same length or a Fibonacci ratio. This suggests that XAU/USD may decline towards the support level at the $1,934 March 22 lows, which could also function as the neckline for a bearish double-top pattern.

Resistance: 1980, 2003

Support: 1934, 1914

Economic Data

CurrencyDataTime (GMT + 8)Forecast
USDPending Home Sales (MoM) (Feb)22:00-2.3%
USDCrude Oil Inventories22:300.187M

US Stocks Get Boost from Financial Shares as Tech Slumps: Banking Sector Continues to be Monitored

Financial stocks provided a much-needed boost to US stocks on Monday, with Treasuries retracting due to a decrease in concerns over banking turmoil. However, tech shares took a hit after experiencing a surge in the previous week. The purchase of Silicon Valley Bank by First Citizens BancShares Inc. caused a gauge of regional lenders to increase by approximately 2.5%, which, in turn, led to First Republic Bank experiencing a jump. The Bloomberg report about US authorities considering expanding an emergency lending facility also contributed to this surge. Despite the weekend bringing some relief to the banking sector, it will continue to be closely monitored, as a gauge of regional US banks has lost approximately 30% since early February.

The S&P 500 index saw a rise, with financial firms increasing by over 1%, and energy producers also making gains. On the other hand, the Nasdaq 100 ended 0.7% lower, capping a two-week advance. The two-year Treasury yield surpassed 4%. Eight out of eleven of the S&P500 stayed in positive territory, with the Energy and Financial sectors rallying by 2.1% and 1.4% respectively, on a daily basis.

Main Pairs Movement

On Monday, efforts by authorities to ease concerns about the global banking system helped calm investor nerves, resulting in the dollar reaching a five-day high against the Japanese yen. However, the DXY index remained within a narrow range against most major currencies as investors appeared hesitant to place big wagers in either direction. This hesitation was due to their need for clarity on the fallout from the recent collapse of two U.S. lenders and the rescue of Credit Suisse.

GBPUSD gained 0.44% for the day due to market positioning suggesting a 50% chance the Bank of England (BOE) will hold rates steady, and a 70% chance the US Federal Reserve will do the same at their respective next policy meetings. Meanwhile, EURUSD remained on an upside tendency all day and closed with a 0.35% daily gain on Monday.

Gold experienced a 1.09% daily loss due to investors moving away from safe-haven assets. Despite this, the sentiment was positive at the start of the week amid easing concerns related to a global banking crisis. XAUUSD faced heavy selling pressure during the UK trading session but managed to rebound from a daily low level of the $1944 mark to close at the $1956 mark.

Technical Analysis

EURUSD (4-Hour Chart)

The EUR/USD pair saw a slight increase on Monday, moving within a tight range and rebounding toward the 1.0780 area. It is currently trading at 1.0782, with a daily gain of 0.22%. The weaker US Dollar across the board and the US government’s additional support to the local financial system helped the market sentiment recover and kept the EUR/USD pair in positive territory. The news related to financial stability also provided some temporary relief to markets on Monday. In the Eurozone, the Business Climate in Germany improved to 93.3 for March, according to the IFO Institute.

From a technical aspect, the RSI indicator is currently at 58, indicating that the bulls are gaining strength as the RSI heads north after bouncing around its midline. As for the Bollinger Bands, the price has witnessed some buying interest and rose towards the moving average, suggesting that some upside movements can be expected. We believe that the market will remain bullish as long as the 1.0748 support line holds, and technical indicators also remain within positive levels.

Resistance: 1.0834, 1.0903

Support: 1.0748, 1.0669

XAUUSD (4-Hour Chart)

On Monday, as easing bank stress lessened Gold’s safe-haven appeal, along with reports of falling demand from India, the XAU/USD pair saw heavy selling pressure and dropped sharply to a daily low below the 1,948 mark during the US trading session. The Gold price is currently trading at 1,958, losing 1.06% daily. The acquisition of Silicon Valley Bank (SVB) by First Citizens Bancshares Inc has limited the damage from SVB’s failure, reducing global banking fears and translating into a rise in US Treasury bond yields. This exerted bearish pressure on the Gold price and lessened demand for safe-haven Gold. This week’s economic calendar highlights await on Friday with Chinese PMIs and the US Personal Consumption Expenditures (PCE) Price Index.

From a technical aspect, the RSI indicator is currently at 48, suggesting the bullish tilt in the short-term technical outlook as the RSI has rebounded sharply towards the mid-line. As for the Bollinger Bands, the price regained some upside traction and rebounded higher, indicating that some upside movements can be expected. We believe that the market will be slightly bullish as long as the $1,934 support line holds. The rising RSI indicator also reflects bull signals.

Resistance: 1980, 2003

Support: 1934, 1914

Economic Data

CurrencyDataTime (GMT + 8)Forecast
GBPBoE Gov Bailey Speaks16:45 
BRLBCB Copom Meeting Minutes19:00 
EURECB President Lagarde Speaks21:15 
USDCB Consumer Confidence (Mar)22:00101.0

US Stock Market Gains Amid Financial Stability Assurances and Rate Cut Speculation

The US stock market closed higher on Friday after regulators assured investors of financial stability, while speculation grew that policymakers will have to consider a rate cut to prevent a recession. Amid concerns over the recent failure of some US regional lenders and the near-collapse of banking giant Credit Suisse Group AG, global authorities have been trying to instill calm in financial markets. Despite some banks coming under stress, top US regulators confirmed that the overall financial system remains sound.

Market participants reacted to the reassurance by abandoning wagers that the Fed will raise interest rates in May and added to bets that its next shift will be a rate cut as early as June. However, Fed Chair Jerome Powell stated that cuts are not his “base case.” Similarly, traders no longer price in additional quarter-point rate hikes for the ECB and the Bank of England. The move came as global bonds rallied, with Treasury two-year yields falling to the lowest level since September.

The benchmark S&P500 index rallied with a 0.56% daily gain following a slide that reached 1% in the first hour of trading. Nine out of eleven sectors of the S&P500 remained in the positive territory, showing promising signs of economic recovery. However, the financial sector failed to stay in the positive territory, as First Republic Bank tumbled once again, extending this year’s rout to 90%.

On the other hand, the Nasdaq 100 rose 0.3%, while the Dow Jones Industrial Average moved upward by 0.4%. Nonetheless, the MSCI world index slid by 0.2% on Friday, indicating a mixed performance across global markets.

Main Pairs Movement

The US dollar saw a 0.57% surge on Friday, despite speculation that the Fed may end its rate-hiking cycle earlier than previously expected. This was due in part to Fed Chair Jerome Powell indicating that such a move was under consideration by central bank policymakers last week. The DXY index witnessed significant trading activity during the European trading session, reaching a daily high of 103.36 before losing bullish momentum and closing at 103.12.

The EURUSD pair experienced a daily loss of 0.66% on Friday, despite hawkish talks from the European Central Bank (ECB). The pair fell sharply during the European trading session, then managed to rebound from a daily low of 1.0713 to 1.0759 in the American trading hour.

The GBPUSD pair slid 0.44% on Friday, closing at 1.2229. The drop in value may have been influenced by market uncertainty and volatility.

Gold prices saw a daily loss of 0.76% on Friday due to the strength of the US dollar. The XAUUSD witnessed heavy selling pressure during the American trading session, falling below the $1970 mark and struggling to stay around the $1975 mark.

Technical Analysis

EURUSD (4-Hour Chart)

On Friday, the EUR/USD currency pair experienced a significant decline, dropping to a four-day low below the 1.0730 mark during the European session. This was due to a risk-averse market environment, with concerns over a potential banking crisis and unimpressive PMI data releases from the Eurozone and the United Kingdom. The pair is currently trading at 1.0757, posting a 0.65% loss on a daily basis.

The US Dollar has been stronger across the board, supported by the upbeat PMI data releases from the US, which indicated an acceleration of output to the fastest since May of last year. This has boosted the safe-haven US Dollar and undermined the EUR/USD pair.

The RSI indicator currently stands at 45, suggesting that the downside is more favored, as the RSI stays below the mid-line. The Bollinger Bands also indicate a continuation of the downside trend.

Overall, it is expected that the market will be bearish, as the pair tests the 1.0735 support level. If this level is broken, the downward correction could extend toward 1.0621.

Resistance: 1.0834, 1.0903

Support: 1.0735, 1.0621

XAUUSD (4-Hour Chart)

The XAU/USD pair climbed above the $2,000 mark in the early American session on Friday but struggled to maintain its position and reversed its direction towards the $1,990 area during the US trading session. The Gold price is currently trading at $1,995, rising 0.09% on a daily basis. The stalling in Gold’s intraday rally was mainly due to pressure from a strengthening US Dollar, which was supported by a sharp fall in the equity markets and disappointing manufacturing PMIs from the Eurozone and the UK, reviving worries about looming recession risks and lifting demand for the safe-haven US Dollar.

However, the Federal Reserve’s hints of a pause to interest rate hikes could act as a headwind for the greenback and provide some support to the Gold price.

For the technical aspect, the RSI indicator currently stands at 53, suggesting a bearish tilt in the short-term technical outlook. The Bollinger Bands also indicate some downside movements can be expected.

Overall, it is expected that the market will be slightly bearish as long as the $1,989 resistance line holds. A new bull trend might be starting if the pair breaks above the $1,989 resistance.

Resistance: $1,989, $2010

Support: $1,968, $1,933
Week ahead: Markets to Focus on German Prelim CPI and US Core PCE Price Index

As the first quarter of 2023 draws to a close, many countries are gearing up to release some major economic data. The US is scheduled to publish its Consumer Confidence (CPI) and Core PCE Price Index reports, while Australia and Germany will be releasing their CPI data. With investors and traders globally eagerly waiting for these reports, you can expect some serious market movements. 

Here are key events to watch out for:

CB Consumer Confidence | US (March 28)

The US CB Consumer Confidence fell to 102.9 in February 2023.

Analysts anticipate it to drop further to 101 in March 2023.

Consumer Price Index (CPI) | Australia (March 29)

Australia’s monthly CPI rose 7.4% in January 2023, but still lower than the 8.4%  rise for the year to December 2022, signifying stubborn high inflation. 

For February 2023, analysts expect it to increase by 7.6%.

Prelim Consumer Price Index (CPI) | Germany (March 30) 

The CPI in Germany increased 0.8% in February 2023, easing from a 1% rise in the previous month.

For March 2023, analysts expect the index to increase by 1.5%.

Gross Domestic Product (GDP)  | Canada (March 31) 

Canada’s GDP shrank by 0.1% in December 2022, following a 0.1% increase in November 2022. Analysts expect the Canadian economy to increase by 0.3% in January 2023.

Core PCE Price Index | US (March 31)

Core PCE prices in the US, which exclude food and energy, jumped by 0.6% month-on-month in January 2023, the most since August, following an upwardly revised 0.4% increase in the previous month.

For February, analysts expect the index to increase by 0.6%.

Back To Top
server

Hai 👋

Bagaimana saya boleh membantu?

Segera berbual dengan pasukan kami

Chat Langsung

Mulakan perbualan secara langsung melalui...

  • Telegram
    hold Ditangguh
  • Akan datang...

Hai 👋

Bagaimana saya boleh membantu?

telegram

Imbas kod QR dengan telefon pintar anda untuk mula berbual dengan kami, atau klik di sini.

Tidak ada aplikasi Telegram atau versi Desktop terpasang? Gunakan Web Telegram sebaliknya.

QR code