US Stocks Slide on Persistent Inflation Concerns and Hawkish Fed Tone

US stocks declined lower on Wednesday, witnessing some selling pressure, and dropped for a second straight session after economic data highlighted persistent inflationary pressures and Federal Reserve officials continued to sound hawkish. Data released in the US showed ISM Manufacturing PMI increases to 47.7 in February, which came in below the market expectation of 48.

The PMI report indicated that the economic activity in the US manufacturing sector continued to contract in February, providing some support to the US Dollar. Meanwhile, stock markets witnessed downside pressure as investors are still struggling to ignore fears of more rates from the Federal Reserve. Moreover, hawkish commentaries delivered by Fed policymakers also fueled US Treasury yields as Minneapolis Fed President Neel Kashkari reiterated on Wednesday that inflation in the US is still very high and that their job is to bring it down. The jump in the US Treasury bond yields suggests the market’s fears of inflation and recession, which in turn undermined the stock markets.

The benchmarks, S&P 500 and Dow Jones Industrial Average both declined lower on Wednesday as the S&P 500 closed the day at its lowest level in nearly six weeks as market sentiment remained fragile after Fed officials stay hawkish. The S&P 500 was down 0.5% daily and the Dow Jones Industrial Average meanwhile was little changed for the day. Eight out of eleven sectors in the S&P 500 stayed in negative territory as the utility sector and the Real Estate sector is the worst performing among all groups, losing 1.72% and 1.49%, respectively. The Nasdaq 100 meanwhile dropped the most with a 0.9% loss on Wednesday and the MSCI World index was down 0.3% for the day.

Main Pairs Movement

DXY was lower across the board after the release of China’s manufacturing PMI last month, the highest in over a decade. Price fell 0.45% to 104.40 in late trading  New York session on Wednesday. The ISM Manufacturing Index edged up to 47.7 last month, the first increase in six months, but remains in contractionary territory. At the time of writing, the price traded at 104.385.

WTI bulls are in the market amid signs of stronger demand in Asia and Europe. Fundamentally, US commercial crude oil inventories gained less than expected last week, rising only 1,166kbbl. However, US exports of crude hit a record high of 5,629kbbl last week (+22.4% w/w). At the time of writing, the price traded at 77.764.

The Dow Jones Industrial Average rose 5.14 points, or 0.02%, to 32,661.84, the S&P 500 lost 18.76 points, or 0.47%, to 3,951.39 and the Nasdaq Composite dropped 76.06 points, or 0.66%, to 11,379.48.

Technical Analysis

EURUSD (4-Hour Chart)

The EURUSD trimmed gains but held above the critical short-term support level following the release of the ISM Manufacturing PMI, which boosted the US Dollar across the board. Data released in the US showed activity in the Manufacturing sector contracted again in February with the ISM PMI rising from 47.4 to 47.7 (below 50 marks contraction), against a market consensus of 48. The inflation indicators of the ISM report pushed Treasury yields to the upside. The US 10-year bond yield reached 4% for the first time since November. In the Eurozone, the preliminary estimate of the German Harmonized Index of Consumer Prices (HICP) rose at an annualized pace of  9.3% in February, hotter than the previous 9.2% and the 9% anticipated by market players. The news pushed the Euro further up, meaning the ECB could take an even more aggressive stance.

From a technical perspective, the four-hour RSI indicator rallied dramatically to 60 figures as of writing, suggesting that the pair was surrounded by strong bullish momentum. As for the Bollinger Bands, the pair was pricing around the upper band and the size between the upper and lower bands get larger, showing the pair was amid strong positive traction and more favored to the upside path.

Resistance: 1.0788, 1.0929

Support: 1.0508, 1.0400

XAUUSD (4-Hour Chart)

The XAUUSD extended its rally on Wednesday and tried to challenge the $1840 mark in the American trading session despite tepid US macroeconomic figures helping the greenback. Market participants have been moving away from the US Dollar these days amid positive news affecting its major rivals as well as some tepid data. Earlier, the US released the February ISM Manufacturing PMI, which resulted at 47.7, barely improving from the previous 47.4 and missing the expected 48. The survey further showed that “new order rates remain sluggish due to buyer and supplier disagreements regarding price levels and delivery lead times,” indicating persistent price pressures. The report triggered a run to safety, which benefited the safe-haven greenback, however, not for long. Apart from this, the 10-year Treasury note is currently at around 4.0%, and the 2-year note yield hovering near a 16-year high of 4.904%.

From the technical perspective, the four-hour scale RSI indicator edged higher further, showing the upside traction surrounding gold is still strong. As for the Bollinger Bands, the pair was continuing trading along with the upper band and the gap between the upper and lower bands get larger, indicating that the pair’s upside momentum would persist in the near term.

Resistance: 1850, 1870, 1900

Support: 1820, 1800

Economic Data

CurrencyDataTime (GMT + 8)Forecast
EURCPI (YoY) (Feb)18:008.20%
EURECB Publishes Account of Monetary Policy Meeting20:30 
USDInitial Jobless Claims21:30195K

Rising Rates Push Stocks Down in February

The Dow fell Tuesday, wrapping up February with a monthly loss as surging rates battered stocks after a string of data pointing to underlying strength in the economy forced investors to price in higher for longer Federal Reserve interest rates.

The Dow Jones Industrial Average fell 0.65%, or 214 points, taking losses for February to about 4%. The S&P 500 fell 0.29%, and the Nasdaq Composite was down 0.10%.

Tech, which is down about 5% from its peak earlier this month, pared earlier gains despite a jump in Meta. On the economic front, meanwhile, consumer confidence in February fell to its lowest reading since November, pointing to signs strong consumer spending, which has underpinned strong growth so far this year, may be starting to slow.

The yield on the benchmark 10-year Treasury note was last lower by 1 basis point at 3.912%. Earlier, it touched a high of 3.983%, its highest level since Nov. 10. Meanwhile, the yield on the 30-year Treasury bond rose less than 1 basis point to 3.922%. Tuesday marks the final day of trading in February. The 10-year Treasury yield has advanced more than 50 basis points for the month, and the 2-year yield has gained more than 70 basis points. Those gains come as traders increasingly bet on Federal Reserve rates staying higher for longer, as recent data points to persistent inflation. The core personal consumption expenditures price index rose 4.7% in January from the year-earlier period, beating expectations. The overall PCE index advanced 5.4% year over year, also more than expected.

Main Pairs Movement

DXY bulls flirt with the 105.00 hurdles during Wednesday’s sluggish Asian session, following a stellar rebound marked a few hours ago. In doing so, the US Dollar’s gauge versus the six major currencies portrays the market’s cautious mood as traders brace for the key data/events lined up during the all-important March month, comprising Federal Reserve Chairman Jerome Powell’s speech and Fed’s monetary policy meeting. At the time of writing, the price traded at 105.042.

West Texas Intermediate futures on NYMEX, have corrected firmly after facing firmer barricades above $77.50 in the late New York session. The oil price has dropped $76.60 and is expected to remain on the tenterhooks as investors are awaiting the release of the Caixin Manufacturing PMI data for fresh impetus. At the time of writing, the price is trading at 76.65.

The AUD/USD pair has slipped sharply to near 0.6700 as the Australian Bureau of Statistics has reported mixed Gross Domestic Product (GDP) (Q4) data. The GDP data landed at 0.5% in Q4, lower than the consensus of 0.8% and the Q3 figure of 0.6%. At the time of trading, the price traded at  0.6700.

Technical Analysis

EURUSD (4-Hour Chart)

The EURUSD lost bullish momentum and retreated below the 1.0600 level in the US trading session after touching a daily high of around 1.0650 level. The US Consumer Confidence Survey declined to 6.3% in February from 6.7% in January, however, failing to provide a robust boost for the pair. Now, the effects of rate hikes have not yet shown up because of the usual lags in their impact. This will change and price pressures will then ease noticeably as the year progresses. If this does not happen, and the Fed has not cooled demand sufficiently, then we can expect there will be more rate hikes than previously the market anticipated. In Eurozone, Spanish, and French inflation figures came in above market expectations in February, according to preliminary estimates. At the time being, speculative interest pricing in rate hikes will continue until early 2024, while the ECB’s terminal rate is currently seen at 4%.

From a technical perspective, the four-hour scale RSI indicator slid below the midline, suggesting that bearish momentum triggered by US data failed to sustain in the middle of the US trading hour and also showed that the pair currently have no clear moving path. As for the Bollinger Bands, the pair was capped by the upper band around the 1.0640 level and trading in the upper area, indicating the pair was more favored to hover in a range from 1.0580 to 1.0650.

Resistance: 1.0788, 1.0929

Support: 1.0508, 1.0400

XAUUSD (4-Hour Chart)

The XAUUSD recovered further on Tuesday and was trading around the $1830 mark as of writing, as the US Dollar turned south during the American trading hour. The greenback was hit by the Conference Board Consumer Confidence Index as it fell for a second consecutive month in February, printing at 102.9 against the 108.5 anticipated by market players. Moreover, the Expectations Index fell further to 69.7 from a downwardly revised 76.0 in January. A reading below 80 often signals a recession within the next year, according to the official report. Meanwhile, the US equity market was trading with a mixed tone, the Nasdaq held on to modest intraday gains, while the Dow Jones Industrial Average witnessed heavy selling transactions for a second consecutive day. Meanwhile, US government bond yields ticked north. Early news indicating increased inflationary pressures in Spain and France spurred speculation the European Central Bank (ECB) will maintain its monetary tightening policy until early 2024, while the terminal rate is now seen at 4%.

From a technical perspective, the four-hour scale RSI indicator surged to 58 figures, suggesting that the pair were surrounded by strong bearish traction. As for the Bollinger Bands, the pair was capped by the upper band at the moment of writing, if the price could break through the upper band, the bull could target the next resistance of the $1850 mark.

Resistance: 1850, 1870, 1900

Support: 1820, 1800

Economic Data

CurrencyDataTime (GMT + 8)Forecast
AUDGDP (QoQ) (Q4)08:300.8%
CNYManufacturing PMI (Feb)09:3050.5
CNYCaixin Manufacturing PMI (Feb)09:4550.2
EURGerman Manufacturing PMI (Feb)16:5546.5
EURGerman Unemployment Change (Feb)16:559K
GBPManufacturing PMI (Feb)17:3049.2
GBPBoE Gov Bailey Speaks18:00 
EURGerman CPI (YoY) (Feb)21:008.5%
USDISM Manufacturing PMI (Feb)23:0048
USDCrude Oil Inventories23:300.457M

Investors looking at another big week in retail earnings

Stocks rose Monday as traders tried to recover some ground following the worst week of the year on Wall Street. Investors also looked ahead to another big week in retail earnings. The Dow closed higher Monday, as dip buying in beaten-down growth stocks helped the broader market recover following its worst week of the year.

The Dow Jones Industrial Average gained 72.17 points, or 0.22%, to close at 32,889.09.

The S&P 500 was up 0.31% at 3,982.24, and the Nasdaq Composite rose 0.63% to 11,466.98.

The moves came as Treasury yields eased, following a jump on Friday after a hotter-than-expected reading from the Federal Reserve’s favorite inflation metric.

Last week, some data frightened investors, and the US bond yield climbed again. People have become a bit numb to rate hikes and understand that the terminal rate may be higher than expected, and the market is not concerned about inflation data for the next month, but for the next 6, 9, or even 12 months.

Main Pairs Movement

USD Index eyes the first monthly gain in five despite week-start retreat from the multi-day top

US Dollar Index holds lower grounds near $104.60 during the mid-Asian session on Tuesday, after posting the biggest daily loss in five. It’s worth noting that the greenback’s previous losses could be linked to mixed US data and a retreat in the US Treasury bond yields. At the time of writing, the price traded at $104.639.

The cable is flat in Asia as markets consolidate the opening range and the US Dollar softness that kicked in at the start of the week. Meanwhile, the Bank of England is seen increasing Bank Rate by a further 25 bps to 4.25% in March. At the time of writing, the price is trading at $1.20666 and has stuck to a $1.2042/67 range so far.

WTI advances towards $76.00 as investors look optimist for Caixin Manufacturing PMI.

WTI futures on NYMEX, have extended their recovery above the immediate resistance of $75.80 in the early Asian session. The oil price is exposed to the critical resistance of $76.00 as investors are optimistic about the release of the Caixin Manufacturing PMI data, which is scheduled for Wednesday.

At the time of writing, the price traded at $75.561.

Technical Analysis

EURUSD (4-Hour Chart)

The EURUSD is having so far the best day since February 1 on Monday, boosted by a weaker US Dollar across the board on the back of an improvement in risk sentiment and a retreat in Treasury yields. The pair was currently trading at the 1.0590 level and facing some headwinds around the psychological resistance at the 1.0600 level. On the data side, US data showed a larger-than-expected decline in Durable Goods Orders. The headline dropped by 4.5%, against expectations of a 4% slide. Most details of the report were positive. A different report showed Pending Home Sales surged 8.1% in January, surprising market participants that expected an increase of 1%. Compared to a year ago, sales were down 24.1%. The US Dollar further weakened after the economic figures, helping EURUSD move further north.

From the technical perspective, the four-hour scale RSI indicator climbed back to the neutral area, showing the heavy selling pressure has weakened. As for the Bollinger Bands, the pair was trading around a 20-period moving average and the gap between upper and lower bands became smaller, suggesting the market is waiting for more clues for the future path. In our view, Investors should be aware of the downside tendency has not vanished, the pair is still more favored to the south path despite a strong corrective rebound on Monday.

Resistance: 1.0788, 1.0929

Support: 1.0508, 1.0401

XAUUSD (4-Hour Chart)

The XAUUSD regain positive strength and rebound to above the $1815 mark at the moment of writing, as the US dollar lost its upside momentum since the European trading session. This week, a bunch of mid-tier US macroeconomic releases could help shape how much more room gold price can have to the downside ahead of the crucial March 22 Federal Reserve (Fed) meeting. The US Durable Goods Orders data released earlier today came out mixed. The headline figure was worse than expected, showing a bigger decline (-4.5%) than what the consensus had forecast (-4.0%). Gold price reacted modest-but-positively to this release as the US Dollar witnessed heavy selling transactions.

From the technical perspective, the four-hour scale RSI indicator returned to the 45 figures, suggesting the pair were still surrounded by slight bearish traction. As for the Bollinger Bands, the pair was supported by the lower band and capped by the 20-period moving average, showing the pair continued to move in the downside pattern.

Resistance: 1850, 1870, 1900

Support: 1820, 1800

Economic Data

CurrencyDataTime (GMT + 8)Forecast
AUDRetail Sales (MoM) (Jan)08:301.50%
CADGDP (MoM) (Dec)21:300.10%
USDCB Consumer Confidence (Feb)23:00108.5

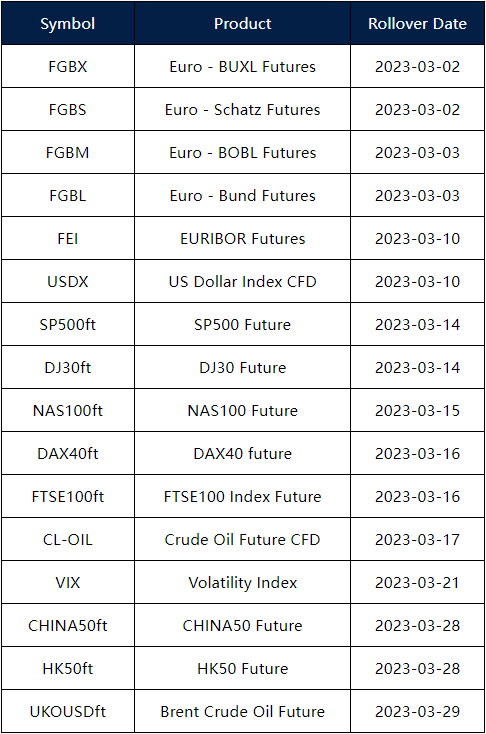
March Futures Rollover Announcement – February 27, 2023

Dear Client,

The new futures rollover dates are listed in the table below.

Please note:

• The rollover will be done automatically. All existing positions will remain open.

• Positions that are open on the expiration date will be adjusted via a rollover charge or credit to reflect the price difference between the expiring and new contracts.

• To avoid CFD rollovers, you can choose to close any open CFD positions prior to the expiration date.

• Please ensure that all take-profit and stop-loss settings are adjusted before the rollover occurs.

• All internal transfers for accounts under the same name will be prohibited during the first and last 30 minutes of the trading hours on the rollover dates.

Please contact our customer service team at [email protected] if you have any questions.

US stocks are moving lower on Friday

US stocks suffered from daily losses last Friday, witnessing heavy selling pressure, and extended their weekly rout following data that showed the core PCE rose at the highest rate in six months. The annual Core PCE Price Index, which is also the Federal Reserve’s preferred gauge of inflation, edged higher to 4.7% and came in higher than the market expectation of 4.3%.

Therefore, the hotter-than-estimated inflation data suggested growing bets the Federal Reserve has a long way to go in its aggressive tightening crusade, making the odds of a soft landing look slimmer. Investors dumped US equities after a higher-than-anticipated jump in consumer spending in January fueled the risk of more policy tightening by Fed chair Jerome Powell in March. On top of that, the Federal Reserve (Fed) officials were also hawkish and backed the US Dollar bulls, as well as weighing on the equity markets. As per the latest reading of the FEDWATCH tool, market players price a year-end effective fed funds rate at 5.3%, versus 5.1% signaled by the US central bank in its December meeting.

The benchmarks, S&P 500 and Dow Jones Industrial Average both declined lower last Friday as the S&P 500 experienced the worst slide in 2023 after hot PCE inflation data provided a boost to the US Treasury bond yields. The S&P 500 was down 1.1% daily and the Dow Jones Industrial Average meanwhile dropped lower with a 1.0% loss for the day. Nine out of eleven sectors in the S&P 500 stayed in negative territory as the Real Estate sector and the Information Technology sector are the worst performing among all groups, losing 1.82% and 1.77%, respectively. The Nasdaq 100 meanwhile dropped the most with a 1.7% loss last Friday and the MSCI World index was down 1.2% for the day.

Main Pairs Movement

The US dollar advanced higher last Friday, marking a four-week uptrend by the end of the day, and ground near the highest levels in seven weeks amid strong United States data. The hawkish Federal Reserve concerns have provided strong support to the safe-haven greenback, as hawkish Federal Reserve (Fed) talks underpin markets bets of higher Fed rates. Cleveland Fed President Loretta Mester told CNBC on Friday that his funds’ rate was above the median in December and still thinks they need to be somewhat above 5%.

GBP/USD dropped lower last Friday with a 0.57% loss after the cable extended its intraday slide and touched a daily low near the 1.1930 mark in the late US session amid a stronger US Dollar and higher US yields. On the UK front, bets for additional rate hikes by the BoE might limit the downside for the currency. Meanwhile, EUR/USD also witnessed some selling interest and touched a daily low below the 1.0540 mark. The pair was down almost 0.45% for the day.

Gold suffered from daily losses with a 0.62% loss for the day after dropping to the lowest levels in two months below the $1810 level during the US trading session, as the strong US data underpinned hawkish Federal Reserve concerns and weighed on the yellow metal. Meanwhile, WTI Oil rebounded sharply with a 1.23% gain for the day.

Technical Analysis

EURUSD (4-Hour Chart)

The EURUSD further declined to its lowest level since early January below 1.0550 as of writing following the surprisingly high US core PCE inflation, rising to 4.7% in January, compared to market expectation of 4.3%, which provided a boost to the US Dollar. More detailed data saw Personal Income expand by 0.6% MoM also in January and Personal Spending increased by 1.8% compared to the previous month. However, it’s also worth noting that markets are already fully pricing in two more 25 basis points for Fed rate hikes in March and May. Currently, speculation the Fed will do a 50 basis points rate hike is mounting based on the stronger-than-expected growth in monthly core PCE inflation, and the CME FedWatch Tool showed the probability of a 50 bps rate hike rose to 32.9%.

From the technical perspective, the four-hour scale RSI indicator fell below the critical overselling level, suggesting that the pair were surrounded by strong bearish momentum, but investors should be aware of the corrective pullback. As the Bollinger bands, the pair continued to move along with the lower band, showing the pair was more favored to the downside path.

Resistance: 1.0788, 1.0929

Support: 1.0508, 1.0401

XAUUSD (4-Hour Chart)

Gold price remained under bearish pressure and priced at its lowest level since late December near the $1810 mark. On the back of stronger-than-expected PCE inflation data for January, the benchmark 10-year US Treasury bond yield is up more than 1% on the day near 3.95%, weighing on XAUUSD. The recent series of strong United States economic data and hawkish Federal Reserve (Fed) commentary has heightened expectations for three rate hikes this year – 25 basis points (bps) each in the March, May, and June meetings. Earlier in the US session, the US headline PCE rose 5.4% in the year to January from 5.3% and the core PCE rallied to 4.7% from a year earlier, both prints surpassing initial estimates. Markets now price the Federal Reserve terminal rate at 5.347% in July, remaining above 5% through the year.

From the technical perspective, the four-hour scale RSI indicator dropped below overselling level, suggesting that the pair was under heavy bearish pressure, but market participants should be cautious about a corrective pullback. As for the Bollinger Bands, the gold was priced below the lower band and the size between upper and lower bands gets larger, showing the downside tendency would persist shortly.

Resistance: 1850, 1870, 1900

Support: 1820, 1800

Economic Data

CurrencyDataTime (GMT + 8)Forecast
USDCore Durable Goods Orders (MoM) (Jan)21:300.10%
USDPending Home Sales (MoM) (Jan)23:001.00%

Week ahead: All eyes on US ISM Manufacturing and Services PMI

This week, the markets will be watching closely as two of the most influential economic indicators US ISM Manufacturing and Services PMI figures are released. With these reports being used to measure the overall health of the US economy, the results could have a dramatic effect on financial markets worldwide. This makes them an essential area for market participants to keep tabs on.

Here are key events to watch out for:

Gross Domestic Product | Canada (28 February)

The Canadian economy continued its upward trend in Q3 2022, growing by 0.7%, marking the fifth consecutive quarter of growth. 

Analysts predict that the economy will continue to grow and expand by 0.4% in Q4 2022.

CB Consumer Confidence (28 February)

The Consumer Confidence Index fell from 109 in December to 107.1 in January 2023, according to the Conference Board. 

However, analysts anticipate a possible recovery in the index, with a projected increase to 109 in February.

Consumer Price Index (CPI) | Australia (1 March)

The Consumer Price Index in Australia increased to a new high of 8.4% in December 2022, up from 7.3% in November. 

Analysts predict that the Australian CPI will continue to rise, with an 8.6% increase projected for January 2023.

ISM Manufacturing Purchasing Managers’ Index | US (1 March)

The US ISM Manufacturing PMI fell to 47.4 in January 2023, the lowest level since May 2020. 

Analysts predict a slight rebound in the PMI for February, with a reading of 47.9.

ISM Services Purchasing Managers’ Index | US (3 March)

The ISM Services PMI for the United States unexpectedly rose to 55.2 in January 2023, up from a 2-1/2-year low of 49.2 in December. 

Analysts predict that the PMI will fall slightly in February 2023 at 54.6.

Economic data signal potential hike rates in the next meeting

US stocks advanced higher on Thursday, regaining upside momentum, and rose in a jittery session after US indexes trimmed part of their losses ahead of the close. The impressive rebound witnessed in huge companies like Microsoft Corp. and Apple Inc has underpinned the Nasdaq 100 despite the hawkish FOMC Meeting Minutes and mixed United States figures.

On Thursday, the US Q4 GDP report showed that the annualized pace of growth in the country was downwardly revised to 2.7% from 2.9% in the last quarter of 2022. Meanwhile, the Personal Consumption Expenditure Prices rose by 3.7% QoQ, which indicated that inflationary pressures in the same period were higher than previously estimated.

The economic data further fueled speculation the US Federal Reserve will continue to hike rates in the upcoming meetings. Market players are now waiting for the US January Personal Consumption Expenditures Price Index, which is the Fed’s preferred price gauge, is expected to show acceleration.

The benchmarks, S&P 500 and Dow Jones Industrial Average both advanced higher on Thursday as the S&P 500 came back up after erasing a rally of almost 1% with a series of twists and turns on Wall Street. The S&P 500 was up 0.5% daily and the Dow Jones Industrial Average meanwhile climbed higher with a 0.3% gain for the day. Seven out of eleven sectors in the S&P 500 stayed in positive territory as the Information Technology sector and the Energy sector are the best performing among all groups, rising 1.63% and 1.27%, respectively. The Nasdaq 100 meanwhile rose the most with a 0.9% gain on Thursday and the MSCI World index was up 0.3% for the day.

Main Pairs Movement

The US dollar edged higher on Thursday, preserving its upside strength but then retreated slightly back from a daily high above 104.70 level during the US trading session amid hawkish Fed bets. The Fed is expected to continue its policy tightening to achieve price stability as the upbeat labor market in the United States could underpin the Consumer Price Index (CPI) sooner. The USD Index is likely to remain volatile ahead of the release of the United States Core Personal Consumption Expenditure (PCE) Price Index data.

GBP/USD dropped lower on Thursday with a 0.27% loss after the cable extended its intraday slide and touched a daily low below the 1.2000 mark in the late US session ahead of US PCE Inflation. On the UK front, the BoE policymaker is worried about the extended persistence of inflation and sees the need for more tightening. Meanwhile, EUR/USD also witnessed some selling interest and touched a daily low around the 1.0580 mark. The pair was down almost 0.10% for the day.

Gold suffered from daily losses with a 0.17% loss for the day after witnessing further downside move and printed a fresh seven-week low below the $1820 level during the US trading session, as the US data fueled market concerns and weighed on the yellow metal. Meanwhile, WTI Oil rebounded sharply with a 1.95% gain for the day.

Technical Analysis

EURUSD (4-Hour Chart)

The EURUSD extended its bearish tendency and was trading below the 1.0600 level as of writing, under pressure since the day started. The US Dollar continued to strengthen on the back of hawkish US Federal Reserve (Fed) prospects. The Federal Open Market Committee (FOMC) Meeting Minutes released on Wednesday is more hawkish than anticipated, which showed that a few members would have preferred a 50 bps hike and that participants believe the continued tight job market would contribute upward pressure to inflation. The news boosted demand for the US Dollar as stock markets turned south. In Eurozone, the final estimate of the January Harmonized Index of Consumer Price (HICP), was confirmed at 8.6% YoY. However, the core reading was upwardly revised to 5.3% from a preliminary estimate of 5.2%.

From the technical perspective, the four-hour scale RSI indicator hovered just above the oversold zone, suggesting the pair was pressured by heavy bearish traction. As for the Bollinger Bands, the pair was moving along with the lower, trying to find support in the lower band, but the size between the upper and lower bands get larger, showing the downside tendency has a high chance to persist shortly.

Resistance: 1.0788, 1.0929

Support: 1.0508, 1.0401

XAUUSD (4-Hour Chart)

Gold price maintains under bearish pressure on Thursday as risk aversion continued underpinning the US Dollar. Gold price keeps edging lower in the course of trading and hit the lowest $1,817.58 in the US session, while the US dollar advanced on the back of hawkish FOMC Meeting Minutes. On the other hand, inflationary pressures in the same period were higher than previously estimated. Personal Consumption Expenditure Prices rose by 3.7% QoQ, higher than the 3.2% expected, while the core reading came in at 4.3% higher than the 3.9% from the third quarter of 2022. The figures fueled speculation that the US Federal Reserve will hike rates further in the upcoming meetings.

For the technical aspect, RSI indicator 36 figures as of writing, maintaining in sell region as Gold price is still under a bearish trend. As for the Bollinger Bands, the price is moving down along with the lower band. This and the downward moving average signal some bearish potential. A continued downtrend could be expected. In conclusion, we think the market is in bearish mode as both indicators show bearish potential. We believe the downtrend would persist. For the downtrend scenario, the price is holding at $1,820. If the price close below the level, it may head to test the crucial support at the round-figure mark of $1,800.

Resistance: 1850, 1870, 1900

Support: 1820, 1800

Economic Data

CurrencyDataTime (GMT + 8)Forecast
EURGerman GDP (QoQ) (Q4)15:00-0.20%
USDCore PCE Price Index (MoM) (Jan)21:300.40%
USDNew Home Sales (Jan)23:00620K

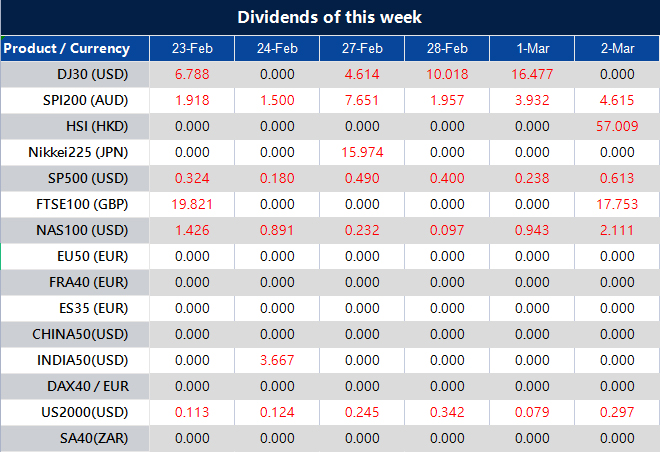
Weekly Dividend Adjustment Notice – February 23, 2023

Dear Client,

Please note that the dividends of the following products will be adjusted accordingly. Index dividends will be executed separately through a balance statement directly to your trading account, and the comment will be in the following format “Div & Product Name & Net Volume ”.

Please refer to the table below for more details:

If you’d like more information, please don’t hesitate to contact [email protected]

Fed members agreed to more hikes to achieve the inflation target

US stocks declined lower on Wednesday, witnessing some selling momentum, and failed to sustain their rebound after the Federal Reserve signaled that interest rates will continue moving higher amid ongoing inflation concerns. As per the latest Federal Open Market Committee’s (FOMC) Monetary Policy Meeting Minutes, all participants agreed more rate hikes are needed to achieve the inflation target as some believed there was an elevated risk of a recession in 2023.

On top of that, a few participants also favored a 50 basis point (bps) rate hike, which suggested that the Fed will be in no rush to cut rates and Swap markets now see June interest-rate hike as a near certainty. The hawkish Federal Reserve Minutes have underpinned the safe-haven greenback and weighed on the equity markets, which also suffered from geopolitical tensions throughout the day.

On the Eurozone front, European Central Bank (ECB) President Christine Lagarde said that inflation has begun to slow down but reiterated that they intend to raise the key rates by 50 basis points (bps) at the upcoming policy meeting.

The benchmarks, S&P 500 and Dow Jones Industrial Average both declined lower on Wednesday as the S&P 500 witnessed its fourth straight decline and the longest losing streak since December after a series of twists and turns. The S&P 500 was down 0.2% daily and the Dow Jones Industrial Average meanwhile retreated lower with a 0.3% loss for the day. Nine out of eleven sectors in the S&P 500 stayed in negative territory as the Real Estate sector and the Energy sector are the worst performing among all groups, losing 1.02% and 0.77%, respectively. The Nasdaq 100 meanwhile was little changed with a 0.4% gain on Wednesday and the MSCI World index was down 0.5% for the day.

Main Pairs Movement

The US dollar edged higher on Wednesday, extending its upside traction and accelerating its advance by the end of the US trading session following the Federal Open Market Committee (FOMC) Meeting Minutes. Fed chair Jerome Powell and his mates are still reiterating higher interest rates for a longer period to drag inflation down. Moreover, geopolitical fears surrounding China and Russia escalated and favored the rush towards the risk-safety, which in turn propelled the US Dollar.

GBP/USD dropped lower on Wednesday with a 0.54% loss after the cable witnessed an intense sell-off in the late US session and touched a daily low below the 1.204 mark amid Fed’s hawkishness. On the UK front, the preliminary UK manufacturing activities remained upbeat at 49.2 but a figure below 50.0 is considered a contraction. Meanwhile, EUR/USD also witnessed some selling interest and touched a daily high above the 1.0690 mark. The pair was down almost 0.40% for the day.

Gold suffered from daily losses with a 0.53% loss for the day after sliding towards the $1824 area and surrendered most of its early gains during the US trading session, as the geopolitical fears and hawkish Federal Reserve Minutes both exerted bearish pressure on the Gold price. Meanwhile, WTI Oil declined sharply with a 3.16% loss for the day.

Technical Analysis

EURUSD (4-Hour Chart)

The EURUSD was testing the 1.0620 support at the moment of writing, as investors wait for the Fed to release the minutes of the year’s first policy meeting, and the cautious market mood help the US Dollar hold its ground in the American session. Various signs showed that US inflation will take longer to reach the Federal Reserve’s 2% target, which means monetary tightening will continue longer than previously estimated. Apart from this, following Wall Street’s sharp decline on Tuesday, risk aversion keeps benefiting the safe-haven greenback, which weighed on the EURUSD pair. Moreover, geopolitical tensions continue to undermine the market mood as China escalated the bet, with a top local diplomat claiming they would deepen strategic cooperation with Russia.

From the technical perspective, the four-hour scale RSI indicator slid to 36 figures as of writing, suggesting that the pair was pressured by risk aversion flow. As for the Bollinger Bands, the pair was wandering in a narrow lower area and supported by the lower band, showing the pair was amid a bearish tendency in the near term.

Resistance: 1.0758, 1.0927

Support: 1.0619, 1.0508

XAUUSD (4-Hour Chart)

Gold price dropped towards $1,820 on Wednesday as the US Dollar maintained its hawkish bias. At the time of writing, Gold price is trading at $1824.61, posting a 0.56% loss daily, while the US Dollar Index rose 0.37% to 104.558. The US Dollar advance following the Federal Open Market Committee (FOMC) Meeting Minutes. The document showed that a few participants favored a 50 basis point (bps) rate hike, while some believed there was an elevated risk of a recession in 2023. Most importantly, all participants agreed more rate hikes are needed to achieve the inflation target, which benefits the US Dollar, weighing on dollar-denominated Gold.

For the technical aspect, the RSI indicator is 35 figures as of writing, edging lower as the Gold price stages a downside movement. As for the Bollinger Bands, the price slid through the moving average and lower band. As the price made a decisive breakthrough to the downside, a continued downtrend could be expected. In conclusion, we think the market is in bearish mode as both indicators show bearish potential. For the downtrend scenario, the next support level is at $1,820. If the price close below the level, it may head to test the crucial support at the round-figure mark of $1,800.

Resistance: 1850, 1870, 1900

Support: 1820, 1800

Economic Data

CurrencyDataTime (GMT + 8)Forecast
EURCPI (YoY) (Jan)18:008.6%
USDGDP (QoQ) (Q4)21:302.9%
USDInitial Jobless Claims21:30200K

US stocks lower as Fed might raise more interest rate

US stocks recorded their worst day in two months on Tuesday, as investors were unnerved by economic data suggesting interest rates have further to rise after months of increases by the Federal Reserve.  The blue-chip S&P 500 index ended down 2 percent, with declines in every sector. The tech-heavy Nasdaq Composite slid 2.5 percent. Both indices had their steepest daily losses since December 15.

Markets have wobbled in recent days as investors gird for further interest rate rises from the Fed to combat inflation in the US economy. Yields on benchmark Treasury bonds reached three-month highs on Tuesday, pushing yields up to 3.95 percent.

Ahead of Wednesday’s trade, market participants will be closely monitoring the latest FOMC meeting minutes as well as a speech from FOMC member Williams. Key reports to watch include the PCE Prices Index this Friday (2/24), the Job Openings and Labor Turnover report on 3/8, the February Employment Report on 3/10, and the Consumer Price Index on 3/14.

Main Pairs Movement

DXY trades within a tight range near Friday’s closing levels in the sub-104.00 zone.

Higher Treasury yields and a projected 5.3% terminal Fed funds rate have seen a resurgence in the US Dollar index, DXY. At the time of writing, the price traded at 104.171.

GBP/USD grinds higher past 1.2100, mildly bid around 1.2115 during the initial hours of Wednesday’s Asian trading, as upbeat UK fundamentals keep Cable buyers hopeful ahead of the key Federal Open Market Committee’s Monetary Policy Meeting Minutes. At the time of writing, the price traded at 1.2118.

Gold price holds lower grounds near $1,835, following a two-day downtrend, at the time of writing, price trading at 1836.18.

Brent crude settled 1.2 percent lower to $83.05 a barrel, while the US equivalent WTI price is declining towards $75.50 as the expectations for more rate hikes by the Fed are escalating.

Technical Analysis

GBPUSD (4-Hour Chart)

The GBPUSD lost upside traction and hover around the 1.21000 level as of writing, as the stronger-than-expected PMI data from the US provided a boost to the US dollar and limit the pair’s upside. The monthly data published by S&P Global showed on Tuesday that Composite PMI in early February jumped to 53 from 48.5 in January. Manufacturing PNI came in at 49.2 to beat the market expectation of 46.8 and Services PMI climbed to 53.3 from 48.7. With the UK private sector holding resilient in the face of strong inflation, the Bank of England is likely to continue to raise its policy rate without worrying about a deep recession.

From the technical perspective, the four-hour scale RSI indicator figured 58 as of writing, suggesting that the pair was surrounded by bullish momentum. As for the Bollinger Bands, the pair was priced above the 20-period moving average and limited by the upper band, showing the pair currently was more favored to the positive path in the near term. Once the bulls break the upper band, the next stop would be the 1.2210 level.

Resistance: 1.2211, 1.2400

Support: 1.2012, 1.1935, 1.1859

XAUUSD (4-Hour Chart)

Gold price remains under pressure on Tuesday as the benchmark US 10-Year Treasury rose 2.97% to 3.956, capping any further gains on Gold price. At the time of writing, the Gold price is trading at $1835.10, posting a 0.46% loss daily. On the other hand, investors keep their eyes on geopolitical tensions. The recent visit of US President Joe Biden to Ukraine led Russia to suspend its nuclear arms treaty with the United States. Russian President Vladimir Putin also vowed to continue the military campaign in Ukraine. Worrying about geopolitical tension could directly influence the risk sentiment, and provide a fresh catalyst to Gold prices.

For the technical aspect, RSI indicator 43 figures as of writing, holding around mid-line as the price is amid a consolidation phase in the near term. As for the Bollinger Bands, the price moves up and down around the moving average. The price needs a decisive breakthrough to trigger some following traction. In conclusion, we think the market is under a modest bearish trend as the price is edging lower and weighed by upbeat US Treasury yield, though both indicators show no strong bearish potential. For the downtrend scenario, the next support level is at $1,820. If the price close below the level, it may trigger some technical selling and drag the price deeper.

Resistance: 1870, 1900, 1920

Support: 1820, 1800

Economic Data:

CurrencyDataTime (GMT + 8)Forecast
NZDRBNZ Interest Rate Decision09:004.75%
NZDRBNZ Rate Statement09:00 
NZDRBNZ Press Conference10:00 
EURGerman CPI (YoY) (Feb)15:008.70%
EURGerman Ifo Business Climate Index (Feb)17:0091.4
NZDRBNZ Press Conference22:00 
Back To Top
server

Hai 👋

Bagaimana saya boleh membantu?

Segera berbual dengan pasukan kami

Chat Langsung

Mulakan perbualan secara langsung melalui...

  • Telegram
    hold Ditangguh
  • Akan datang...

Hai 👋

Bagaimana saya boleh membantu?

telegram

Imbas kod QR dengan telefon pintar anda untuk mula berbual dengan kami, atau klik di sini.

Tidak ada aplikasi Telegram atau versi Desktop terpasang? Gunakan Web Telegram sebaliknya.

QR code