Market slow as US Market holiday

U.S. stock futures were trading lower during Monday’s evening deals, with significant benchmark averages remaining closed during the regular session for a public holiday.

Contracts on the S&P 500 Index slipped 0.3%, with Treasury futures dropping across the curve. Stocks ended last week on a muted note after Richmond Fed President Thomas Barkin and Fed Governor Michelle Bowman both expressed their support for continued rate hikes.

On the bond markets, United States 10-Year rates were at 3.842%. As Germany’s 10-year yield advanced two basis points to 2.46% and Britain’s 10-year yield declined four basis points to 3.47%.

There are six big stock buybacks follow by this week.

TWLO announced a share repurchase program of up to 1 billion of its outstanding Class A common stock. Shares gained more than 17% last week.

Citizens Financials 1.15 billion buyback expansion. This is incremental to the $850M of capacity remaining as of December 31, 2022, under the prior June 2022 authorization, of which $400M will be utilized during Q1/23. Also, there are 4 more share buybacks for CHKP with 2 billion, WAB with 750 million, TTD with 700 million, and NTR with 5% of its issued common shares.

Main Pairs Movement

DXY trades within a tight range near Friday’s closing levels in the sub-104.00 zone.

The ongoing price action favors the continuation of the uptrend for the time being. Further bouts of strength are now expected to put a potential test of the 2023 top at 105.63 (January 6) back on the investors’ radar in the future. In the longer run, while below the 200-day SMA at 106.44, the outlook for the index remains negative. At the time of writing, the price is trading at 103.895.

WTI crude oil remains depressed near $76.50 as it fades from late Friday’s bounce off a 10-week low during early Monday in Asia. In doing so, the black gold remains below the convergence of the 21-DMA and the 50-DMA, as well as the downward-sloping resistance line from November and the 100-DMA. At the time of writing, the price is trading at 77.36.

Gold price struggles for clear directions around 1,840, following a mildly negative start to the week’s trading, as traders await the preliminary readings of the United States Purchasing Managers Index for February. At the time of writing, the price is trading at 1842.44.

Technical Analysis

EURUSD (4-Hour Chart)

The EURUSD advanced toward the 1.0690 level in the second half of Monday and managed to erase its losses. As trading action turns subdued with US markets remaining closed in observance of Presidents’ Day, the pair could find it difficult to gather directional momentum. The US Dollar started the week advancing against most major rivals as geopolitical headlines took over the weekend. However, the EURUSD pair is confined to a tight 30 pips range since the market opened. A scarce macroeconomic calendar and a holiday in the US will limit volatility until Tuesday’s Asian opening. The Eurozone published December Construction Output, which contracted 1.3% YoY and 2.5% MoM, worse than anticipated.

From a technical perspective, the four-hour scale RSI indicator remained flat in the neutral region, suggesting that the pair currently lack of catalyst to make a decisive move. As for the Bollinger Bands, the pair continued to move along with the 20-period moving average. We think the EURUSD would move in a small range from 1.0650 to 1.0700 until there is any unanticipated event to fuel the market mood.

Resistance: 1.0794, 1.1022

Support: 1.0634, 1.0505

XAUUSD (4-Hour Chart)

The XAUUSD consolidate Friday’s gains, moving slightly in a narrow range around the $1840 mark as United States markets are closed amid President’s Day holiday. The financial markets are trying to digest the latest US Federal Reserve officials’ hawkish messages. Hopes for a soon-to-come pivot in monetary policy have faded ever since the year started, with the terminal rate now expected above 5%. Apart from this, tensions between the US and China over the balloons shots earlier this month continue as US top diplomat Anthony Blinken said Beijing’s actions were irresponsible, while Chinese officials responded US reaction was “hysterical.” Meanwhile, North Korea fired an intercontinental ballistic missile on Saturday that landed in the Sea of Japan. Finally, US President Joe Biden arrived in Ukraine in a surprise visit to Kyiv to announce additional weapons supplies. The mounting geopolitical crisis may provide a boost for the safe-haven gold.

From a technical perspective, the four-hour scale RSI indicator little changed on Monday, staying in the neutral area, which suggests that the pair currently failed to gather directional momentum. As for the Bollinger Bands, the pair was pricing stably above the 20-period moving average, showing the pair is more favored to the upside path in the near term.

Resistance: 1870, 1900, 1920

Support: 1820, 1800

Economic Data

CurrencyDataTime (GMT + 8)Forecast
AUDRBA Meeting Minutes08:30 
EURGerman Manufacturing PMI (Feb)16:3048
GBPComposite PMI17:30 
GBPManufacturing PMI17:3048
GBPServices PMI17:3049
EURGerman ZEW Economic Sentiment (Feb)18:0022
CADCore CPI (MoM) (Jan)21:300.20%
CADCore Retail Sales (MoM) (Dec)21:30-0.30%
USDExisting Home Sales (Jan)23:004.10M

Geopolitical conditions creating bearish pressure on the equity markets

US stocks declined lower on Friday, witnessing some selling momentum, and ended the week slightly lower amid Federal Reserve officials’ hawkish comments. The geopolitical conditions surrounding China and Russia join the recently hawkish Federal Reserve (Fed) bias and exerted bearish pressure on the equity markets.

On Friday, Federal Reserve Bank of Richmond President Thomas Barkin said that he favored a quarter-point interest rate hike in February to give the central bank “flexibility” in its quest to tamp down inflation. Meanwhile, Fed Governor Michelle Bowman said rates need to keep going higher since inflation remains much too high and they are seeing a lot of inconsistent data in economic conditions.

The higher-than-expected Producer Price Index (PPI) for January has spurred hawkish commentary by two Federal Reserve (Fed) officials, who said that rates need to be higher for longer, foreseeing them above the 5.0% threshold. On the Eurozone front, European Central Bank’s policymakers said that they will keep rates high as long as necessary and another 50 basis points (bps) rate hike in March will be needed under virtually all scenarios.

The benchmarks, S&P 500 and Dow Jones Industrial Average both declined lower on Friday as the S&P 500 was trading with losses on risk aversion after economic data revealed an uptick in inflationary pressures in the United States. The S&P 500 was down 0.3% daily and the Dow Jones Industrial Average meanwhile advanced higher with a 0.4% gain for the day. Five out of eleven sectors in the S&P 500 stayed in negative territory as the Energy sector and the Information Technology sector is the worst performing among all groups, losing 3.65% and 1.19%, respectively. The Nasdaq 100 meanwhile dropped the most with a 0.7% loss on Friday and the MSCI World index was down 0.7% for the day.

Main Pairs Movement

The US dollar edged higher on Friday, failing to preserve its upside traction, and retreated to the 103.90 area ahead of the Wall Street close amid the souring market mood. The US CPI and PPI figures reignite investors’ worries about a hawkish Federal Reserve and spurred speculations that further Federal Reserve tightening is on its way. The Money market futures show the Federal Fund Rates (FFR) climbing above 5.3% in July vs. 4.9% a couple of weeks ago.

GBP/USD advanced higher on Friday with a 0.37% gain after the cable rebounded from a daily low and climbed to a 1.2040 level amid the retreating US dollar. On the UK front, the softer UK inflation report on Tuesday contributed to speculations that the Bank of England (BoE) would not hike rates as aggressively as expected. Meanwhile, EUR/USD also witnessed some buying interest and touched a daily high above the 1.0690 mark. The pair was up almost 0.20% for the day.

Gold was trading higher with a 0.33% gain for the day after rebounding towards the $1843 area and recovered most of its daily losses during the US trading session, as the softer Consumer Price Index (CPI) for January in the US incremented the likelihood of further tightening by the Fed and exerted bearish pressure to the Gold price. Meanwhile, WTI Oil declined sharply with a 2.74% loss for the day.

Technical Analysis

GBPUSD (4-Hour Chart)

The GBPUSD has reversed its direction and advanced toward 1.2000 in the American session on Friday. The modest retreat witnessed in the US Dollar Index seems to act as a tailwind for the pair. The broad-based US Dollar (USD) strength weighed heavily on the pair in the second half of the week. Hawkish comments from Fed policymakers and the latest macroeconomic data releases revived expectations that the Fed could opt to do additional rate hikes even after May. In the domestic, the UK’s Office for National Statistics reported on Friday that Retail Sales increased by 0.5% every month in January. Although this reading came in better than the market expectation for a decrease of 0.3%, December’s print of -1% got revised lower to -1.2%, not allowing the Pound Sterling to benefit from that data.

From the technical perspective, the four-hour scale RSI indicator surged to 48 figures as of writing, suggesting that the pair were amid recovery momentum. As for the Bollinger Bands, the pair was supported by the lower band and tried to challenge the 20-period moving average, showing the pair was hovering in a range from 1.1920 to 1.2210 and waiting for a more clear signal.

Resistance: 1.2209, 1.2390

Support: 1.1924, 1.1859

XAUUSD (4-Hour Chart)

The XAUUSD regathered recovery momentum and climbed above the $1830 mark in the second half of the day on Friday, as the 10-year US Treasury bond yield turned negative on the day below 3.9%, helping XAU/USD retrace its daily decline. The US Dollar continues to build on its recovery mode from ten-month troughs, as the American economy shows signs of resilience, in the wake of the latest strong economic data. The strong United States Nonfarm Payrolls data was succeeded by the hot Consumer Price Index (CPI). Furthermore, the US Retail Sales as well as Producer Price Index (PPI) all support Federal Reserve doing an additional rate hike, with the rate likely to go beyond 5.1%.

From the technical perspective, the four-hour scale RSI indicator rallied dramatically to 48 as of writing, suggesting that the pair was recovering from the consecutive day’s losses. As for the Bollinger Bands, the pair was just breaking through the 20-period moving average and gained support during the $1820 mark of the lower band. In our view, gold will remain the downside tendency and fall to find the $1800 mark, a strong psychological level, shortly.

Resistance: 1870, 1900, 1920

Support: 1820, 1800

Economic Data

CurrencyDataTime (GMT + 8)Forecast
 CNY                PBoC Loan Prime Rate09:15 

Week ahead: FOMC meeting minutes, RBNZ rate statement, and Canada CPI in focus

In the upcoming week, several significant events and economic data releases are scheduled to take place. Among them are the Federal Open Market Committee (FOMC) meeting minutes, the Reserve Bank of New Zealand (RBNZ) rate statement, and the Canada Consumer Price Index (CPI) report. 

These events are expected to garner considerable attention from investors, economists, and financial analysts as they provide insights into the current state of the global economy and the outlook for the future. Market participants will closely monitor these reports and releases to understand the current economic climate better and make informed investment decisions.

Let’s take a closer look at these events:

UK and US Flash Services PMI (21 February)

The UK’s January 2023 Flash Services PMI decreased from 49.9 in December 2022 to 48.7. The US Flash Services PMI increased from 44.7 in December to 46.8 in January.

For February 2023, analysts anticipate that the UK Flash Services PMI will increase to 49.3, while the US Flash Services PMI will rise to 47.4.

UK Flash Manufacturing PMI (21 February)

The UK Flash Manufacturing PMI increased to 47.0 in January 2023 from the 31-month low of 45.3 recorded in December 2022. 

Analysts predict a further increase in the UK Flash Manufacturing PMI to 47.5. This data is closely watched as it provides an early indication of the health of the UK manufacturing sector, which plays a crucial role in the country’s economy.

Canada Consumer Price Index (21 February)

Canada Consumer Price Index declined by 0.6% in December 2022 compared to the previous month. 

Analysts forecast a 0.2% increase in Canada’s CPI for January 2023. This forecasted increase is significant as it could indicate the beginning of a broader economic recovery.

Australia Wage Price Index (22 February)

The Australian Wage Price Index (WPI) experienced a year-on-year increase of 3.1% in Q3 2022, as per the seasonally adjusted data, marking an acceleration from the 2.6% growth seen in Q2. This result is the most substantial reading since Q1 2013.

For Q4 2022, analysts forecast that Australian WPI will increase by 3.6% year-on-year. This anticipated growth is a positive sign for the Australian economy, and investors will be keeping a close eye on the release of the WPI data for insights into the country’s economic health.

RBNZ Monetary Policy and Rate Statement (22 February)

The Reserve Bank of New Zealand increased its interest rate in November 2022 by 75bps to 4.25% from the previous rate of 3.5%.

Analysts expect the RBNZ to announce another increase in its interest rate of 50bps to 4.75% this month. The expected gain would signify the central bank’s continued efforts to keep inflation under control and maintain a stable economy.

FOMC Meeting Minutes (23 February)

In its February 2023 meeting, the US Federal Reserve increased the fed funds rate target range by 25bps to 4.5%-4.75%. In a statement, Fed Chair Jerome Powell indicated that the Fed had the necessary tools to control inflation, and disinflation had begun.

Powell’s comments suggested that there would be no significant changes to the Fed’s future rate increase strategy, despite a strong January jobs report. 

Core PCE Price Index (23 February)

In December 2022, the US Core PCE price index, excluding food and energy, increased by 0.3% on a month-on-month basis, compared to the 0.2% growth seen in the previous month.

Analysts predict that the US Core PCE Price Index will increase by 0.2% this month.

Fed officials considering 50bps interest rate hike

US stocks dropped sharply on Thursday, coming under intense selling pressure, and closed firmly in the red after two Federal Reserve officials said they were considering 50 basis-point interest rate hikes to battle persistently high inflation. The firmer US data that allows the Fed policymakers to remain hawkish lend support to the US dollar and weighed heavily on the equity markets. On Thursday, St. Louis Federal Reserve’s James Bullard and Cleveland Fed President Loretta Mester both embraced more significant hikes as they said that continued policy rate increases can help lock in a disinflationary trend during 2023 and would not rule out supporting a half-percentage-point increase at the Fed’s March meeting. On top of that, the US Producer Price Index (PPI) for January gained major attention as it jumped the most since June with a 0.7% MoM figure, reviving speculation the US Federal Reserve will maintain the pace of tightening for more than anticipated. On the Eurozone front, ECB’s monthly bulletin said that future policy rate decisions will continue to be data-dependent and follow a meeting-by-meeting approach.

The benchmarks, S&P 500 and Dow Jones Industrial Average both declined lower on Thursday as the S&P 500 suffered from daily losses after the US Dollar reached fresh weekly peaks. The S&P 500 was down 1.4% daily and the Dow Jones Industrial Average also retreated lower with a 1.3% loss for the day. All eleven sectors in S&P 500 stayed in negative territory as the Consumer Discretionary sector and the Information Technology sector is the worst performing among all groups, losing 2.16% and 1.75%, respectively. The Nasdaq 100 meanwhile dropped the most with a 1.9% loss on Thursday and the MSCI World index was little changed for the day.

Main Pairs Movement

The US dollar edged higher on Thursday, refreshing its weekly peaks against most major rivals near the 104.20 level but gave back some ground ahead of the Wall Street close amid the downbeat market mood. The US Producer Price Index (PPI) bolsters hawkish Federal Reserve bets and fuels US Treasury bond yields. The latest FEDWATCH read from Reuters also signals that the interest rate futures market shows US rates could peak close to 5.25% by July.

GBP/USD declined lower on Thursday with a 0.31% loss after the cable extended its downside momentum and touched a daily low below the 1.1970 mark amid the higher-than-expected US PPI data. On the UK front, the softer UK CPI reflected that the Bank of England would not need to tighten monetary conditions aggressively. Meanwhile, EUR/USD also witnessed selling interest and dropped to a daily low below the 1.0660 area. The pair was down almost 0.14% for the day.

Gold was little changed with a 0.02% gain for the day after regaining some upside traction and rebounded from the $1828 area during the US trading session, as the higher US PPI and renew hawkish bias for the Federal Reserve continued to exert bearish pressure to the Gold price. Meanwhile, WTI Oil retreated lower with a 0.13% loss for the day.

Technical Analysis

EURUSD (4-Hour Chart)

The EURUSD came under modest bearish pressure and stayed below 1.0700 during the US trading session on Thursday. The pair confronted another selling pressure after US Producer Prices rose more than expected a monthly 0.7% in January and 6.0% from a year earlier. Still, on the strong side, weekly Initial Claims increased by 194K in the week of February 11, showing once again the persistent good health of the labor market. Moreover, Cleveland Fed and well-known hawk L.Mester reiterated that inflation remains too high at the time when she noted that the current Fed’s tightening cycle should slow growth and increase unemployment.

From a technical perspective, the four-hour scale RSI indicator remained neutral at 43 figured as of writing, suggesting that the pair was surrounded by modest negative traction. As for the Bollinger Bands, the pair was supported by the lower band and the pair touched the lower bands three times, showing this is a critical support level for the near term. As a result, we think the bears could put their eyes on the 1.0510 level once the EURUSD fell below the 1.0656 support level.

Resistance: 1.0930, 1.1020

Support: 1.0656, 1.0508

XAUUSD (4-Hour Chart)

The XAUUSD extended its bearish route and dropped to a fresh February low of $1827 marks after the release of US macroeconomic data. Currently, the US Dollar remained its upside tendency and earned modest growth daily. The US labor market remains tight, while there were more signs of inflation easing at a slower-than-anticipated pace. The January Producer Price Index (PPI) rose at an annualized pace of 6%, easing from 6.5% in December but missing the 5.4% anticipated by financial markets. Following the report, Federal Reserve Loretta Mester said that inflation remains too high and with the risks skewed to the upside, hinting the terminal rate could be well above 5%.

From a technical perspective, the four-hour scale RSI indicator figured 44 as of writing, showing the gold pair was surrounded by a modest headwind. As for the Bollinger Bands, the pair continued to trade in the lower area and failed to challenge the 20-period moving average several times. In our view, the downside tendency would persist in the near future unless the pair could stand firmly in the upper area.

Resistance: 1870, 1900, 1920

Support: 1830, 1800

Economic Data

CurrencyDataTime (GMT + 8)Forecast
  GBPRetail Sales (MoM) (Jan)15:00-0.30%

Trade 5 New Currency Pairs With VT Markets – February 17, 2023

Dear Client,

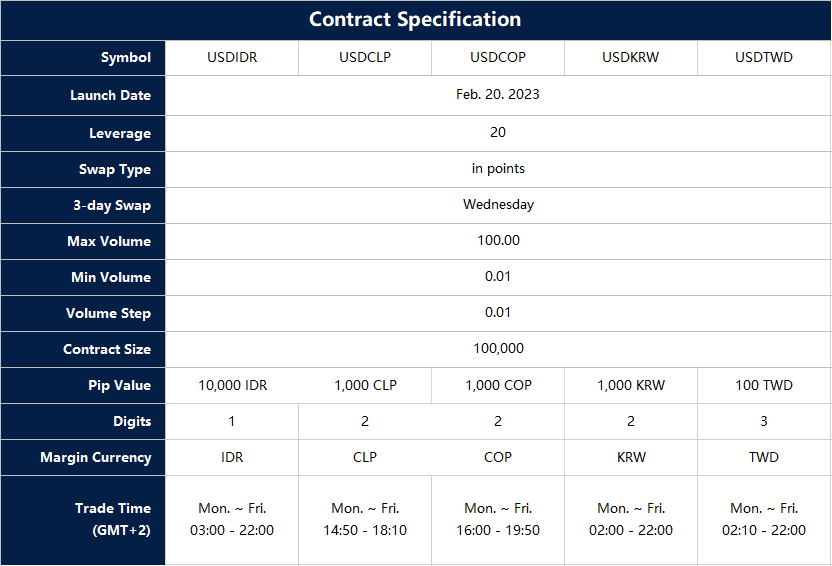
To provide you with more diverse trading options, VT Markets will launch 5 new products on 20th February 2023.

You can now trade the world’s popular products on MetaTrader 4 and 5 with the following specifications:

The above data is for reference only, please refer to the MT4 and MT5 platforms for the updated data.

For more information, please contact [email protected]

Notification of Server Upgrade – February 16, 2023

Dear Client,

As part of our commitment to provide the most reliable service to our clients, there will be server maintenance this weekend.

Maintenance Hours :
2023/02/18 02:00 – 05:00 (Server time)

Please note that the following aspects might be affected during the maintenance:

1. The price quote feature on the Client Portal will be temporarily unavailable. You will not be able to open new positions or close existing positions.

2. There might be a gap between the original price and the price after maintenance. The gaps between Pending Orders, Stop Loss, and Take Profit will be filled at the market price once the maintenance is completed.

3. Please refer to MT4/MT5 for the latest update on the completion and market opening time.

Our services will be back online once the maintenance is completed.

Thank you for your patience and understanding about this important initiative.

If you’d like more information, please don’t hesitate to [email protected]

VT Markets Announces Partnership with Acuity’s Signal Centre

VT Markets, a next-generation multi-asset broker, has announced the integration of Acuity’s Signal Centre into its platform. This new collaboration will enable VT Markets clients to benefit from the advanced artificial intelligence (AI) technology, superior design, and multilingual capabilities that Signal Centre offers.

Acquired by Acuity in 2021, Signal Centre’s Analysis IQ provides users with an experienced trading professionals’ technical view of the markets based on the intraday timeframe. Ideas are delivered by combining traditional and alternative data sets. The platform’s AI-powered approach ensures a holistic analysis of current market conditions to assist with decision-making. This combination of human-led insights with AI technology enables traders to make better-informed decisions more efficiently.

The addition of Acuity’s Signal Centre represents a significant milestone for VT Markets as it continues its mission to provide its clients with the best-in-class services and solutions available in the industry today. With this advanced technology now integrated into the VT Markets platform, clients can leverage unprecedented insights into their financial portfolios and make smarter decisions when it comes to trading any asset class they choose. 

Speaking about this partnership, a representative of VT Markets said, “We are thrilled to be able to bring this advanced technology solution to our clients to help them achieve their investment goals. Acuity’s Signal Centre is an incredibly powerful tool that will enable our clients to access sophisticated trade ideas from experienced professionals that can help them maximise their returns on investments through better decision-making.”

Andrew Lane, CEO Acuity Trading;

“We’re delighted that VT Markets has chosen to partner with Acuity Trading’s FCA authorised and regulated company Signal Centre. By integrating our AnalysisIQ platform into VT Markets’ global multi-asset brokerage, traders will be able to access high quality trading analysis, data and market expertise through powerful and intuitive visualisation tools.”

With this new partnership with Signal Centre, VT Markets has cemented itself as a major player in the trading industry. The fast-growing broker is committed to its mission to make trading easy and more accessible for everyone. 

About VT Markets

VT Markets is a regulated multi-asset broker with a presence in over 160 countries. The broker has won many international accolades including Best Customer Service and Fastest Growing Broker. Its mission is to make trading an easy, accessible, and seamless experience for everyone.

For more information, please visit www.vtmarketsmy.com or email to [email protected] 

About Acuity Trading

Acuity Trading revolutionised the online trading experience for millions of investors with the introduction of visual news and sentiment tools in 2013. Today, Acuity continues to lead the fintech market with alpha generating alternative data and highly engaging trading tools using the latest in AI research and technology. Acuity’s team of academics, scientists, news and market professionals are dedicated to delivering highly effective data products that bring value to investors of all levels and experience. Flexible delivery options include APIs, MT4/5, plug and play widgets and third party automation services. 

For further information or to request a demo, please visit www.acuitytrading.com or contact:

Meredyth Grant

Email:[email protected] 

Tel: +44 (0) 7496 725286

Follow Acuity Trading on social: 

Twitter: @acuitytrading

LinkedIn: https://www.linkedin.com/company/acuity-trading

Facebook: https://www.facebook.com/acuitytradingltd/

Weekly Dividend Adjustment Notice – February 16, 2023

Dear Client,

Please note that the dividends of the following products will be adjusted accordingly. Index dividends will be executed separately through a balance statement directly to your trading account, and the comment will be in the following format “Div & Product Name & Net Volume ”.

Please refer to the table below for more details:

The above data is for reference only, please refer to the MT4/MT5 software for specific data.

If you’d like more information, please don’t hesitate to contact [email protected]

US Retail Sales jump the most in two years

US stocks closed higher and Treasuries slid as investors picked through another batch of solid economic data to find different takeaways, even as worries mounted that it would force a hawkish response from the Federal Reserve.

The S&P 500 rose 0.3% after earlier dropping more than 0.75%. The Nasdaq 100 climbed 0.8%. Two-year Treasury yields held near 4.60%. The dollar advanced versus major peers.

US retail sales in January jumped by the most in almost two years, suggesting that solid consumer spending will keep prices elevated and increase pressure on the Fed to step up its efforts to tamp down inflation. Homebuilder sentiment rose in February by the most since mid-2020, as easing mortgage rates have boosted the housing market.

The energy was a drag on the broader market, falling 2%, driven by a slump in Devon Energy pressured by a slump in oil prices following a much larger-than-expected build in U.S. weekly crude stockpiles.

U.S. crude stockpiles rose by 16.3 million barrels last week to 471.4M barrels, well above expectations of 1.2M barrels.

Main Pairs Movement

The US Dollar firmed mid-week to a six-week high against a basket of currencies measured by the DXY index. The index has penetrated a key 103.80 level on the charts amid risks of higher inflation for longer and the markets flipping the script of the Federal Reserve pivot narrative. The index maintains erratic activity around 103.00 so far. The monthly high near 104.00 continues to cap the upside. At the time of writing, the price is trading at 103.754.

AUD/USD stands on slippery grounds as sellers rush towards the weekly low of 0.6864, marked the previous day, following a nearly 40 pips slump on the downbeat Australia inflation and employment numbers. At the time of writing, the price is trading at 0.6888.

GBP/USD continued to move lower in the second half of the day, falling below 1.2000 for the first time in a week before recovering slightly. Weak U.K. inflation data and broad-based dollar strength weighed heavily on the pair on Wednesday. At the time of writing, the price traded at 1.20389.

Technical Analysis

EURUSD (4-Hour Chart)

The EURUSD has extended its daily slide and further declined below the 1.067 level as of writing, as the US Retail Sales data rose at a stronger pace than expected in January, boosting the US Dollar and weighing on the pair. The US core retail sales surged to 2.3%, compared to the expected 0.8% and previous -0.9%, showing strong demand in the retail market. The euro price action around the European currency should continue to closely follow dollar dynamics, as well as the potential next moves from the ECB after the bank has already anticipated another 50 bps rate raise at the March event.

From the technical perspective, the four-hour scale RSI indicator further dropped to 38 figures as of writing, suggesting that the pair was surrounded by strong bearish momentum. As for the Bollinger Bands, the pair fell below the 20-period moving average and was trading in the lower area, showing an optimistic market mood. Currently, the pair were struggling to hold above a critical support level, 1.0667. The bears could target on 1.050 level once the pair lose its ground around the key support level.

Resistance: 1.0930, 1.1020

Support: 1.0667, 1.0508

GBPUSD (4-Hour Chart)

The GBPUSD continued to push lower in the American trading session and dropped below 1.2000 for the first time in a week before recovering modestly. Soft UK inflation data and the strong US dollar across the board heavily weighed on the pair. The UK’s Office for National Statistics reported on Wednesday that the Consumer Price Index declined 0.6% every month in January, causing the annual rate to retreat to 10.1% from 10.5%. The Core CPI also edged lower to 5.8% from 6.3% every year coming in lower than the market expectation of 6.2%. Although it’s too early to say how these figures could influence the Bank of England (BoE) policy outlook, the reaction suggests that markets have scaled back hawkish BoE bets.

From the technical perspective, the four-hour scale RSI indicator tumbled to 34 figures as of writing, showing the pair is amid negative traction. As for the Bollinger Bands, the pair was supported by the lower band and the size between the upper and lower bands got larger, indicating there might be a further decline once the pair fell below the lower band.

Resistance: 1.2209, 1.2265, 1.2391

Support: 1.1927, 1.1859

XAUUSD (4-Hour Chart)

Gold price dropped sharply towards $1,830 on Wednesday as the US dollar regather strength and the benchmark 10-year US Treasury bond yield keeps rallying, which exerted heavy pressure on Gold prices. At the time of writing, the pair is trading at $1,837.59, posting a 0.87% loss daily, while the US dollar index rose 0.57% to 103.86 and the benchmark 10-year US Treasury bond yield rose 1.49% to 3.803%, capping any rebound on Gold price.

For the technical aspect, RSI indicator 35 figures as of writing, keeps going South as the price continues on its downward movement in the near term. As for the Bollinger Bands, the price is falling between the downward moving average and the lower band, which is a typical pattern of a downtrend. A continued bearish trend could be expected. In conclusion, we think the market is in bearish mode as both indicators show bearish potential. Besides, the price is edging lower and keeps forming a lower-low technical pattern, which favors the bearish side. For the downtrend scenario, the price is testing the support level at $1,830. If the price is below the level, it may trigger some technical selling and drag the price deeper toward the next critical support at a round-figure mark of $1,800.

Resistance: 1900, 1920, 1957

Support: 1830, 1800

Economic Data

CurrencyDataTime (GMT + 8)Forecast
AUDEmployment Change (Jan)08:3020.0K
USDBuilding Permits (Jan)21:301.350M
USDInitial Jobless Claims21:30200K
USDPhiladelphia Fed Manufacturing Index (Feb)21:30-7.4
USDPPI (MoM) (Jan)21:300.40%

Trade US CFD Shares with 1:33 leverage – February 15, 2023

Dear Client,

To provide you with a better trading condition, VT Markets will increase the leverage for US CFD Shares on 20 February 2023.

The above data is for reference only, please refer to the MT4/MT5 software for specific data.

Please note:

1. Other contract specifications will remain the same as before.

2. Clients can continue to hold their open positions during the optimisation.

3. This optimisation might affect the margin level. Please ensure you have enough funds in your account to cover any additional margin requirements.

If you’d like more information, please don’t hesitate to contact [email protected].

Back To Top
server

Hai 👋

Bagaimana saya boleh membantu?

Segera berbual dengan pasukan kami

Chat Langsung

Mulakan perbualan secara langsung melalui...

  • Telegram
    hold Ditangguh
  • Akan datang...

Hai 👋

Bagaimana saya boleh membantu?

telegram

Imbas kod QR dengan telefon pintar anda untuk mula berbual dengan kami, atau klik di sini.

Tidak ada aplikasi Telegram atau versi Desktop terpasang? Gunakan Web Telegram sebaliknya.

QR code