PMI Perkhidmatan S&P Global AS bagi Mac dicatat pada 51.1. Ini berada di bawah jangkaan 51.7.
Bacaan melebihi 50 menunjukkan sektor perkhidmatan sedang berkembang. Jurang berbanding unjuran ialah 0.6 mata.
PMI Perkhidmatan Isyarat Ekonomi Semakin Sejuk
Kegagalan PMI Perkhidmatan Mac, apabila masuk pada 51.1 berbanding jangkaan 51.7, merupakan isyarat jelas bahawa ekonomi AS sedang menyejuk lebih pantas daripada yang dijangkakan. Ini susulan data jualan runcit yang lebih lemah daripada jangkaan yang kita lihat hanya dua minggu lalu. Bagi kami, data ini mengukuhkan pandangan bahawa momentum ekonomi dari akhir 2025 semakin pudar.
Perlambatan ini merumitkan kedudukan Rizab Persekutuan (Fed), terutamanya apabila data PCE Februari terbaru menunjukkan inflasi teras kekal degil pada 2.8%. Namun, pasaran kini mempertaruhkan perubahan hala tuju dasar untuk menyokong ekonomi. Kita telah melihat niaga hadapan Fed funds segera diselaraskan semula, menunjukkan kebarangkalian melebihi 70% bagi pemotongan kadar menjelang mesyuarat Julai, meningkat daripada sekitar 55% hanya minggu lalu.
Ketidakpastian yang semakin meningkat ini mencetuskan lonjakan volatiliti pasaran. Indeks Volatiliti CBOE (VIX) уже meningkat melepasi 17, paras yang tidak kita lihat sejak kegusaran perbankan tahun lalu. Ini mencadangkan pedagang perlu mempertimbangkan pembelian perlindungan, sama ada melalui opsyen panggilan VIX atau membeli opsyen jual (put) ke atas indeks pasaran yang luas.
Memandangkan prospek ekonomi yang semakin lemah, kita wajar memposisikan untuk risiko penurunan dalam ekuiti. Ini bermakna membeli opsyen put ke atas S&P 500, dengan tempoh luput pada Mei atau Jun, bagi melindung nilai daripada pembetulan berpotensi. Sebaliknya, kebarangkalian pemotongan kadar yang meningkat menjadikan bon Perbendaharaan tempoh matang panjang lebih menarik, maka kita patut mempertimbangkan untuk membina posisi panjang menggunakan opsyen panggilan pada ETF bon seperti TLT.
Kita juga wajar menjangkakan putaran kepimpinan pasaran menjauhi sektor berorientasikan pertumbuhan. Saham pengguna budi bicara dan teknologi, yang menerajui rali pada 2025, khususnya terdedah kepada perlambatan perbelanjaan dan pelaburan. Kami melihat nilai dalam beralih ke sektor defensif seperti utiliti dan penjagaan kesihatan, yang secara sejarahnya mengatasi prestasi semasa tempoh ketidakpastian ekonomi.
Putaran Sektor Ke Arah Kedudukan Defensif
Mula berdagang sekarang – Klik di sini untuk membuat akaun sebenar VT Markets
PMI Komposit S&P Global Amerika Syarikat susut kepada 51.4 pada Mac daripada 51.9 pada bulan sebelumnya.
Bacaan melebihi 50 menunjukkan pengembangan, manakala bacaan di bawah 50 menunjukkan penguncupan.
Implikasi Untuk Penentududukan Jangka Terdekat
Penurunan kepada 51.4 ini, walaupun masih menunjukkan pertumbuhan, memberi isyarat kehilangan momentum ekonomi. Bagi kami, ini mencadangkan trend menaik yang kukuh mungkin sedang mendatar, sekali gus menjadikan pertaruhan kenaikan yang agresif lebih berisiko dalam tempoh terdekat. Kini, kami perlu mengalihkan fokus daripada hala tuju semata-mata kepada strategi yang mengambil kira potensi peningkatan pergerakan pasaran yang tidak menentu.
Titik data yang lebih sejuk ini memberi tekanan kepada Rizab Persekutuan untuk mempertimbangkan pendirian yang lebih dovish, walaupun data CPI teras terkini bagi Februari 2026 masih berada pada 3.1%. Kebarangkalian pemotongan kadar pada mesyuarat Julai, seperti ditunjukkan oleh alat CME FedWatch, berkemungkinan meningkat daripada paras semasa 65% dalam beberapa hari akan datang. Kami akan memantau niaga hadapan kadar faedah dengan rapat bagi melihat reaksi terhadap berita ini.
Dengan ketidaktentuan yang meningkat, kami menjangkakan peningkatan volatiliti pasaran. Indeks VIX diniagakan berhampiran paras rendah 15, menjadikan opsyen put perlindungan pada S&P 500 dan Nasdaq 100 relatif murah. Membeli call VIX atau mewujudkan straddle pada indeks utama boleh menjadi cara yang berkesan untuk mengambil posisi bagi pergerakan pasaran yang lebih besar.
Memandangkan potensi kenaikan yang terhad, kami melaraskan strategi indeks ekuiti kami. Kami mempertimbangkan untuk menjual call spread “out-of-the-money” pada ETF SPY bagi menjana pendapatan dalam pasaran yang mendatar atau sedikit menurun. Ini merupakan pendekatan yang lebih berhati-hati berbanding strategi yang kami gunakan semasa tempoh pertumbuhan lebih kukuh pada hujung 2025.
Putaran Sektor Dan Idea Opsyen
Perlahanannya ekonomi ini juga mencadangkan putaran daripada sektor kitaran kepada sektor defensif. Kami melihat pendekatan yang sama berkesan semasa kelembapan pertengahan 2025, apabila utiliti dan barangan pengguna asas mencatat prestasi lebih baik. Oleh itu, kami sedang meneliti untuk membina posisi call panjang dalam ETF seperti XLU dan XLP, sambil mempertimbangkan opsyen put pada sektor yang lebih sensitif seperti pengguna diskresionari.
Mula berdagang sekarang – Klik di sini untuk membuat akaun sebenar VT Markets
Vertex Pharmaceuticals Incorporated (VRTX) ialah syarikat bioteknologi yang beroperasi di Amerika Syarikat, Eropah dan pasaran antarabangsa lain. Ia diniagakan di Nasdaq di bawah kod ticker “VRTX” dan berada dalam sektor Penjagaan Kesihatan – Biotek.
Carta mingguan digambarkan sebagai menaik selagi harga kekal di atas paras rendah Ogos 2025. Pergerakan melepasi paras tinggi November 2024 dikatakan mengesahkan rali dalam gelombang (III).
Gelombang ((I)) diletakkan pada $306.08 pada Julai 2020 dan gelombang ((II)) pada $176.36 pada Oktober 2021. Dari situ, (I) bagi ((III)) berakhir pada $519.88 pada November 2024, dan (II) berakhir pada $362.50 pada Ogos 2025.
Di dalam (I), parasnya ialah: I $292.75, II $233.01, III $510.63, IV $447.70, V $519.88. Di dalam III, ((1)) $324.75, ((2)) $282.21, ((3)) $448.40, ((4)) $391.01, ((5)) $510.63.
Gelombang (II) dilabel sebagai double three: w $377.85 pada Disember 2024, x $519.68 pada Mac 2025, y $362.50 pada Ogos 2025. Selepas itu, ((1)) berakhir pada $507.92, dan ((2)) dipetakan sebagai pembetulan 3- atau 7-ayunan dengan $463.78 sebagai paras tinggi rujukan, manakala penembusan di bawah paras rendah Ogos 2025 dikemukakan sebagai kes risiko alternatif.
Bagi minggu-minggu akan datang, kami menjangkakan potensi lantunan singkat, namun ini berkemungkinan perangkap sebelum satu lagi pergerakan menurun. Pedagang boleh mempertimbangkan untuk menjual call credit spreads dengan harga strike di atas paras rintangan $465 untuk memanfaatkan kegagalan yang dijangka ini. Strategi ini mendapat manfaat daripada penurunan harga dan susut nilai masa sepanjang tempoh pembetulan ini.
Peluang utama terletak pada jangkaan penamat keseluruhan urutan pembetulan ini. Apabila saham menghampiri paras rendah yang diunjurkan, menjual cash-secured puts dengan harga strike dalam julat $380-$400 boleh menjadi strategi berkesan. Ini membolehkan pedagang mengutip premium sambil menunggu titik kemasukan yang lebih menarik untuk posisi menaik jangka panjang.
Mula berdagang sekarang – Klik di sini untuk membuat akaun sebenar VT Markets
Saham Kraft Heinz Company (KHC) telah susut ke paras terendah berbilang tahun dan kini didagangkan berhampiran paras rendah pivot Covid Mac 2020 sekitar $20 sesaham. Julat harga yang disebut untuk membeli ialah $20–$21.
Paras rendah pivot Mac 2020 dihuraikan sebagai membentuk “double bottom”, yang dalam analisis teknikal boleh menunjukkan potensi lantunan semula. Saham ini juga dikatakan menyentuh garisan trend menurun yang bermula pada Jun 2025 dan melalui paras rendah Januari 2026, dengan sentuhan-sentuhan sebelum ini diikuti lantunan.
Kraft Heinz dinyatakan menawarkan hasil dividen 7.54%. Ini bermaksud pemegang akan menerima pendapatan sebanyak 7.54% sepanjang tempoh memiliki saham tersebut.
Teks turut merujuk kepada saham ini mempunyai nisbah P/E yang rendah dan membandingkannya dengan saham teknologi dan berfokus AI dalam pasaran menurun bagi teknologi. Ia meletakkan KHC sebagai pilihan bukan-AI yang berada sekitar sokongan berasaskan carta serta pendapatan dividen.
Dengan saham Kraft Heinz menguji paras pivot penting $20 yang pertama kali dilihat semasa panik COVID pada Mac 2020, kita melihat formasi “double bottom” yang klasik. Corak teknikal ini mencadangkan saham telah menemui sokongan kukuh dan berpotensi untuk membuat lantunan. Bagi pedagang derivatif, ini memberi isyarat peluang untuk memposisikan diri bagi pergerakan menaik dalam minggu-minggu akan datang.
Memandangkan saham berada pada paras sokongan utama, menjual put bersandarkan tunai (cash-secured puts) merupakan strategi yang menarik untuk **Tinjauan Mingguan**. Kita boleh mempertimbangkan menjual put April atau Mei 2026 dengan harga mogok sekitar $20. Ini membolehkan kita mengutip premium sambil bertaruh bahawa paras rendah berbilang tahun ini akan kekal sebagai lantai.
Keuntungan dividen yang tinggi pada 7.54% menyediakan satu lagi lapisan sokongan kepada harga saham. Jika put kita ditetapkan (assigned), kita akan memperoleh saham pada harga efektif di bawah pasaran semasa dan mula mengutip dividen yang besar itu. Ini menjadi insentif yang kuat, khususnya ketika sektor barangan pengguna asas (consumer staples) secara keseluruhan mengatasi prestasi saham teknologi yang masih bergelut setakat 2026.
Mula berdagang sekarang – Klik di sini untuk membuat akaun sebenar VT Markets
TD Securities berkata larian kenaikan emas semakin kehilangan sokongan apabila pembelian sektor rasmi semakin lemah. Firma itu mengaitkannya dengan kejutan tenaga yang dihadapi pengimport tenaga Asia dan pengeluar Timur Tengah, yang boleh mengurangkan lebihan serta pembelian emas.
Nota itu turut merujuk kepada laporan bahawa Turkiye telah mempertimbangkan penggunaan rizab emas untuk menyokong lira. Ia menambah bahawa halangan terhadap permintaan sektor rasmi adalah yang paling mencabar sejak tempoh Rusia-Ukraine.
Permintaan Sektor Rasmi Melemah
TD berkata penyertaan institusi dan runcit dalam emas sudah pun tinggi. Ia juga berkata dagangan “penyusutan nilai” (debasement) semakin pudar, dengan jangkaan pengurangan kadar faedah Rizab Persekutuan AS yang lebih sedikit, tiada pertumbuhan lebihan bekalan wang, serta kebimbangan yang lebih rendah terhadap kebebasan Fed yang dikaitkan dengan keputusan Mahkamah Agung berkaitan perbicaraan Lisa Cook.
TD menyifatkan kekuatan harga terkini dipacu oleh gelombang pembelian berturut-turut daripada kumpulan modal yang berbeza. Ia berkata situasi ini meningkatkan risiko “washout” kedudukan.
Simulasi TD menunjukkan banyak senario boleh mencetuskan jualan CTA pada minggu hadapan. Ia berkata ini akan melibatkan algoritma mengurangkan kedudukan panjang buat kali pertama sejak Februari 2024.
Risiko “Washout” Kedudukan Meningkat
Aliran menaik emas kelihatan semakin rapuh apabila pembeli utama menunjukkan tanda-tanda keletihan. Kos tenaga yang melambung, dengan minyak mentah kembali melepasi paras AS$95 setong pada awal 2026, menekan kedudukan kewangan pengimport utama di Asia. Ini mengurangkan dengan ketara lebihan tunai yang dimiliki bank pusat mereka untuk meneruskan pembelian emas pada kadar agresif seperti yang dilihat sepanjang 2024 dan 2025.
Perlahanannya permintaan rasmi semakin jelas, dengan laporan terkini menunjukkan pembelian bersih bank pusat pada suku terakhir 2025 adalah yang terendah dalam lebih dua tahun. Negara yang berdepan kejutan ekonomi domestik juga kurang berkemungkinan menjadi pembeli dan mungkin mempertimbangkan penjualan rizab untuk menstabilkan mata wang masing-masing. Faktor-faktor ini menghakis satu tonggak sokongan utama yang memacu pasaran.
Dari sudut penentududukan, dagangan ini terlalu sesak, sekali gus meninggalkan ruang yang kecil untuk pembeli baharu menolak harga lebih tinggi. Keadaan ini pernah berlaku sebelum ini, apabila pegangan institusi yang berat mendahului pembetulan mendadak apabila naratif berubah. Pedagang derivatif perlu ambil perhatian bahawa dana ikut-trend dipacu komputer (CTA) kini berisiko melupuskan kedudukan bullish besar yang dipegang sejak rali benar-benar bermula pada Februari 2024.
Mula berdagang sekarang – Klik di sini untuk membuat akaun sebenar VT Markets
EU telah menandatangani perjanjian perdagangan bebas dengan Australia ketika ia berusaha meluaskan hubungan ekonomi dalam persekitaran risiko geopolitik. Perjanjian itu menyusuli persetujuan dengan Mercosur, India dan Indonesia, dan masih memerlukan kelulusan daripada Parlimen Eropah.
Perjanjian tersebut merangkumi pemotongan tarif dan kuota yang lebih tinggi bagi beberapa produk tenusu, selain daging lembu dan daging biri-biri. Ia juga melindungi nama produk bergeografi, yang mempengaruhi cara sesetengah makanan boleh dipasarkan.
Implikasi Perdagangan Dan Keselamatan
Suruhanjaya Eropah menganggarkan perjanjian itu boleh meningkatkan perdagangan dua hala tahunan sekitar €20 bilion dalam tempoh sedekad akan datang. Perjanjian itu turut merangkumi perkongsian keselamatan dan pertahanan serta peruntukan yang dikaitkan dengan akses kepada bahan mentah kritikal Australia.
Artikel ini diterbitkan menggunakan alat Kecerdasan Buatan dan disemak oleh seorang editor.
EU jelas sedang berusaha mengukuhkan rantaian bekalannya, dan perjanjian perdagangan baharu dengan Australia ini merupakan komponen utama strategi tersebut. Walaupun perjanjian itu menyebut pertanian, fokus sebenar ialah keselamatan geopolitik dan bahan mentah kritikal. Bagi kami, ini mewujudkan peluang yang jelas dalam derivatif komoditi dan ekuiti tertentu dalam beberapa minggu akan datang apabila pasaran menghadam perinciannya.
Kami menjangkakan tekanan penurunan terhadap pengeluar pertanian Eropah, khususnya dalam sektor daging lembu dan tenusu, berikutan peningkatan kuota Australia. Kami pernah melihat apa yang berlaku kepada niaga hadapan daging lembu pada 2025 apabila perjanjian Mercosur akhirnya diratifikasi, yang menyebabkan penurunan sementara dalam saham pengeluar Eropah. Sehubungan itu, membeli opsyen put ke atas beberapa pengeluar makanan Eropah terpilih boleh menjadi langkah jangka pendek yang berhemah untuk melindung nilai daripada persaingan yang bakal meningkat ini.
Bahan Mentah Kritikal Dan Kedudukan Pasaran
Sudut paling signifikan ialah akses yang dipertingkat kepada bahan mentah kritikal Australia, seperti litium dan unsur nadir bumi. Australia kekal sebagai pengeluar litium terbesar dunia, dengan angka kerajaan bagi tahun fiskal 2024-2025 menunjukkan eksport bahan itu meningkat lebih 30%. Menjamin bekalan ini merupakan kemenangan strategik besar bagi industri EU dan mengurangkan risiko kesesakan utama.
Kita seharusnya meneliti opsyen call ke atas syarikat sumber utama Australia, kerana akses jangka panjang mereka ke pasaran EU yang besar kini lebih terjamin. Ini juga membantu pengeluar EV dan bateri Eropah, yang sebelum ini bergelut dengan kos input yang tidak menentu. Memandangkan sifat keselamatan bekalan ini yang berjangka panjang, opsyen call bertempoh lebih panjang ke atas nama-nama perindustrian EU ini juga mungkin menarik.
Perjanjian ini juga berkemungkinan memberi kesan kepada pasangan mata wang EUR/AUD, kerana perdagangan yang meningkat serta lebih terjamin sepatutnya memihak kepada ekonomi Australia. Dolar Australia sudah pun menunjukkan pengukuhan kecil kepada 1.64 berbanding Euro sepanjang bulan lalu susulan khabar angin awal berkaitan perdagangan. Kita mungkin melihat dolar Aussie mengukuh lagi, menjadikan opsyen yang bertaruh pada trend ini wajar dipertimbangkan.
Mula berdagang sekarang – Klik di sini untuk membuat akaun sebenar VT Markets
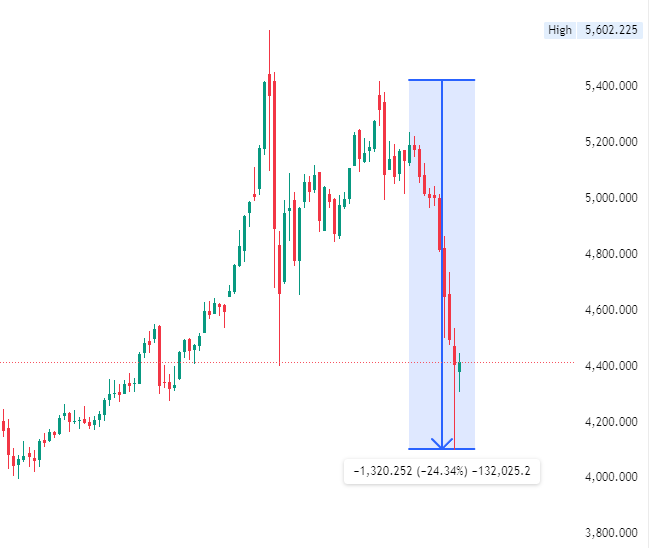
Pada 2026, emas kerap menyusut ketika pasaran dilanda ketakutan apabila institusi menjual aset paling cair untuk mendapatkan tunai dengan pantas.
Dolar kekal sebagai halangan utama jangka pendek, menekan harga emas apabila modal global mengalir ke aset selamat berdenominasi dolar.
Pemain berskala besar melihat penurunan mendadak sebagai titik pengumpulan strategik, bukannya isyarat untuk keluar pasaran.
Kos tenaga dan harga minyak yang kekal tinggi mengembalikan isu inflasi jangka panjang yang secara asasnya menyokong emas.
Bank pusat secara konsisten mengalihkan rizab daripada mata wang fiat, mengekalkan asas kukuh untuk ‘reset’ ke paras $5,000.
Reset $5,000: Adakah Rali Emas 2026 Baru Bermula?
Pergerakan harga emas pada 2026 agak tidak menentu dan membuat ramai keliru. Walaupun persekitaran makro dengan ketegangan geopolitik serta pertumbuhan global yang perlahan memberi isyarat potensi kenaikan lanjut, emas secara mengejut merosot ketika episod risk-off. Untuk memahaminya, perlu melihat melangkaui hingar jangka pendek kepada reset struktur yang sedang berlaku.
Secara tradisi, emas cenderung meningkat apabila ketakutan dan ketidaktentuan memasuki pasaran. Namun, dalam beberapa bulan kebelakangan ini, jualan besar-besaran aset berisiko tidak semestinya diterjemahkan kepada kekuatan emas serta-merta. Ini berpunca daripada dinamik kecairan, bukannya keruntuhan peranan emas sebagai aset selamat.
Apabila pasaran beralih kepada risk-off secara mendadak, institusi lazimnya memburu kecairan. Ini bermakna mereka menjual apa yang boleh dijual, bukan semestinya apa yang mereka mahu jual. Emas ialah antara aset global paling cair dan mudah dicairkan, lalu menjadi sumber tunai pantas. Dalam detik ini, ia lebih berperanan sebagai alat pembiayaan berbanding lindung nilai atau penyimpan nilai.
Selain itu, risiko panggilan margin merentasi ekuiti dan derivatif meningkat, menyebabkan pemain besar perlu menutup posisi secara meluas. Emas terperangkap dalam kitaran pelupusan merentas aset ini, menghasilkan tekanan menurun jangka pendek walaupun persekitarannya secara asas bersifat menaik untuk emas.
Bagi pelabur runcit, keadaan ini mengelirukan kerana ia menyimpang daripada norma yang sering dijangka. Namun realitinya, fasa awal ketakutan lazimnya ialah pelupusan, bukan pengumpulan.
USD dan Bom Jangka Fiskal
USD kekal sebagai pemboleh ubah dominan jangka pendek, kerana permintaan global terhadap keselamatan sering mengalir terlebih dahulu ke aset berdenominasi dolar, mengetatkan kecairan dan menekan harga emas. Namun, kekuatan ini lazimnya bersifat sementara. Selepas ketegangan kecairan awal reda, institusi kerap beralih semula kepada emas sebagai lindung nilai strategik terhadap ketidakstabilan monetari dan penyusutan nilai mata wang.
Walaupun USD menawarkan perlindungan segera, tekanan fiskal jangka panjang di ekonomi utama mengehadkan keupayaan pembuat dasar untuk mengekalkan keadaan monetari ketat tanpa had. Ini mewujudkan persekitaran fiskal di mana emas akhirnya mengatasi mata wang fiat sebagai aset teras strategik.
Salah satu jurang paling jelas dalam pasaran emas kini ialah antara kedudukan institusi dan sentimen runcit.
Pelabur runcit sering bertindak secara emosi terhadap turun naik harga. Penurunan mendadak mencetuskan ketakutan, menyebabkan ramai keluar posisi terlalu awal kerana merasakan rali sudah berakhir.
Sebaliknya, institusi beroperasi dengan horizon masa lebih panjang dan strategi peruntukan aset. Mereka melihat penurunan sebagai peluang untuk mengumpul pada paras lebih baik, bukannya isyarat kegagalan. Mereka menilai prospek makro yang lebih luas dengan mengambil kira kadar faedah sebenar, dasar bank pusat, dan jangkaan inflasi jangka panjang.
Institusi tidak melihat volatiliti sebagai ancaman, sebaliknya sebahagian daripada kitaran pasaran.
Minyak Sebagai Penunjuk Inflasi Utama
Walaupun minyak dan emas kedua-duanya komoditi, pemacu utama bagi setiap satunya berbeza dengan ketara.
Minyak berkait rapat dengan aktiviti ekonomi serta dinamik penawaran-permintaan, manakala emas didorong oleh keadaan monetari dan psikologi pelabur.
Hubungan yang wujud adalah melalui inflasi. Kenaikan harga minyak boleh menyumbang kepada jangkaan inflasi yang lebih tinggi, sekali gus menyokong emas. Apabila kos tenaga melonjak, bank pusat berdepan tekanan meningkat, yang sering membawa kepada perubahan dasar yang memihak kepada emas dari semasa ke semasa.
The spike in oil prices caused by the war in Iran has led markets to price in rate hikes from the ECB and Bank of England, with the BoE potentially raising rates four times this year pic.twitter.com/lD1Du1jphc
Sebelum konflik di Timur Tengah, tempoh penurunan harga minyak menandakan permintaan global yang melemah, mencetuskan sentimen risk-off yang, seperti dinyatakan, pada peringkat awal boleh menekan emas akibat jualan didorong kecairan.
Harga minyak yang kekal tinggi, seperti yang kita lihat sejak perang bermula, boleh menghidupkan semula isu inflasi bagi bank pusat, yang dalam jangka panjang berpotensi menyokong emas.
Justeru, walaupun minyak tidak memacu emas secara langsung, ia mempengaruhi latar makro dengan ketara, yang seterusnya memberi kesan kepada harga emas.
Adakah 2026 Masih Tahun ‘Bull’?
Adakah 2026 masih tahun ‘bull’? Walaupun volatiliti berterusan, hujah bagi reset $5,000 disokong oleh bank pusat yang mengurangkan pergantungan kepada mata wang fiat dan hakisan berterusan pulangan sebenar. Penurunan semasa dilihat sebagai sebahagian daripada kitaran pelupusan dan reset yang membolehkan pasaran membina asas yang lebih kukuh.
Abaikan Hinggar Pelupusan: Fahami bahawa kejatuhan harga awal ketika krisis sering didorong jualan terpaksa, bukan kehilangan nilai.
Perhatikan Kadar Sebenar: Jangkaan inflasi terus menghakis pulangan sebenar, menjadikan ketiadaan hasil pada emas kurang relevan berbanding penyusutan kuasa beli mata wang fiat.
Ikuti Institusi: Anggap penurunan mendadak sebagai titik pengumpulan strategik, seiring tingkah laku bank pusat dan pengurus peruntukan profesional.
Mula berdagang sekarang – Klik di sini untuk membuat akaun sebenar VT Markets
Bacaan indeks Redbook Amerika Syarikat (tahun ke tahun) ialah 6.7% pada 20 Mac.
Bacaan sebelumnya ialah 6.4%.
Perbelanjaan Pengguna Memecut
Peningkatan Indeks Redbook kepada 6.7% memberi isyarat bahawa perbelanjaan pengguna bukan sekadar kekal kukuh; malah ia sedang memecut. Kekuatan berterusan ini meningkatkan tekanan terhadap Rizab Persekutuan (Fed), menjadikan lebih sukar untuk mereka mewajarkan sebarang pemotongan kadar faedah dalam masa terdekat. Kini, mesyuarat Fed pada April dilihat berkemungkinan besar mengekalkan kadar, dengan pasaran niaga hadapan pantas menolak keluar kebarangkalian pemotongan kadar sebelum suku ketiga.
Kebimbangan inflasi yang kembali memuncak ini mencadangkan pedagang mempertimbangkan posisi menurun (bearish) pada produk kadar faedah. Kita telah melihat hasil nota Perbendaharaan 10 tahun meningkat semula menghampiri 4.5% bulan ini, paras yang tidak dilihat sejak lewat tahun lalu. Membeli opsyen put pada ETF bon tempoh panjang atau terus melakukan posisi jual (short) pada niaga hadapan Perbendaharaan boleh menjadi cara langsung untuk berdagang berdasarkan jangkaan kadar kekal tinggi lebih lama.
Bagi ekuiti, ini mewujudkan pasaran yang terbahagi. Perbelanjaan pengguna yang kukuh jelas positif untuk saham runcit dan budi bicara pengguna (consumer discretionary), menyokong kes untuk opsyen panggilan (call) pada ETF khusus sektor. Ini selari dengan laporan pekerjaan terkini pada awal Mac, yang menunjukkan kekuatan mengejutkan dalam sektor perkhidmatan dengan lebih 250,000 pekerjaan ditambah.
Namun, prospek kadar faedah tinggi yang berpanjangan menjadi halangan (headwind) kepada sektor pertumbuhan dan teknologi yang sensitif kepada kos pinjaman. Jika dilihat semula, kita menyaksikan dinamik serupa pada lewat 2025 apabila data ekonomi yang kukuh berulang kali menangguhkan perubahan hala tuju (pivot) Fed, menyebabkan prestasi saham teknologi jauh ketinggalan. Ini mencadangkan pendirian berhati-hati atau malah opsyen put perlindungan pada bahagian pasaran yang sensitif kepada kadar faedah.
Kekuatan Dolar Jadi Tumpuan
Dalam pasaran mata wang, Fed yang lebih hawkish adalah positif (bullish) untuk dolar AS. Indeks Dolar (DXY) telah pun menembusi paras 105 minggu ini, bertindak balas terhadap jurang perbezaan kadar faedah yang semakin melebar dengan Eropah, di mana data terkini adalah lebih lemah. Posisi panjang (long) dolar berbanding mata wang yang mempunyai bank pusat lebih dovish kelihatan semakin menarik dalam beberapa minggu akan datang.
Mula berdagang sekarang – Klik di sini untuk membuat akaun sebenar VT Markets
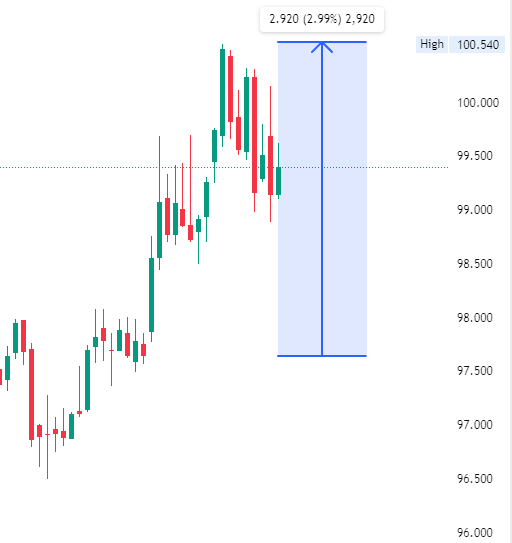
GBP/USD berada di bawah tekanan jualan pada Selasa selepas mencatat kenaikan sederhana pada Isnin, apabila Dolar AS melantun semula dan data awal PMI S&P Global UK hadir lebih lemah daripada jangkaan. Pasangan itu didagangkan berhampiran 1.3395 pada awal sesi AS, manakala Indeks Dolar AS berada sekitar 99.40.
Sentimen pasaran turut melemah apabila penghindaran risiko meningkat susulan konflik Iran. Laporan Wall Street Journal menyebut negara-negara Teluk yang sejajar dengan AS semakin hampir kepada penglibatan secara langsung, dengan Arab Saudi memberi isyarat kemungkinan perubahan pendirian ketenteraan.
Konflik Timur Tengah Dan Sentimen Risiko
Israel melancarkan satu lagi serangan ke atas Iran selepas Presiden AS Donald Trump memberi petunjuk tentang jeda serangan ke atas infrastruktur tenaga. Menteri Luar Iran Abbas Araghchi berkata tiada sebarang penglibatan dengan Washington, dan Speaker Parlimen Mohammad Bagher Ghalibaf berkata pada Isnin bahawa tiada rundingan berlangsung.
Angka PMI UK menunjukkan aktiviti perniagaan yang lebih perlahan pada Mac. PMI Komposit susut kepada 51.0 daripada 53.7 berbanding 52.8 dijangka; perkhidmatan turun kepada 51.2 daripada 53.9 berbanding 53.0 ramalan; pembuatan menyederhana kepada 51.4 daripada 51.7, mengatasi anggaran 51.1.
Tumpuan beralih kepada data awal PMI AS lewat Selasa, diikuti CPI dan PPI UK pada Rabu. BoE mengekalkan kadar pada 3.75%, manakala Fed mengekalkan kadar tidak berubah dalam julat 3.50%–3.75%.
Tinjauan Perbezaan Makro Dan Dasar
Konflik ketenteraan langsung melibatkan Iran, yang kita lihat meningkat tahun lalu, kini telah mereda menjadi kebuntuan tegang, walaupun retorik kekal panas. Harga minyak, selepas melonjak melepasi AS$110 setong pada pertengahan 2025, telah stabil, dengan Brent Crude kebelakangan ini didagangkan dalam julat sekitar AS$90 setong. Jumlah penghantaran melalui Selat Hormuz beroperasi pada kira-kira 90% daripada paras sebelum konflik, namun premium insurans yang lebih tinggi kini menjadi ciri kekal pasaran.
Berbeza dengan perlahan yang kita lihat pada Mac 2025 apabila PMI Komposit mencecah paras terendah enam bulan pada 51.0, ekonomi UK menunjukkan daya tahan yang lebih baik. PMI Komposit S&P Global terkini bagi Februari 2026 mencatat 53.0, menunjukkan pengembangan yang stabil dalam sektor perkhidmatan. Peningkatan ini berlaku ketika Indeks Harga Pengguna (CPI) utama telah menurun dengan ketara, dengan data terkini menunjukkan inflasi pada 3.4%.
Data yang berkembang ini meletakkan Bank of England dalam kedudukan baharu. Selepas mengekalkan kadar pada 3.75% ketika kemuncak ketidaktentuan tahun lalu, BoE kini secara meluas dijangka memulakan kitaran pelonggaran untuk menyokong ekonomi. Pasaran dilihat telah mengambil kira jangkaan ini, dengan Overnight Index Swaps menunjukkan kebarangkalian melebihi 75% untuk pemotongan kadar 25 mata asas pada mesyuarat Jun.
Sebaliknya, Rizab Persekutuan berdepan gambaran berbeza, apabila inflasi teras di AS terbukti lebih degil, baru-baru ini dicatat pada 3.2% bagi Februari 2026. Ketegaran ini, digabungkan dengan pasaran buruh yang kukuh, mencadangkan Fed berkemungkinan mengekalkan kadar penanda aras tidak berubah untuk tempoh lebih lama berbanding BoE. Perbezaan dasar yang semakin melebar ini kian menjadi pemacu utama pasaran pertukaran asing.
Dengan latar ini, pedagang wajar mempertimbangkan posisi untuk kelemahan GBP/USD selanjutnya didorong oleh jurang perbezaan kadar faedah yang semakin melebar. Menggunakan instrumen derivatif seperti opsyen put 3 bulan pada GBP/USD membolehkan pendekatan risiko-terhad terhadap pandangan ini. Bagi mereka yang mengurus pendedahan kadar faedah, mengambil posisi dalam niaga hadapan SONIA untuk mencerminkan jangkaan pemotongan kadar BoE dilihat sebagai dagangan konsensus.
Mula berdagang sekarang – Klik di sini untuk membuat akaun sebenar VT Markets
Harga tembaga di LME susut kira-kira 1% hari ini, memadam sebahagian kenaikan pada Isnin. Kenaikan pada Isnin itu susulan Presiden Trump menangguhkan sementara rancangan serangan AS ke atas infrastruktur tenaga Iran.
Harga kemudian melemah selepas Tehran menafikan sebarang rundingan yang sedang berlangsung. Tembaga turun kira-kira 10% bulan ini.
Kejatuhan bulanan itu mencetuskan semula pembelian dari China. Data Mysteel menunjukkan inventori turun 78,700 tan minggu lalu kepada 486,200 tan, penurunan mingguan terbesar tahun ini.
Laporan itu menyatakan keadaan ini mencerminkan permintaan fizikal yang lebih kukuh selepas pembetulan harga baru-baru ini. Artikel ini diterbitkan dengan bantuan alat AI dan disemak oleh editor.
Kita mengimbas kembali pada 2025 bagaimana “bunyi” geopolitik, seperti penangguhan sementara rancangan serangan AS-Iran, mewujudkan volatiliti jangka pendek dalam tembaga. Kejatuhan harga 10% selepas itu disambut lonjakan pembelian dari China, diserlahkan oleh pengeluaran inventori terbesar pada tahun tersebut. Tempoh itu menunjukkan bagaimana permintaan fizikal boleh menjadi lantai harga ketika pembetulan berlaku.
Pasaran hari ini jauh lebih ketat, dengan harga tembaga kebelakangan ini didagangkan melebihi AS$9,000 setan metrik di tengah gangguan bekalan yang berterusan. Inventori gudang LME berlegar sekitar hanya 112,000 tan, jauh lebih rendah berbanding penampan hampir 500,000 tan yang dilihat sebelum pengeluaran besar pada 2025. Ini menjadikan pasaran lebih terdedah kepada sebarang kejutan dari sisi permintaan.
Permintaan China juga menunjukkan tanda pemulihan, apabila PMI pembuatan Caixin baru-baru ini meningkat kepada 50.9, menandakan pengembangan aktiviti. Ini bukan pemburuan murah secara oportunistik seperti pada 2025, tetapi kembalinya permintaan secara asas ke dalam pasaran yang mempunyai stok yang sangat nipis. Gabungan ini menunjukkan pasaran yang amat sensitif terhadap sebarang data ekonomi positif seterusnya.
Memandangkan kusyen inventori yang rendah, pedagang derivatif wajar mempertimbangkan kedudukan bagi menghadapi peningkatan volatiliti harga. Sebarang lonjakan pembelian yang tidak dijangka atau isu bekalan tambahan boleh mencetuskan kenaikan mendadak. Pembelian opsyen panggilan (call options) boleh menawarkan cara berisiko terhad untuk menangkap potensi kenaikan dalam beberapa minggu akan datang.
Mula berdagang sekarang – Klik di sini untuk membuat akaun sebenar VT Markets