Jen Stoltenberg said NATO has reached a deal with Turkey to admit Finland and Sweden

US shares fell heavily on Tuesday following the release of CB Consumer Confidence, worse- than- expected. In the meantime, markets and investors are worried about oil prices stably staying at the high price while the Fed is not interested in slowing down. The Dow Jones Industrial Average dropped 1.56%. The Nasdaq Composite slid 3%, to 11,181.54 while the S&P 500 declined 2.01%. All three major indices erased their gains from last Friday, back into the bear- market. US indices were once up more than 1% during the US session before the release of the economic data. However, as the consumer confidence fell to 98.7, it essentially indicated that investors feared a recession that might happen in the future. At the same time, the officials also mentioned that 12- month inflation expectations were 8% for June, the highest since 1987.

With the war between Russia and Ukraine remaining, NATO Secretary Jen Stoltenberg said that NATO, the most powerful military alliance, has reached a deal with Turkey to admit Finland and Sweden. Before that, Turkey was not interested in signing the agreement as the Turkish President said that he would support the Kurdish organization. The move to add both countries to members of NATO comes after Russia invades Ukraine. Countries fear becoming the next Ukraine.

Main Pairs Movement

AUD/USD was down 0.23% to 0.69055 at the end of the day. The Australian dollar was relatively weak against the US dollar as the US shares fell sharply amid the risk sentiment, which came from the decline in Consumer Confidence that was released by the US.

USD/JPY advanced 0.49%, up for the third consecutive day. The Japanese Yen lost some interest from investors as the BOJ remains its monetary policy, continuously widening the gap between domestic and overseas’ yield rates. In the meantime, some news has said that the BOJ might have been saddled with as much as 600 million Yen in unrealized losses.

USD/CAD oscillated at 1.28727. The strength of the US dollar, boosted by the risk sentiment, was offset by the advance of oil prices, highly related to the Canadian dollar.

WTI was up 1.84%, bullish attacking for the third- consecutive day as the sanctions on Russia remain and the chatters surrounding OPEC+ forecasts for 2022 market surplus.

Technical Analysis

EURUSD (4-Hour Chart)

EURUSD lost 0.62% over the previous trading day. The Euro enjoyed a boost early during the European trading session as ECB president Lagarde reaffirms the central bank’s intent to raise interest rates by 25 basis points in July; furthermore, president Lagarde hints at more aggressive interest rate hikes if the central bank sees fit. On the economic docket, both ECB president Lagarde and Fed chair Jerome Powell are scheduled to speak on the 29th. U.S. GDP for Q1 is also scheduled to be released during the American trading session.

On the technical side, EURUSD retreated from our previously estimated resistance level of 1.0598 and is heading towards our projected support level of 1.0493. RSI for the pair sits at 45.7, as of writing. On the four-hour chart, EURUSD currently trades below its 50, 100, and 200-day SMA.

Resistance: 1.05754, 1.06315

Support: 1.0493

GBPUSD (4-Hour Chart)

GBPUSD lost 0..68% over the previous trading day. Heightened demand for the U.S. Dollar and broader risk-averse market sentiment have sent the U.S. Greenback higher. Market participants will be closely watching the U.S. GDP release and Fed chair Jerome Powell’s speech on the 29th. On the other hand, members of parliament have voted in favour of overturning a previously agreed Brexit deal, the Northern Ireland Protocol.

On the technical side, GBPUSD is trading towards our previously estimated support level of around the 1.2173 price region. Resistance at 1.2381 remains firmly intact. RSI for the pair sits at 40.52, as of writing. On the four-hour chart, GBPUSD currently trades below its 50, 100, and 200-day SMA.

Resistance: 1.2381

Support: 1.2173, 1.20824

USDJPY (4-Hour Chart)

USDJPY rose 0.49% over the previous trading day. Demand for the U.S. Dollar returned as market participants remain risk-averse. The upbeat U.S. durable goods orders, unexpectedly rose 0.7% in May. This could lead to reduced chances of the Fed hiking rates at a more aggressive rate. U.S. GDP and Fed Chairman Jerome Powell’s speech tomorrow could provide price action for the pair as the short-term bullish movement of the pair remains well fueled.

On the technical side, USDJPY has once again begun its march upwards toward our previously estimated resistance level of 136.57. Our previously estimated support level of 134.6 was successfully defended. RSI for the pair sits at 64.94, as of writing. On the four-hour chart, USDJPY currently trades above its 50, 100, and 200-day SMA.

Resistance: 136.57

Support: 134.6

Economic Data

CurrencyDataTime (GMT + 8)Forecast
AUDRetail Sales (May)09:300.4%
GBPBoE Gov Bailey Speaks19:35
USDGDP (Q1)20:30-1.5%
USDFed Chair Powell Speaks21:00
EURECB President Lagarde Speaks21:00

Russia has entered its first major foreign debt default, as the payment period expires

US shares edged lower to start the week following a major rebound from last Friday. The Dow Jones Industrial Average dropped 0.2%, to 31,438.26. The Nasdaq Composite declined 0.7% while the S&P 500 fell 0.3% at the end of the day. US stocks struggled to turn upside down on Monday as investors weighed whether the bottom has been reached and stocks have been oversold in this bear market.

Russia has entered its first major foreign debt default as the payment period expires. Interest payments of $100 million that Russia needed to pay were due on May 27 with the grace period on June 26. However, several bondholders have indicated that they have not received the payments after Russia attempted to pay in Ruble, which is blocked by international sanctions. The next test would be further 2 billion payments are due before the end of the year. If Russia continues to default, it would effectively ostracize the country from the global financial system; however, so far Russia has managed to find ways to get payments to bondholders.

Main Pairs Movement

AUD/USD edged 0.31% lower on Monday. The Aussie traded in the tight range in the absence of domestic data this week other than Retail Sales. At the end of the day, AUD/USD finished at 0.69213.

Gold turned downside after attempting to sustain above the resistance level above $1,840. Mixed US economic data undermined the market sentiment, bringing gold down to $1,822.75; the US Durable Goods Orders were up 0.7%, better- than- expected; in the meantime, Pending Home Sales dropped 13.6 YoY.

EUR/USD advanced 0.24% to 1.05820. The ECB will host the Forum on central banking in Portugal, this week; ECB President Christine Lagarde will offer a speech during the commencement.

GBP/USD consolidated, dropping 0.06% on Monday as there were no major economic events. The UK parliament members will vote on legislation that would possibly allow members to amend or rewrite Brexit deals.

WTI oil price was up 2.39% on Monday, advancing two- consecutive days. Oil prices turned upside as OPEC+ decided to cut the 2022 market surplus from 1.4 million to 1 million BPD. Moreover, due to the political turmoil in Libya, the crude oil output will shrink by approximately 600 K BPD in the oil market.

Technical Analysis

EURUSD (4-Hour Chart)

EURUSD edged higher on the first trading day of the week. The U.S. Greenback witnessed broad-based weakness as mixed data from the U.S. came in and market participants remain worried over a slowing U.S. economy. U.S. pending home sales decreased by a staggering 13.6%, year over year, for May. On the economic docket, U.S. GDP is set to release on the 29th, while EU CPI is scheduled to be released on July 1st.

On the technical side, EURUSD has traded above our previously estimated resistance level of 1.05754, but upward momentum seems to be fading. The next level of resistance sits at around the 1.06315 price region. RSI for the pair sits at 50.33, as of writing. On the four-hour chart, EURUSD currently trades near its 50-day SMA and below its 100 and 200-day SMA.

Resistance: 1.05754, 1.06315

Support: 1.0493

GBPUSD (4-Hour Chart)

GBPUSD traded mostly sideways over the first trading day of the week. Brexit continues to weigh on the British economy as members of parliament will vote on legislation that would allow ministers to rewrite parts of the post-Brexit deal and remove checks on goods entering Northern Ireland from the rest of the U.K. Market sentiment continues to put the British Pound and the U.S. Greenback in contention as the haven currency of choice as global economies show signs of recession.

On the technical side, GBPUSD continues to trade below our previously estimated resistance level of 1.2381. The support level at 1.2173 remains firm. RSI for Cable sits at 44.31, as of writing. On the four-hour chart, GBPUSD currently trades below its 50, 100, and 200-day SMA.

Resistance: 1.2381

Support: 1.2173, 1.20824

USDJPY (4-Hour Chart)

USDJPY built on last Friday’s upward momentum and continued to trade higher throughout Monday’s trading. Despite a broad-based weakness of the U.S. Greenback, the Japanese Yen continues to experience strong selling. The export-reliant country, Japan, continues on its course of a supportive monetary environment to keep exchange rates low. The benchmark U.S. 10-year Treasury yield has resumed trading above 3.2%.

On the technical side, USDJPY has rebounded strongly from our previously estimated support level of 134.6. Resistance at 136.57 remains close by and could be challenged. RSI for the pair has climbed to 62.63, as of writing. On the four-hour chart, USDJPY currently trades above its 50, 100, and 200-day SMA.

Resistance: 136.57

Support: 134.6

Economic Data

CurrencyDataTime (GMT + 8)Forecast
EURECB President Lagarde Speaks02:30
EURECB President Lagarde Speaks16:00
USDCB Consumer Confidence (Jun)22:00100.4

VT Markets Modifications on US Shares

Dear Client,

Correspond to the high volatility in the market recently, VT Markets will modify the trading setting of US Shares at the following time:

Notes: The figures above are only for reference. The actual execution data should be subject to the numbers on MT4/MT5.

Friendly reminders:
1. All specifications of US Shares stay the same except leverage.

If you’d like more information, please don’t hesitate to contact [email protected]

G-7 countries announced gold sanctions against Russia

US shares rallied on Friday, rebounding off the lows of the bear market. In the meantime, the bounce-back of the US shares capped its first weekly advance since May. The Dow Jones Industrial Average advanced 2.68%, 823.32 points. The S&P 500 jumped 3.06%, and the Nasdaq Composite rallied 3.34% to 11,607.62 on Friday. All three major indices snapped the losing streaks as investors deliberated the idea of whether stock markets have been oversold and have hit a bottom; however, several investment banks remained pessimistic outlook. Moreover to the US economic data, the US Consumer Sentiment from a University of Michigan survey hit a record low of 50 in June; a gloomy consumer sentiment means that the demand for goods and services has decreased, impacting the entire economic ecosystem, including corporates, employment opportunities, and the stock market.

Over the weekend, G-7 countries announced that they will ban the import of Russian gold, so-called gold sanctions. According to US President Joe Biden, world leaders need to work together against Russia as the invasion of Ukraine by Russia has brought and caused painful and serious impacts on food and energy supplies across the world. Imposing gold sanctions on Russia might cause a severe impact on Russia as Russia has used gold to support its currency as a way to circumvent other sanctions. One example would be swapping the gold for a more liquid foreign exchange that is not subject to sanctions from other countries.

Main Pairs Movement

EUR/USD edged higher, up 0.38% on Friday. The greenback was unable to gather bullish momentum amid the concerns of an economic slowdown in the US. In the meantime, the ECB pointed out that it would have to aim for large interest rate hikes since its monetary policy has fallen behind. Thus, the euro-dollar got boosted.

USD/JPY moved upside after the release of Japan’s inflation. The core CPI in Japan jumped to 2.1% in May, the second consecutive jump. With the BOJ continuing to keep its ultra-loose monetary policy, the Japanese Yen weakens against the greenback. On Friday, USD/JPY was up 0.17%, finishing at 135.16.

Gold was up 0.25%, and closed at $1,827.31 on Friday. The precious metal was comparably stronger than the greenback as the greenback lost some interest amid cooling hawkish expectations from the Fed.

AUD/USD was up 0.7%, trading at 0.6942 at the end of the day. The Aussie rallied as the demand for the US dollar decreased resulting in the risk sentiment. In the meantime, during the testimony of Fed Chairman Jerome Powell, he pointed out that the possibility of raising rates would be based on the incoming economic data and the outlook of the economy; thus, slightly dovish hawkish comments brought the US dollar down.

Technical Analysis

EURUSD (4-Hour Chart)

EURUSD gained 0.38% over the last trading day of the week to end the week in positive territory. Depressed PMI data from Germany and the Euro area has added concerns over an impending recession in the EU and uncertainty about the ECB’s abilities to tame inflation and support economic growth. On the economic docket, ECB President Lagard is set to speak on the 28th and Fed Chair Jerome Powell is set to speak on the 29th.

On the technical side, EURUSD continues to trade below our previously estimated resistance level of 1.05754. Selling pressure remains strong around this level. RSI for the pair sits at 55.93, as of writing. On the four-hour chart, EURUSD currently trades above its 50-day SMA, but below its 100 and 200-day SMA.

Resistance: 1.05754, 1.06315

Support: 1.0382

GBPUSD (4-Hour Chart)

GBPUSD traded sideways over the last trading day of the week. Cable ended the week with a 0.44% gain. U.K. retail sales declined by 0.5% monthly in May, thus hurting some of the demand for the British Pound. On the economic docket, British GDP figures are set to release on the 30th, after BoE governor Bailey’s speech on the 29th.

On the technical side, GBPUSD continues to trade below our previously estimated resistance level of 1.2381; on the other hand, support levels for Cable remain firm at 1.2173 and 1.20824. RSI for the pair sits at 44.58, as of writing. On the four-hour chart, Cable currently trades below its 50, 100, and 200-day SMA.

Resistance: 1.2381, 1.25047

Support: 1.2173, 1.20824

USDJPY (4-Hour Chart)

USDJPY gained 0.17% on the last trading day of the week to close the week in positive territory despite experiencing strong pullbacks on Wednesday and Thursday. The bullish sentiment continues to surround USDJPY as interest rate differences between the U.S. and Japan continue to overshadow any sort of fundamental news effects. On the economic docket, Japan’s Tankan large non-manufacturers index is set to release on the 30th.

On the technical side, USDJPY has found new support at the 134.76 price region and continues to trend upwards. The resistance level at 136.57 has not been challenged since Wednesday. RSI for the pair sits at 61.73, as of writing. On the four-hour chart, USDJPY currently trades above its 50, 100, and 200-day SMA.

Resistance: 136.57

Support: 133.84, 134.76

Economic Data

CurrencyDataTime (GMT + 8)Forecast
USDCore Durable Goods Orders (May)20:300.3%
USDPending Home Sales (May)22:00-4%

VT Markets Notification of Server Upgrade

Dear Client,

As part of our commitment to provide the most reliable service to our clients, there will be a server maintenance this weekend.

Maintenance Hours:

2022/06/25 16:00 – 18:00 (Server time)

Please be reminded that:

During this weekend’s maintenance period, clients can still trade as usual.

However, the stability of quotations and market liquidity will be affected and decreased.

Thank you for your patience and understanding.

If you’d like more information, please don’t hesitate to contact [email protected].

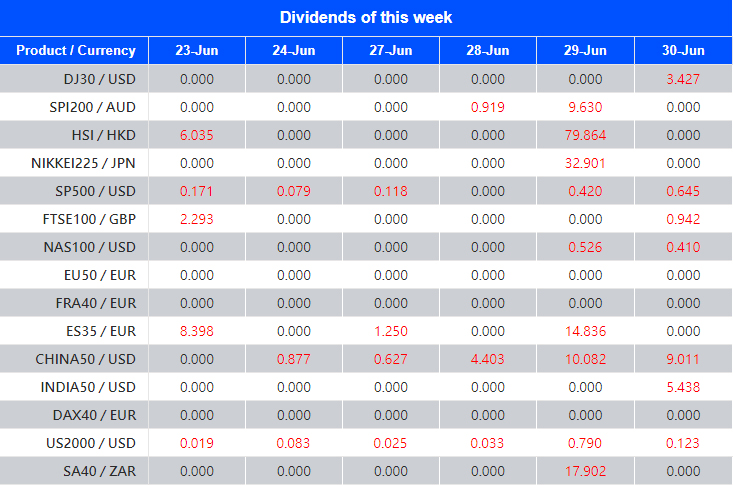
VT Markets The Adjustment Of Weekly Dividend Notification

Dear Client,

Warmly reminds you that the component stocks in the stock index spot generate dividends. When dividends are distributed, VT Markets will make dividends and deductions for the clients who hold the trading products after the close of the day before the ex-dividend date.

Indices dividends will not be paid/charged as an inclusion along with the swap component. It will be executed separately through a balance statement directly to your trading account, the comment for which will be in the following format “Div & Product Name & Net Volume ”.

Please note the specific adjustments as follows:

Note: The above data is for reference only, the actual execution date may be changed, please refer to the MT4/MT5 software for details.

If you’d like more information, please don’t hesitate to contact [email protected]

VT Markets SHOP Stock Split Notification

Dear Client,

Please be advised of the upcoming SHOPIFY INC – CLASS A (SHOP) stock split that is going to take place as per the following schedule:

Ex-Date: June 29th, 2022. Common shares will trade at the new split-adjusted price.

Important implications of the Shopify Stock Split:

1. The quantity of shares of each client’s position will multiply by 10.

2. Post-split, the “open price” and “take profit / stop loss” of each position will be adjusted, which will be the original price divided by 10.

3. The estimated post-split price may be 1/10 of the EOD price on 28th, June.

4. All pending orders at the time of the split (Buy Limit, Sell Limit, Buy Stop, Sell Stop, Buy Stop Limit, Sell Stop Limit) will be cancelled.

5. All SHOP holding positions and pending orders on DEMO account will be closed as a result of the stock split.


Q. What is a stock split?
A. A stock split is a corporate action taken by companies that have seen their share price increase to levels that are either too high or are beyond the price levels of similar companies in their sector, to divide their existing shares into two or more shares.

Q. Why do stocks split?
A. The primary motive is to make the shares more affordable to small investors even though the underlying value of the company has not changed. Shopify would like its stock to be more accessible to a broader base of investors.

Q. What is the split ratio?
A. Shopify also announced it will split its stock in a 10 for 1 offering.

Q. What will this split mean to investors?
A. Each share of SHOP stock that an investor owns before Ex-Date (June 29th, 2022) will be eligible for stock split. Investors will receive nine additional shares and the stock price will be 1/10.

Here is an example:
If an investor owns 100 shares and the market price is $300, $350 as take profit. After 10 for 1 stock split, the investor will own 100*10= 1,000 shares and the estimated post-split price would be $300/10 = $30, and the take profit price will adjust to $350/10=$35.

Q. Does the 10 for 1 stock split mean the value of my SHOP shares will increase nine times?
A. Unfortunately, not. As stated in the above example, the increase in the number of stocks means every share is now worth less than its previous value, precisely, it’ll be 1/10th the previous value.

Q. How do stock splits affect short sellers?
A. Stock splits do not affect short sellers in a material way. There are some changes that occur as a result of a split that affects the short position, but they don’t affect the value of the short position(s).

If you have any questions, our team will be happy to answer your questions. Please mail to [email protected] or contact the service online.

VT Markets The notification of MT4 software version upgrade

Dear Client,

In order to provide you with a better user experience, VT Markets will upgrade our MT4 software and server to version 1353 on July 2, 2022 (Saturday).

Please ensure that your MT4 is up to date after July 2, 2022, as outdated versions (ver1340 and below) might experience issues connecting to the server.

Check your MT4 software version with the following steps:
PC: Open the MT4 software – Click “About” in “Help” in the toolbar;
Android: Open the MT4 app – Click “About” in the left toolbar;
iOS: Open the MT4 app-Settings – Click “Settings” in Settings page.

For PC users, please uninstall the software and install the latest version from the following link:
https://vtmarketscn.com/trading/platforms/metatrader-4/

For Android users, please go to the following link to update your MT4 version:
https://play.google.com/store/apps/details?id=net.metaquotes.metatrader4

For iOS mobile users, please go to the following link to update your MT4 version:
https://apps.apple.com/au/app/metatrader-4/id496212596

If you have any questions, our team will be happy to help. Please email [email protected] or contact our online service.

VT Markets The Adjustment Of Weekly Dividend Notification

Dear Client,

Warmly reminds you that the component stocks in the stock index spot generate dividends. When dividends are distributed, VT Markets will make dividends and deductions for the clients who hold the trading products after the close of the day before the ex-dividend date.

Indices dividends will not be paid/charged as an inclusion along with the swap component. It will be executed separately through a balance statement directly to your trading account, the comment for which will be in the following format “Div & Product Name & Net Volume ”.

Please note the specific adjustments as follows:

Note: The above data is for reference only, the actual execution date may be changed, please refer to the MT4/MT5 software for details.

If you’d like more information, please don’t hesitate to contact [email protected]

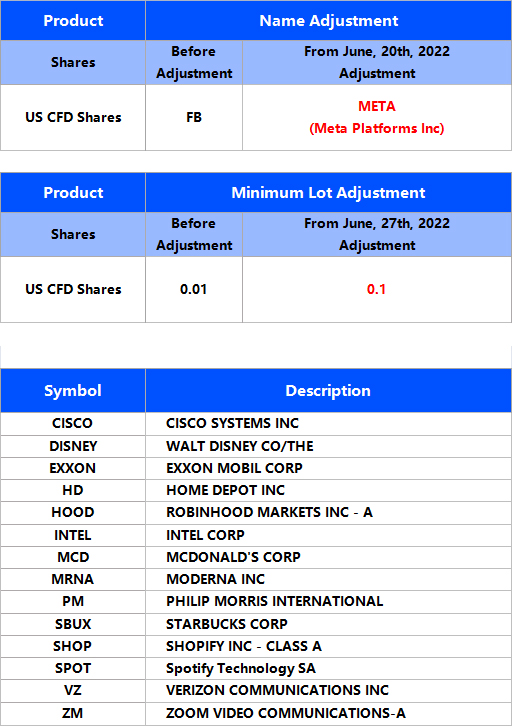
VT Markets Modifications on US Shares

Dear Client,

To provide a favorable trading environment to our clients, VT Markets will modify the trading setting of US Shares at the following time:

1. From June 20th, the 14 US stock contracts listed in the table below will be traded on the preferential terms of 0 commission.

2. From June 20, the name of the US stock CFD product FB will be adjusted to META, and the full name will be adjusted to Meta Platforms Inc.

3. From June 27th, the minimum lot of US Shares will be chenged to 0.1.

Notes: The figures above are only for reference. The actual execution data should be subject to the numbers on MT4/MT5.

Friendly reminders:
All specifications of US Shares stay the same except commission, name and minimum lot.

If you’d like more information, please don’t hesitate to contact [email protected].

Back To Top
server

Hai 👋

Bagaimana saya boleh membantu?

Segera berbual dengan pasukan kami

Chat Langsung

Mulakan perbualan secara langsung melalui...

  • Telegram
    hold Ditangguh
  • Akan datang...

Hai 👋

Bagaimana saya boleh membantu?

telegram

Imbas kod QR dengan telefon pintar anda untuk mula berbual dengan kami, atau klik di sini.

Tidak ada aplikasi Telegram atau versi Desktop terpasang? Gunakan Web Telegram sebaliknya.

QR code