Stocks rebounded on Thursday, snapping a three-day decline for the Dow Jones Industrial Average and the S&P 500 ahead of the pivotal Friday jobs report. The S&P 500 surged by 0.80%, reaching 4,585.59, while the Dow added 62.95 points, marking a 0.17% increase to reach 36,117.38. The Nasdaq Composite soared by 1.37%, driven by strong performances from tech giants like Alphabet, Nvidia, and AMD. Despite this rebound, the Dow and S&P 500 were on track to conclude the week with slight losses, highlighting concerns about the market’s trajectory. Investors closely eyed employment data amidst mixed signals from the job market, while currency markets experienced significant volatility, particularly driven by the yen’s surge and its impact on major currency pairs like USD/JPY, EUR/USD, EUR/JPY, and others.
Stock Market Updates
Stocks experienced a rebound on Thursday, breaking a three-day decline for both the Dow Jones Industrial Average and the S&P 500 ahead of the pivotal Friday jobs report. The S&P 500 surged by 0.80%, hitting 4,585.59, while the Dow added 62.95 points, marking a 0.17% increase to reach 36,117.38. Notably, the Nasdaq Composite soared by 1.37% to 14,339.99, driven by strong performances from tech giants like Alphabet, whose launch of the Gemini AI model spurred a more than 5% surge. Nvidia and AMD also saw gains of over 2% and 9%, respectively. Despite this rebound, the Dow and S&P 500 were still on track to conclude the week with slight losses of around 0.4% and 0.2%, respectively, highlighting concerns about the market’s trajectory.
Investors were particularly focused on employment data, given mixed signals from the job market. While weekly jobless claims were below expectations and continuing jobless claims declined, indicating steady layoffs, private payroll data suggested fewer job additions than anticipated. Conflicting data, including a decrease in job openings in October, left the market in uncertainty ahead of Friday’s official jobs report, where economists projected the addition of 190,000 jobs in November. The Federal Reserve closely monitored these figures, hoping for signs of labor market moderation that would support its decision to pause interest rate hikes. Meanwhile, European markets slipped, reversing earlier gains, with the Stoxx 600 down 0.3%, largely led by losses in retail stocks, while Asia-Pacific markets faced a widespread slump as investors analyzed trade data from China and Australia.
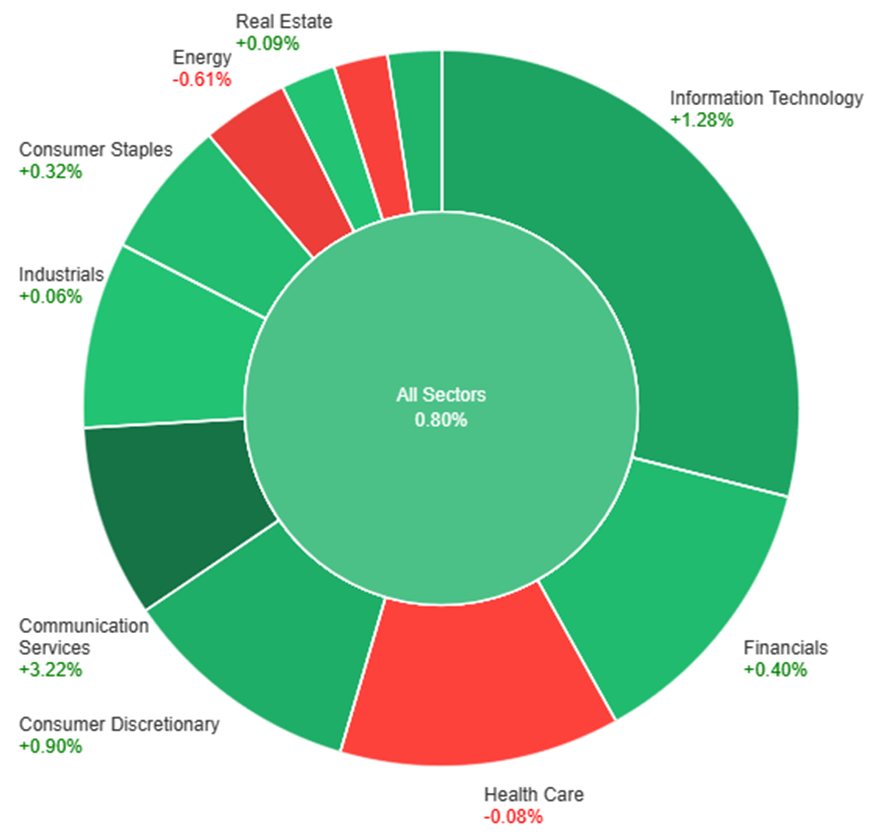
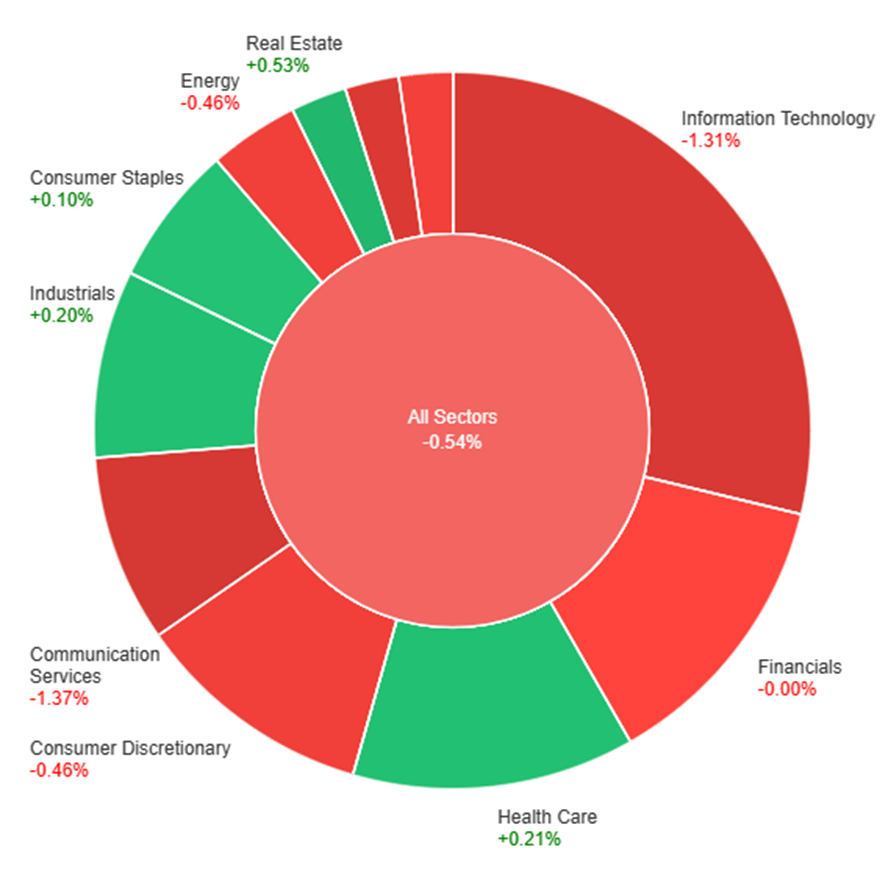
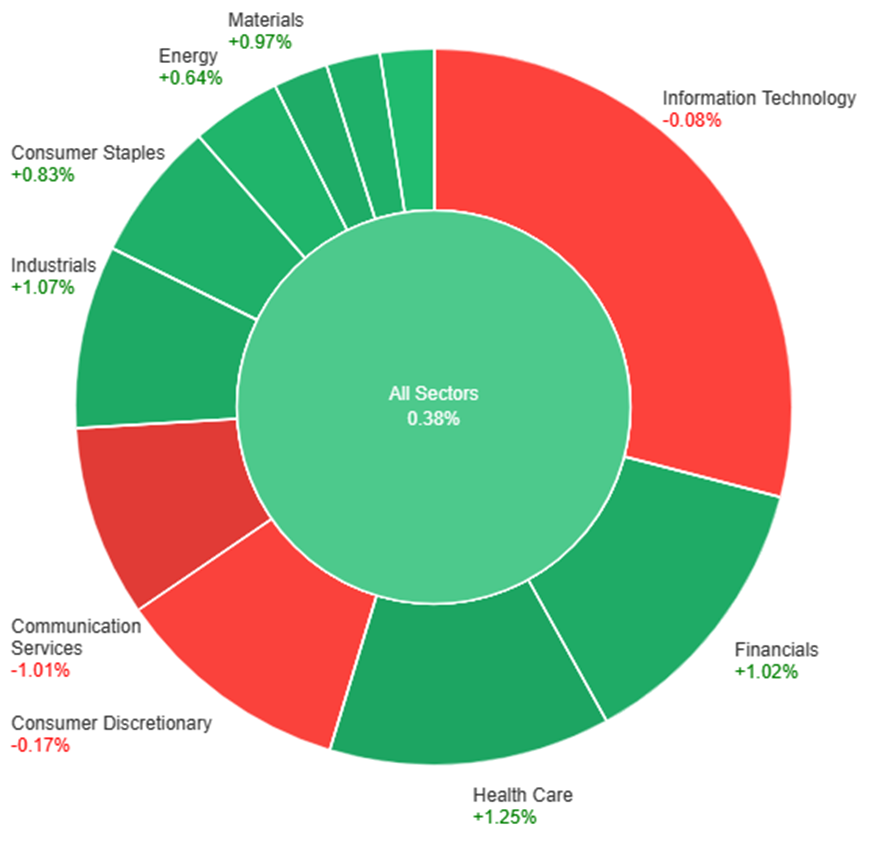
Data by Bloomberg
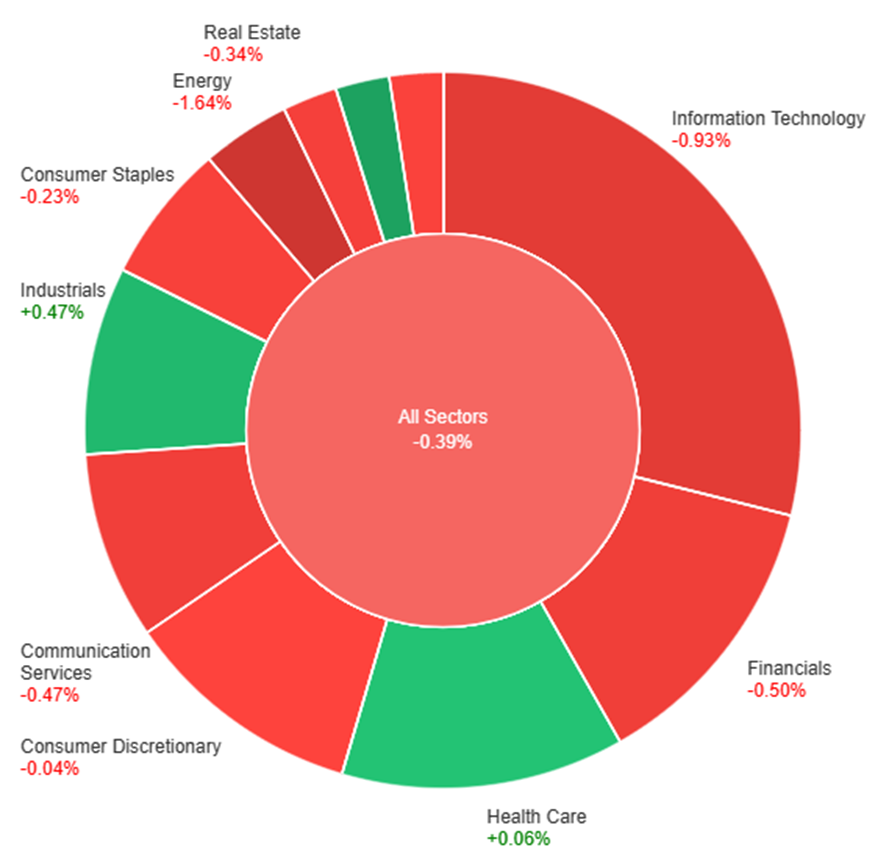
On Thursday, the overall market saw a positive trend with a 0.80% increase across all sectors. Communication Services experienced a significant surge of 3.22%, followed by Information Technology with a 1.28% rise and Consumer Discretionary at 0.90%. Materials and Financials also showed positive growth, albeit more modestly, at 0.67% and 0.40%, respectively. Consumer Staples and Real Estate saw marginal gains of 0.32% and 0.09%, while Industrials had a slight increase of 0.06%. However, Health Care showed a minor decline of 0.08%. On the downside, Utilities and Energy experienced decreases of 0.24% and 0.61%, respectively, contributing to the mixed performance across the sectors.
Currency Market Updates
The currency market experienced significant volatility, primarily driven by the yen’s remarkable surge against major currencies like the dollar, euro, and sterling. The catalyst for this surge stemmed from BOJ Governor Kazuo Ueda’s comments, sparking speculation about a potential tightening of Japanese monetary policy. Ueda’s remarks strongly suggested an impending rate hike, creating a shift in sentiment and prompting a substantial unwinding of short yen positions. The USD/JPY pair faced a sharp decline, breaking key technical levels, notably the uptrend line from March and significant Fibonacci supports, signaling a potential erasure of half of the 2023 uptrend if it closes below 142.50, especially after the upcoming payrolls report.
Meanwhile, the fallout from the yen’s surge influenced other currency pairs. EUR/USD saw a modest 0.4% increase amidst choppy trading conditions, impacted by the yen’s movement and mixed U.S. data. The EUR/JPY pair, on the other hand, experienced a 2% decline, further fueled by speculative trading due to substantial euro longs and yen shorts based on ECB and BoJ policy divergence that is now converging rapidly. Additionally, the sterling rose slightly in the aftermath of the USD/JPY decline, with the market assessing the anticipated Fed rate cuts against the comparatively delayed and smaller BoE cuts suggested by futures. The risk-sensitive pound found support from U.S. equity gains, while the Australian dollar reversed earlier losses, rising approximately 0.9% amid slipping Treasury yields and climbing stock markets, showcasing its status as a risk proxy. Meanwhile, USD/CAD remained flat, mirroring the dollar’s performance within this fluctuating landscape.
Picks of the Day Analysis
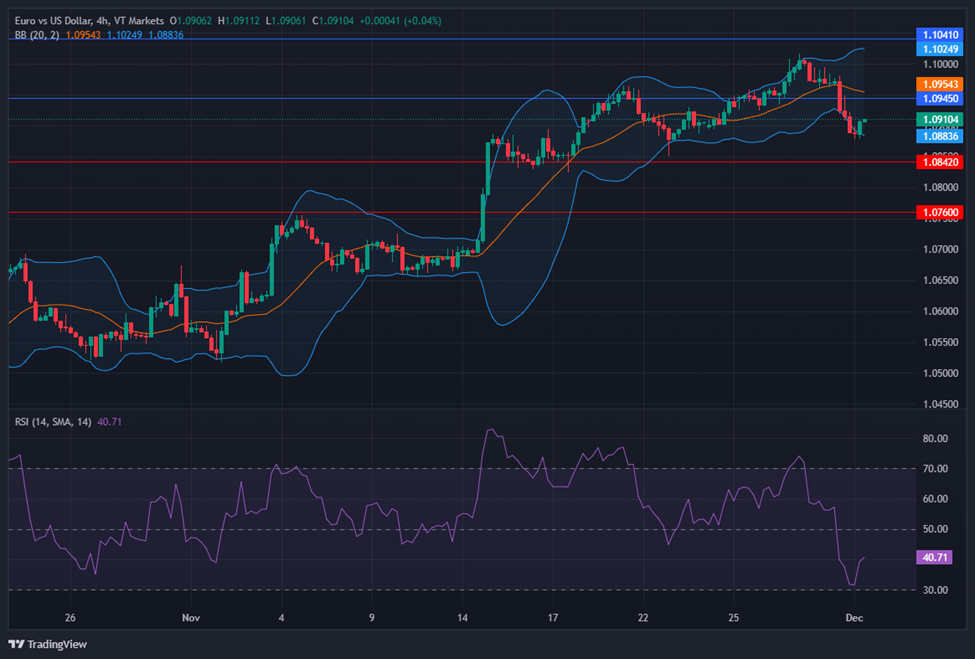
EUR/USD (4 Hours)
EUR/USD Surges Amidst Dollar Weakness Ahead of Crucial US Employment Data
The EUR/USD witnessed a climb past 1.0800 from weekly lows near 1.0750 as the US Dollar weakened, driven by declining US yields. However, Germany’s unexpected drop in Industrial Production hints at a negative regional economic outlook. With the Eurozone’s forthcoming CPI likely to hold steady at 3.2%, attention shifts to the US employment data due Friday. Despite initial concerns about ECB and Fed policy divergence, the Dollar lost steam amidst improved risk sentiment. As the market anticipates a softer US labor market, expectations of a payroll increase to 180,000 in the forthcoming report linger, following a previous 150,000 figure.
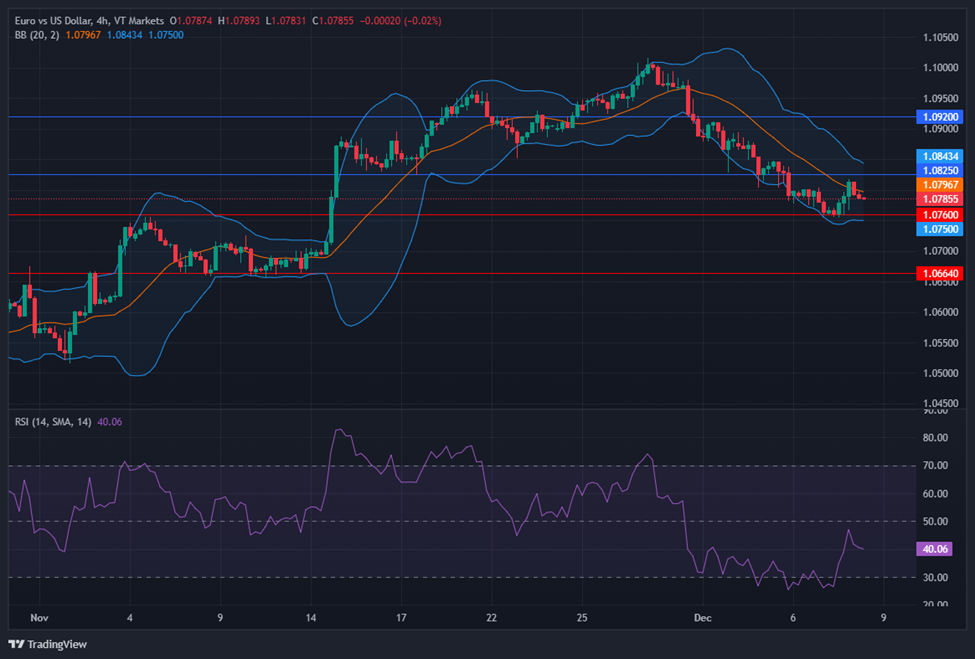
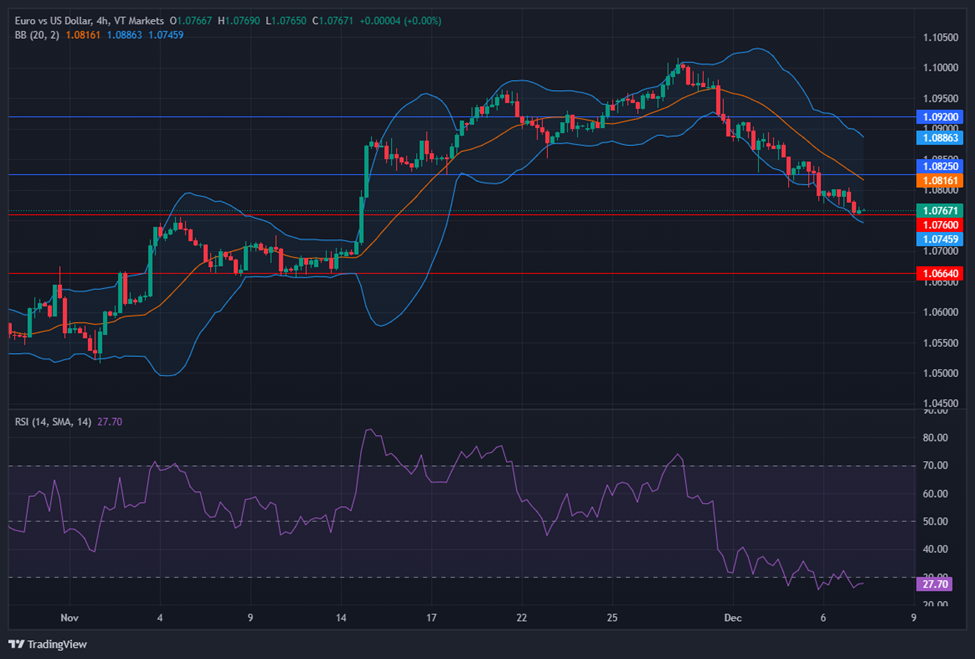
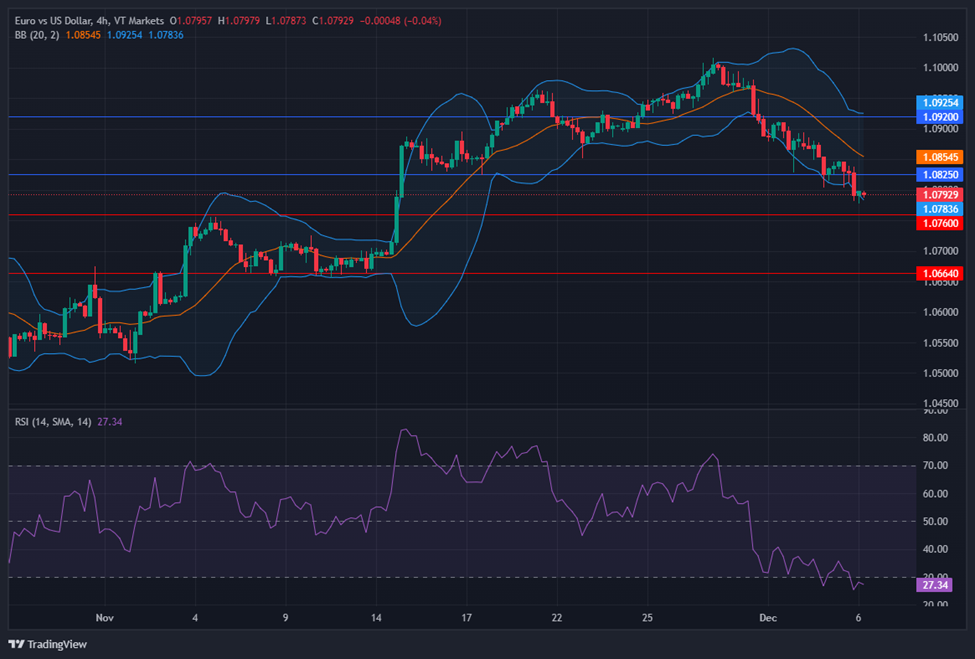
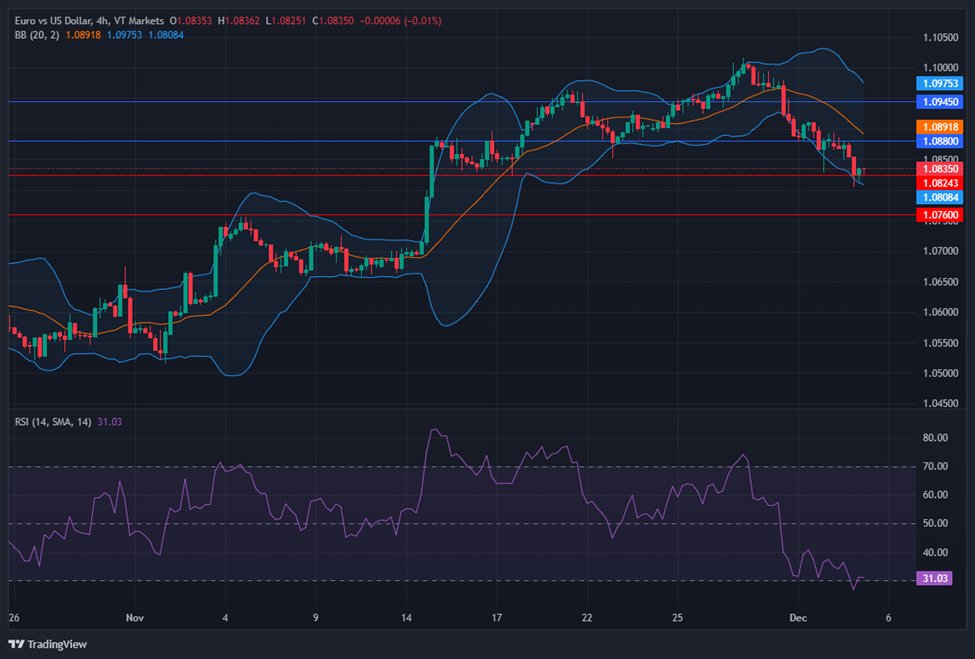
On Thursday, the EUR/USD moved slightly higher and was able to reach the middle band of the Bollinger Bands. Currently, the price moving slightly below the middle band, suggesting a potential lower movement, potentially reaching the lower band. Notably, the Relative Strength Index (RSI) maintains its position at 40, signaling a bearish outlook for this currency pair.
Resistance: 1.0825, 1.0920
Support: 1.0760, 1.0664
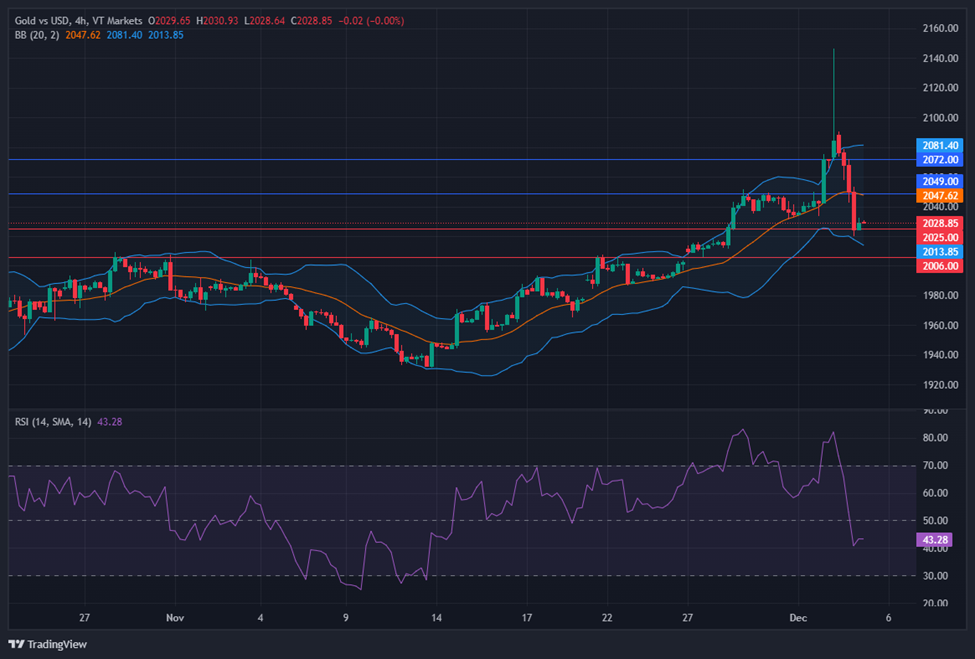
XAU/USD (4 Hours)
XAU/USD Sees Sideways Movement Amidst Resistance and Economic Indicators
The Gold spot market is currently experiencing a sideways trend without a definitive short-term direction, grappling with resistance at $2,040 while constrained by lower Treasury yields. Despite retracing from its all-time highs near $2,130, Gold’s negative momentum shows resilience. The recent drop in XAUD/USD inflicted damage but has stabilized, hinting at a potential consolidation phase. Amidst expectations of the Federal Reserve maintaining interest rates and potential rate cuts in 2024 following other central banks, Gold’s resurgence depends on a modest weakening of the US Dollar and continued subdued yields. With key economic data like the Nonfarm Payroll and the Consumer Price Index on the horizon, market focus remains pivotal on potential catalysts for Gold’s upward movement toward record highs.
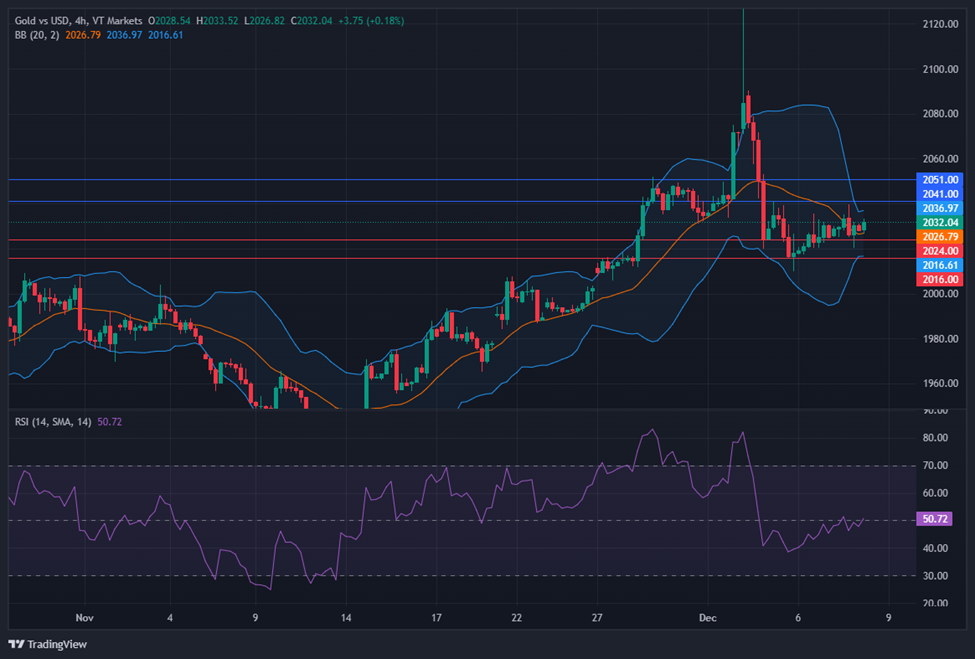
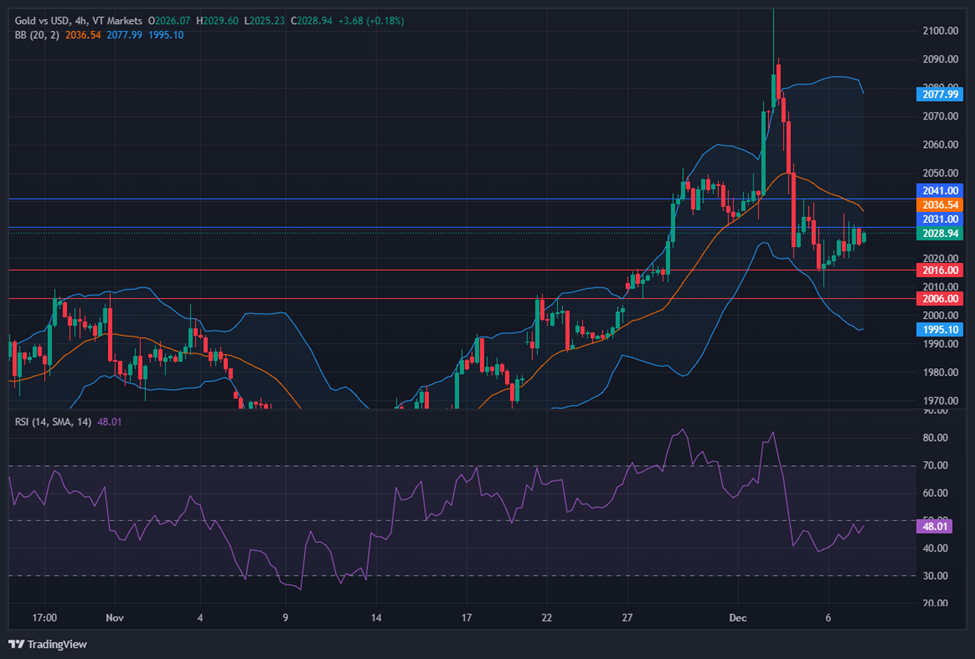
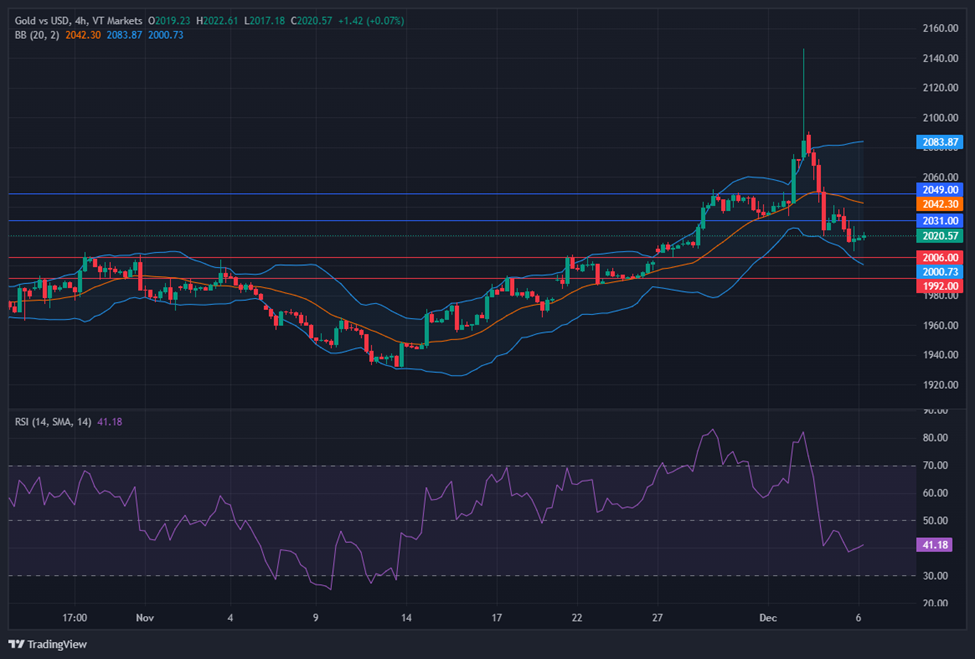
On Thursday, XAU/USD moved in consolidation waits for Friday’s US jobs report and created a narrow band of the Bollinger Bands. The current movement suggests that the market is still in wait-and-see mode for the non-farm data before goes in any direction. The Relative Strength Index (RSI) stands at 50, indicating a neutral sentiment for this pair.
Resistance: $2,041, $2,051
Support: $2,024, $2,016
Economic Data
| Currency | Data | Time (GMT + 8) | Forecast |
|---|---|---|---|
| USD | Average Hourly Earnings m/m | 21:30 | 0.3% |
| USD | Non-Farm Employment Change | 21:30 | 184K |
| USD | Unemployment Rate | 21:30 | 3.9% |
| USD | Prelim UoM Consumer Sentiment | 23:00 | 62.0 |