Mixed Market Trends as Treasury Yields Fluctuate: Wall Street Prepares for Tech Giants’ Earnings Amidst Rising Concerns

On Monday, the stock market witnessed mixed fortunes as the Nasdaq Composite edged higher while the Dow Jones and S&P 500 experienced declines, influenced by fluctuations in Treasury yields. The 10-year Treasury yield breached the 5% mark, sparking worries of further monetary tightening and its potential impact on the economy. As Wall Street endured a challenging week, major tech giants like Alphabet, Amazon, Meta, and Microsoft’s upcoming earnings reports were eagerly anticipated for insights into the market’s trajectory. Meanwhile, the currency market saw the US dollar weaken, the euro showing strength, and the British pound gaining ground, as expectations of central bank policies and upcoming economic data played a pivotal role in shaping market sentiment.

Stock Market Updates

On Monday, the Nasdaq Composite saw a slight increase in value as Treasury yields eased from their recent highs. Investors were eagerly anticipating the release of corporate earnings reports from tech industry giants. The Dow Jones Industrial Average, however, experienced a decline of 190.87 points, amounting to a 0.58% drop, closing at 32,936.41. The S&P 500 also dipped, falling by 0.17% to reach 4,217.04. In contrast, the Nasdaq Composite, known for its tech-heavy components, managed to gain 0.27%, concluding the session at 13,018.33. The benchmark 10-year Treasury note yield briefly exceeded the significant 5% level before slightly receding, ultimately settling at around 4.85%.

Interest rates have surged in recent weeks, with the 10-year Treasury yield surpassing the 5% threshold for the first time since July 2007. Federal Reserve Chair Jerome Powell’s comments suggested further monetary policy tightening, increasing investor concerns and contributing to the rise in Treasury yields. Some analysts predict that the benchmark yield may continue to rise. The rapid increase in yields has raised concerns about its impact on the economy, with Canaccord Genuity chief market strategist Tony Dwyer noting that it could accelerate an already weakening economic situation masked by higher rates. After a challenging week, which saw the S&P 500 ending 2.4% lower, the Dow Jones losing 1.6%, and the Nasdaq experienced its second consecutive weekly decline of 3.2%, Wall Street now awaits a series of major tech companies’ earnings reports, including Alphabet, Amazon, Meta, and Microsoft, which are expected to provide crucial insights for the stock market.
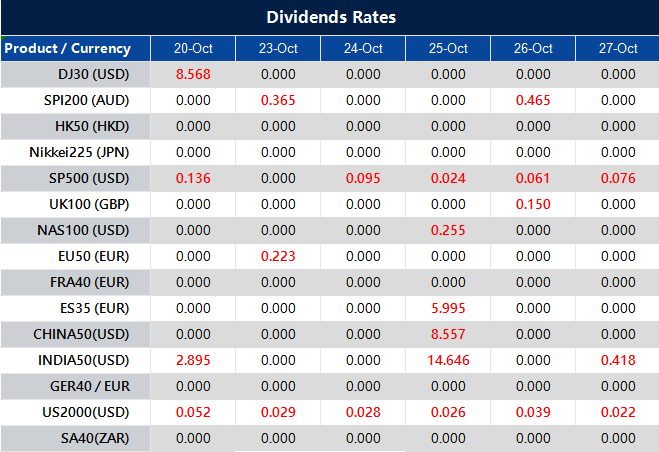
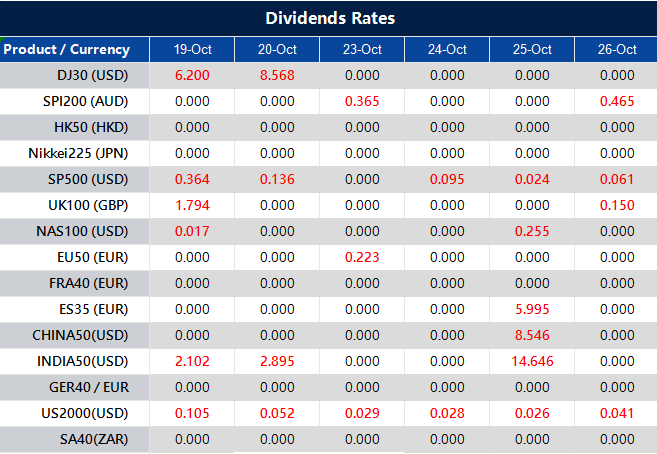
Data by Bloomberg

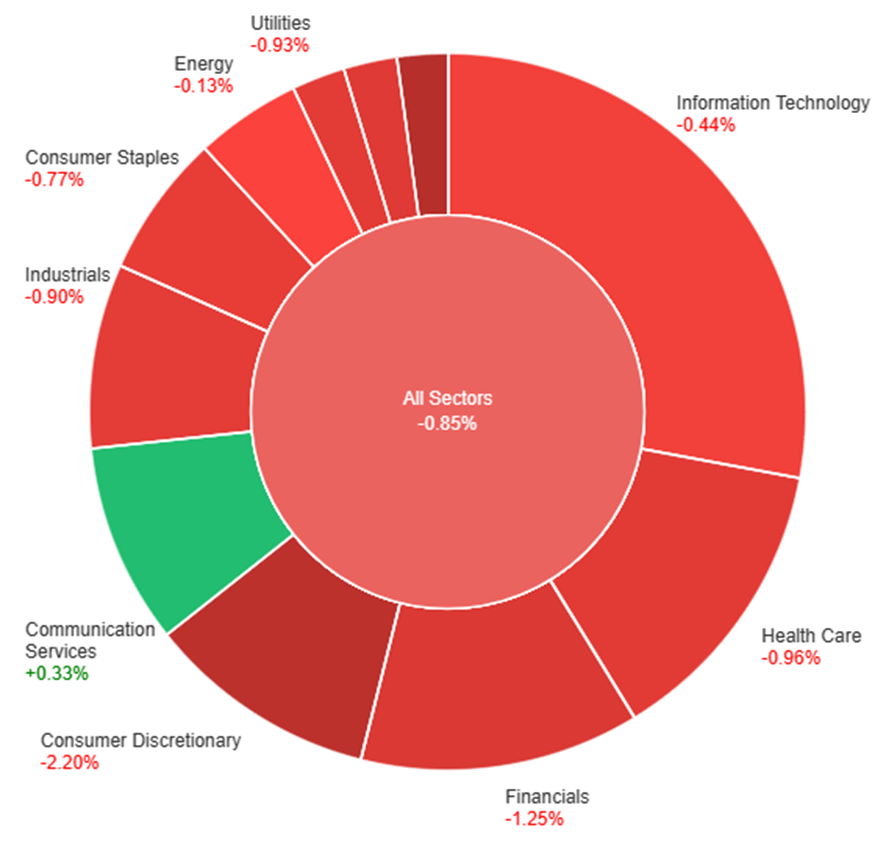
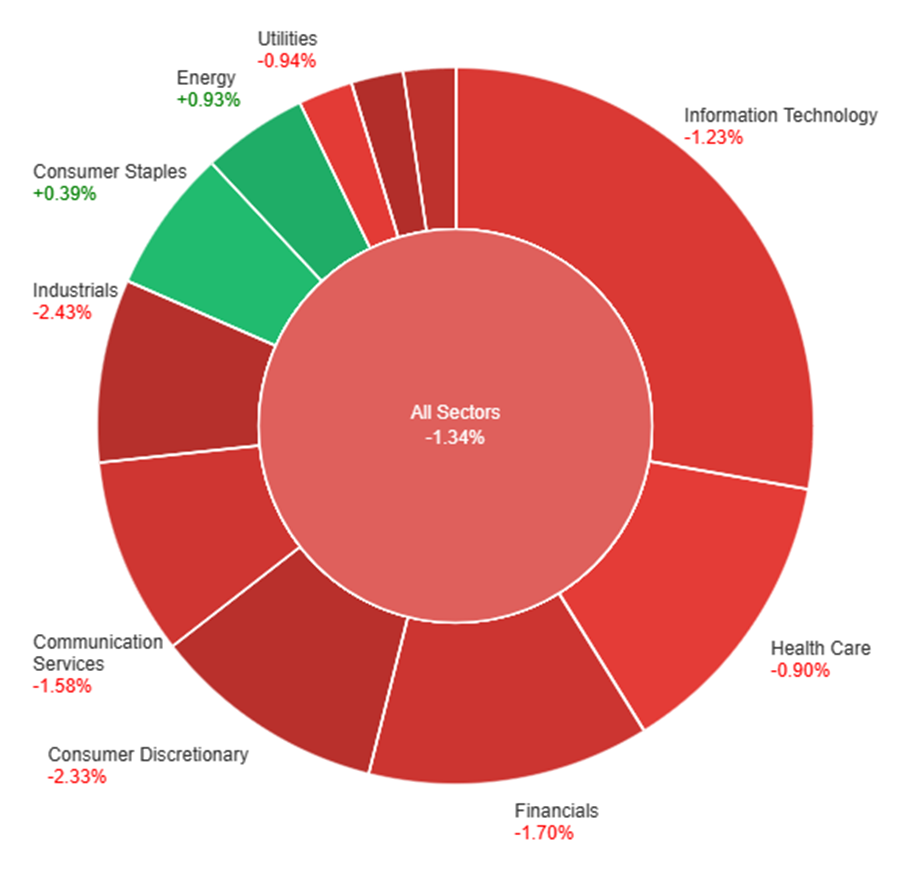
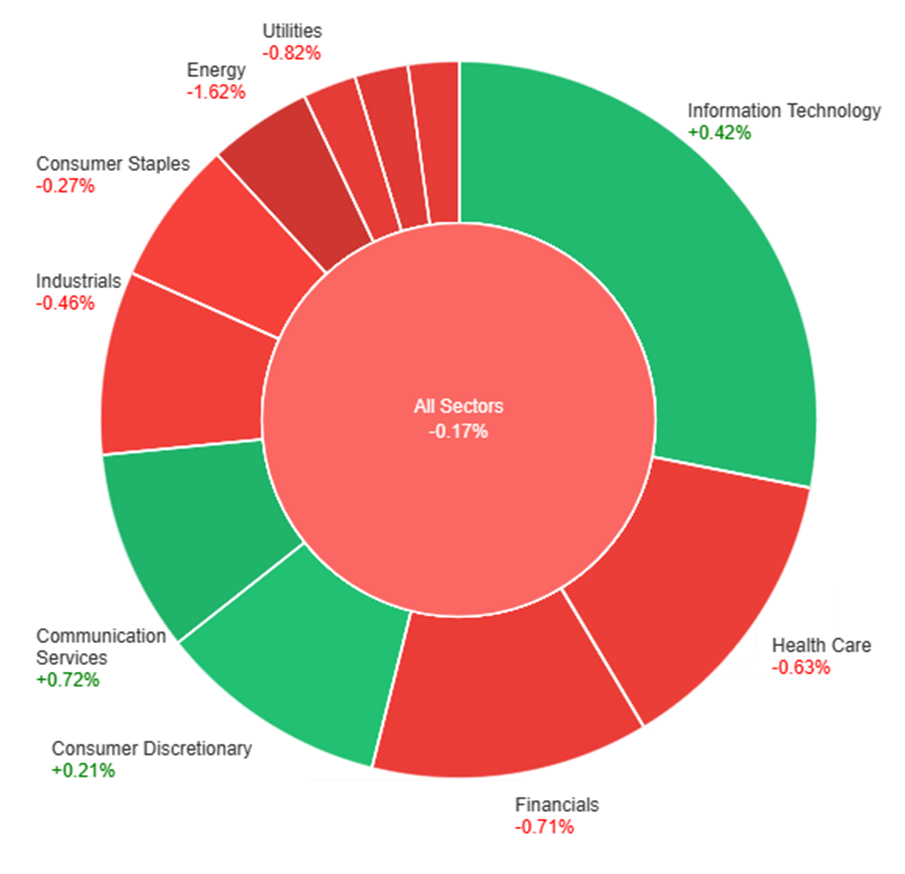
On Monday, the overall market experienced a slight decline, with a decrease of 0.17%. Among the individual sectors, there were variations in performance. Communication Services and Information Technology sectors saw gains of +0.72% and +0.42%, respectively. Consumer Discretionary also showed a modest increase of +0.21%. Conversely, Consumer Staples and Industrials experienced declines of -0.27% and -0.46%, respectively. Health Care and Financials sectors declined by -0.63% and -0.71%, respectively. Utilities and Real Estate sectors had larger declines of -0.82% and -0.84%, respectively. Materials and Energy sectors saw the most significant declines with -1.07% and -1.62%, respectively.  


Currency Market Updates

In recent currency market updates, the US dollar experienced a decline of 0.5% as risk aversion sentiment eased, allowing stocks to recover and oil prices to drop, primarily because the worst-case geopolitical scenarios did not materialize. Concurrently, 10-year Treasury yields retreated from their recent peak above 5%. The dollar index fell below a crucial 30-day moving average support level, heading toward October’s lows. Meanwhile, the EUR/USD pair showed strength, rising by 0.7% and surpassing its previous October recovery high at 1.0640, along with other significant resistance levels nearby. A close above 1.0643 would signify a broader correction after a 12-week downtrend, with potential upside targets at 1.0700 and 1.0740.

Furthermore, market sentiment regarding the euro was influenced by the anticipation of upcoming economic data from the eurozone and the United States. Although these data forecasts were not particularly bullish for EUR/USD, the market seemed to signal that the worst of the divergence in yield spreads between the Federal Reserve (Fed) and the European Central Bank (ECB) is over. The ECB was expected to maintain a steady course, with no further rate hikes and the possibility of rate cuts by June, which aligns with the Fed’s timeline. The British pound also gained strength for similar reasons as EUR/USD, with expectations of fewer rate cuts by the Bank of England (BoE) in comparison to the Fed. However, it remained below its downtrend line from July’s highs and October’s rebound highs. Investors were closely watching delayed UK employment data to assess the likelihood of another BoE rate hike. Additionally, USD/JPY experienced a 0.14% decline after nearly reaching a peak close to the pivotal 150 level, primarily due to a drop in 10-year Treasury yields. The market was focused on a significant amount of USD/JPY 150 option expiries on Friday, with limited pricing for substantial moves, especially above 150, before the end of the month and the Bank of Japan (BoJ) meeting. The prospects for dip-buyers would depend on the performance of Treasury-JGB yields following key US data releases later in the week. Tuesday was expected to bring global flash PMI readings for October, with most forecasts indicating continued economic challenges.

Picks of the Day Analysis
EUR/USD (4 Hours)

EUR/USD Surges to One-Month High as Weaker US Dollar Drives Momentum

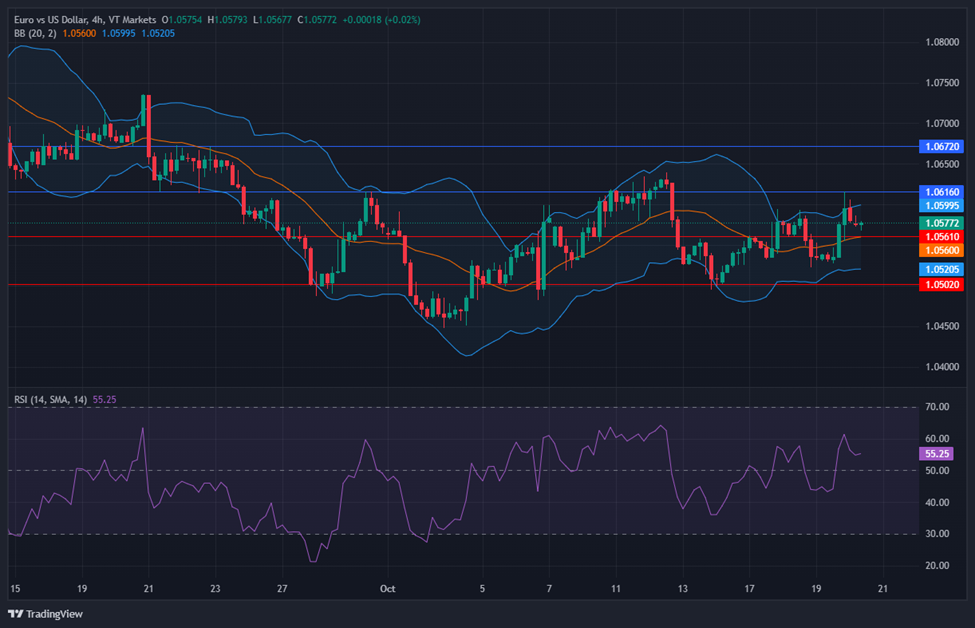
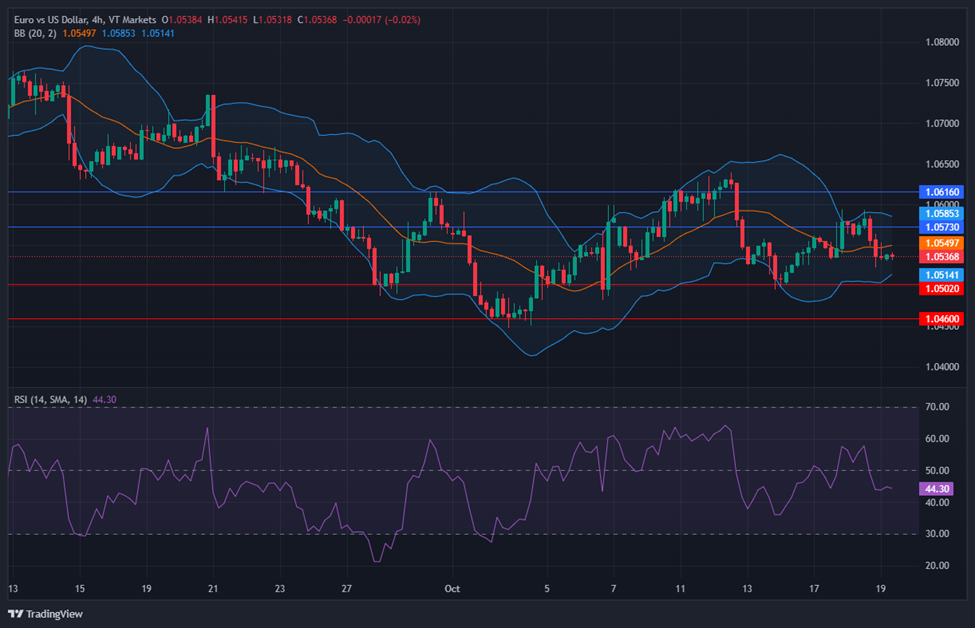
The EUR/USD pair rallied significantly on Monday, breaking a downtrend line and reaching 1.0676, its highest level in a month, primarily due to a sharp decline in the US Dollar and improved market sentiment. As the Eurozone and the US prepare to release key PMI data and important monetary policy meetings are on the horizon, the Euro’s outlook remains favorable, though some consolidation may follow the 100-pip rally.

Chart EURUSD by TradingView

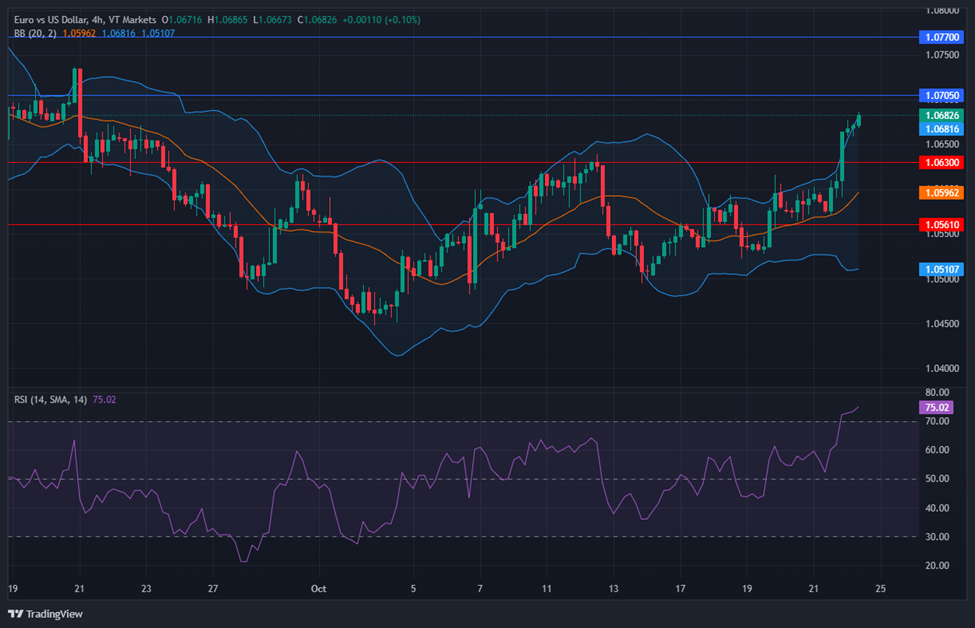
Based on technical analysis, the EUR/USD moved higher on Monday, pushing towards the upper band of the Bollinger Bands. Currently, the EUR/USD is trading at the upper band, suggesting the potential for another push higher movement. The Relative Strength Index (RSI) stands at 75, indicating that the EUR/USD is entering a bullish bias.

Resistance: 1.0705, 1.0770

Support: 1.0630, 1.0561

XAU/USD (4 Hours)

XAU/USD Retreats from Multi-Month Highs Amid Optimistic Start to the Week”

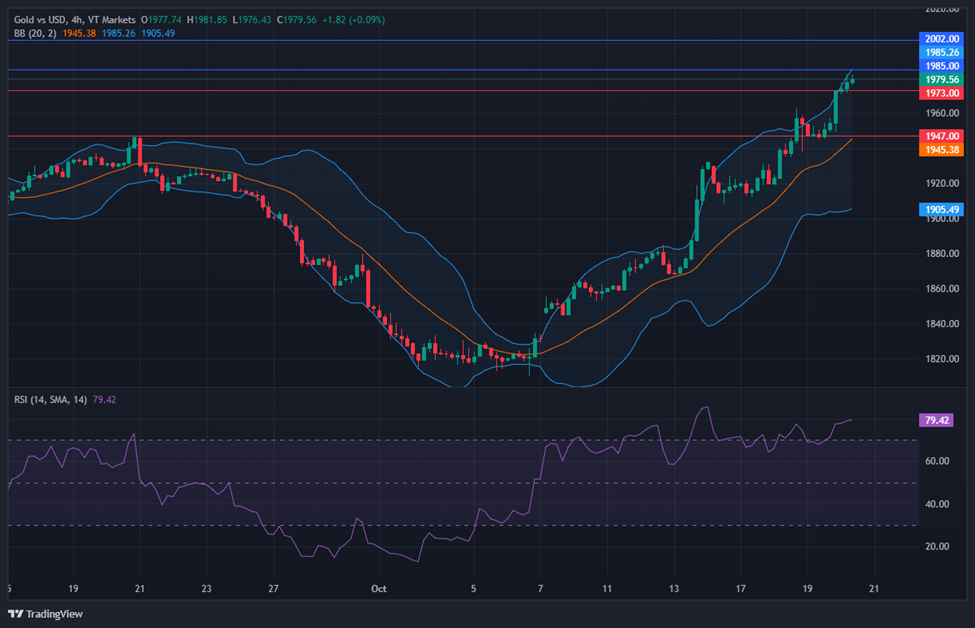
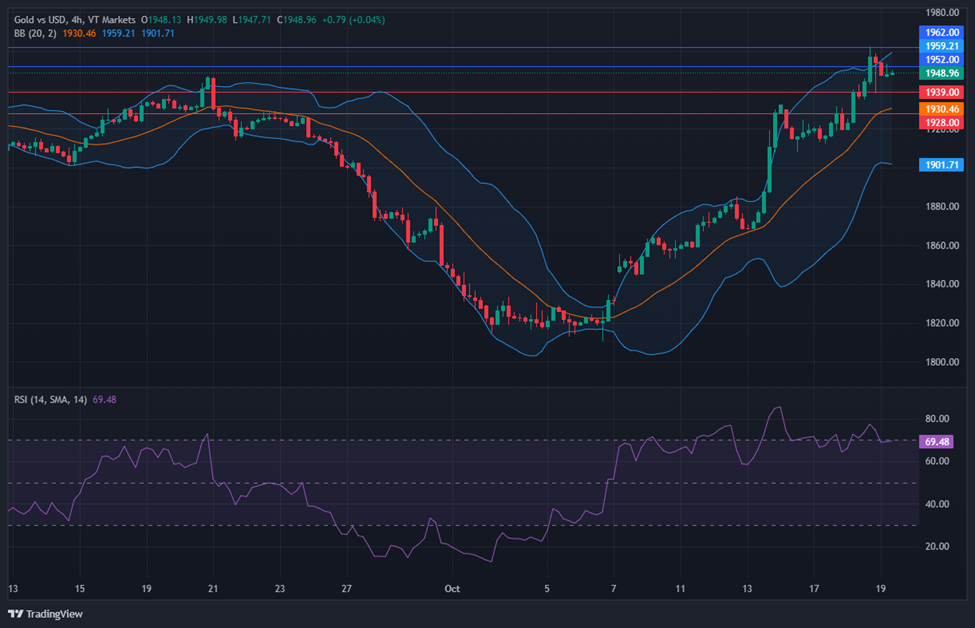
Spot Gold (XAU/USD) experienced a pullback from recent multi-month highs, briefly dipping to the $1,960 price range before finding support at around $1,977 per troy ounce during the American trading session. This retreat was attributed to easing demand for safe-haven assets, influenced by optimism in the financial markets as the situation in the Middle East, particularly the conflict between Israel and Hamas, showed signs of not escalating. The movement in gold was also influenced by changes in government bond yields and speculation about monetary policies in various countries, including Japan and the United States. As the week progresses, investors are closely watching upcoming events, such as the European Central Bank’s monetary policy decision and the release of key economic indicators in the United States.

Chart XAUUSD by TradingView

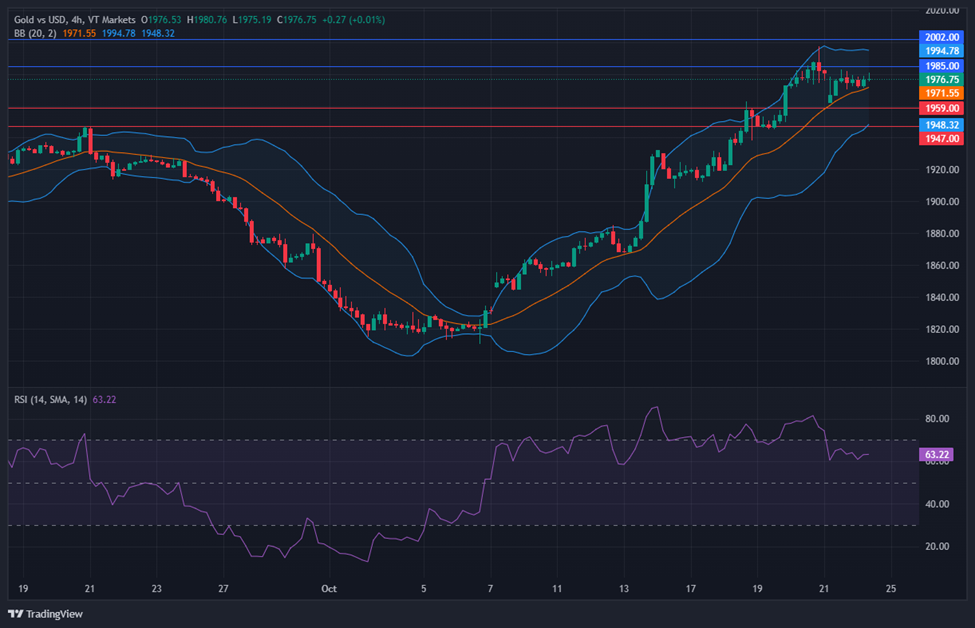
Based on technical analysis, XAU/USD is moving in consolidation on Monday and able to reach the middle band of the Bollinger Bands. Currently, the price of gold is moving just above the middle band, suggesting a possible continuation movement. The Relative Strength Index (RSI) currently registers at 63, indicating a bullish bias for the XAU/USD pair.

Resistance: $1,985, $2,002

Support: $1,973, $1,947

Economic Data
CurrencyDataTime (GMT + 8)Forecast
GBPClaimant Count Change14:002.3K
EURFrench Flash Manufacturing PMI15:1544.4
EURFrench Flash Services PMI15:1544.9
EURGerman Flash Manufacturing PMI15:3040.1
EURGerman Flash Services PMI15:3050.1
GBPFlash Manufacturing PMI16:3044.7
GBPFlash Services PMI16:3049.4
USDFlash Manufacturing PMI21.4549.5
USDFlash Services PMI21.4549.9

Notification of Trading Adjustment – October 23, 2023

Dear Client,

Starting from October 29, 2023, the trading hours of some MT4/MT5 products will change due to the upcoming Daylight Saving Time change in the EU/UK.

Please refer to the table below outlining the affected instruments:

The above information is provided for reference only, please refer to the MT4/MT5 software for specific data.

If you’d like more information, please don’t hesitate to contact [email protected].

Dividend Adjustment Notice – October 23, 2023

Dear Client,

Please note that the dividends of the following products will be adjusted accordingly. Index dividends will be executed separately through a balance statement directly to your trading account, and the comment will be in the following format “Div & Product Name & Net Volume ”.

Please refer to the table below for more details:

The above data is for reference only, please refer to the MT4/MT5 software for specific data.

If you’d like more information, please don’t hesitate to contact [email protected].

Week Ahead: All Eyes on BOC Rate Statement and ECB Rate Statement

Several key events are expected to influence the financial markets this week, including interest rate decisions from the Bank of Canada (BOC) and the European Central Bank (ECB). In light of this, we recommend traders to exercise caution in their trading preparations, keeping in mind the potential for increased market volatility.

Here are some key highlights to keep an eye on during the week:

UK Claimant Count Change (24 October 2023) 

The number of people claiming unemployment benefits in the UK increased by 900 in August 2023. 

Updated figures will be released on 24 October, with analysts expecting an additional increase of 2,300. 

Flash Manufacturing PMI for Germany, the UK, and the US (24 October 2023)

Germany’s manufacturing Purchasing Managers’ Index (PMI) climbed from 39.1 in August 2023 to 39.6 in September 2023. Meanwhile, the UK’s manufacturing PMI for the same period increased from 43 to 44.3. Finally, the US’ manufacturing PMI for the same period rose from 47.9 to 49.8.

Updated figures will be released on 24 October, with analysts expecting manufacturing PMIs of 40.1 for Germany, 44.7 for the UK, and 49.5 for the US.

Flash Services PMI for Germany, the UK, and the US (24 October 2023)  

Germany’s services PMI rose from 47.3 in August 2023 to 50.3 in September 2023. Conversely, the UK’s services PMI declined from 49.5 to 49.3 during this period, while the US’ services PMI also fell from 50.5 to 50.1 during the same period.

Analysts’ forecasted services PMIs for October 2023 are as follows: 50.1 for Germany, 49.4 for the UK, and 49.9 for the US. 

Australia Consumer Price Index (25 October 2023)

The Consumer Price Index (CPI) in Australia increased by 5.2% in August 2023, up from the 4.9% rise recorded in July 2023. 

Analysts are expecting a growth rate of 5.4% for September 2023, with updated figures to be released on 25 October.

Bank of Canada Rate Statement (25 October 2023)

The BOC maintained its overnight rate target at 5% during its September 2023 meeting, marking another pause in its tightening cycle. The bank indicated that future rate decisions would hinge on the most recent economic indicators.

The next rate statement is set to be released on 25 October, with analysts expecting rates to remain at 5%.

European Central Bank Main Refinancing Rate (26 October 2023) 

During its September 2023 meeting, the ECB increased its main refinancing rate by 25 bps to 4.5%. The decision to hike the interest rate was closely contested among ECB members, with the meeting minutes revealing that they were divided by tactical considerations. 

Analysts expect the central bank to maintain a rate of 4.5% following its upcoming meeting on 26 October.

US Advance GDP (26 October 2023) 

The US economy expanded at an annualised rate of 2.1% in Q2 2023, down slightly from the 2.2% growth in Q1 2023.

Data for Q3 2023 is scheduled for release on 26 October, with analysts projecting a growth rate of 4.3%.

US Core PCE Price Index (27 October 2023) 

The Core Personal Consumption Expenditure (PCE) Price Index for the US, excluding food and energy, rose by 0.1% month-over-month in August 2023. This was the smallest increase since November 2020.

Data for September 2023 is scheduled for release on 27 October, with analysts expecting a growth of 0.3%.

Start trading now — click here to create your live VT Markets account.

Dividend Adjustment Notice – October 20, 2023

Dear Client,

Please note that the dividends of the following products will be adjusted accordingly. Index dividends will be executed separately through a balance statement directly to your trading account, and the comment will be in the following format “Div & Product Name & Net Volume ”.

Please refer to the table below for more details:

The above data is for reference only, please refer to the MT4/MT5 software for specific data.

If you’d like more information, please don’t hesitate to contact [email protected].

Stocks Decline as Powell’s Comments and Bond Yields Add Uncertainty

In the latest trading session, stock markets experienced a decline as investors reacted to Federal Reserve Chair Jerome Powell’s remarks regarding elevated inflation and monitored the rise in the benchmark U.S. 10-year Treasury yield. The Dow Jones Industrial Average fell by 0.75%, concluding at 33,414.17, while the S&P 500 and Nasdaq Composite also saw drops of 0.85% and 0.96%, respectively. Powell’s comments indicated a cautious approach to interest rate adjustments, resulting in a 97% probability of rates remaining unchanged at the upcoming policy meeting. Rising bond yields further added to market unease. Despite strong quarterly earnings reports from some S&P 500 companies, all major indexes are poised for weekly losses. In the currency market, the US dollar retreated, influenced by Powell’s speech and yield spreads between different countries’ bonds. The week ahead will be influenced by Japan’s Consumer Price Index (CPI), UK retail sales, and developments in the Israel-Hamas conflict.

Stock Market Updates

Stocks experienced a decline on Thursday as investors closely examined statements from Federal Reserve Chair Jerome Powell and monitored a crucial development in the Treasury bond yield. The Dow Jones Industrial Average fell by 250.91 points, marking a 0.75% drop, concluding at 33,414.17. Simultaneously, the S&P 500 saw a decrease of 0.85% to reach 4,278, and the Nasdaq Composite ended 0.96% lower at around 13,186. Powell acknowledged that inflation remains elevated and may necessitate slower economic growth, while also acknowledging some recent progress in curbing price increases. He stressed that despite these positive developments, inflation remains too high, emphasizing the need for more sustained progress in this regard. Investors interpreted his comments as a signal that the Federal Reserve is unlikely to adjust interest rates at its upcoming policy meeting, with a 97% chance of rates remaining unchanged as per CME Group’s FedWatch tool. Nevertheless, there is lingering uncertainty about the Fed’s long-term rate strategy, causing market volatility.

Rising bond yields also had a bearing on the market’s performance, with the benchmark U.S. 10-year Treasury yield approaching the significant 5% level, last seen in 2007. Additionally, quarterly earnings reports were a point of interest, with more than 15% of S&P 500 companies having already reported this earnings season. Among these, over 74% have surpassed Wall Street’s expectations. Notable moves in individual stocks included Tesla’s 9% decline after it missed analysts’ Q3 earnings and revenue estimates and CEO Elon Musk’s warning about the Cybertruck’s cash flow. Conversely, Netflix shares surged 16% after exceeding third-quarter earnings estimates, largely due to strong ad-tier subscriptions. Beyond the tech sector, AT&T saw a 6% increase following better-than-expected Q3 results, while Blackstone faced an 8% decline due to a weaker-than-anticipated report. As the week concludes, all three major indexes are poised for losses, with the Nasdaq down 1.7%, the S&P 500 down 1.2%, and the Dow down 0.8%.

Data by Bloomberg

On Thursday, the stock market experienced a mixed day with varying sector performances. The overall market saw a decline of 0.85%. Some sectors, such as Communication Services (+0.33%) and Energy (-0.13%), showed modest movements, while others, like Consumer Discretionary (-2.20%) and Real Estate (-2.44%), faced significant declines. Financials (-1.25%) and Materials (-1.08%) also had notable losses, contributing to the overall negative trend. The Health Care (-0.96%), Utilities (-0.93%), Industrials (-0.90%), Consumer Staples (-0.77%), and Information Technology (-0.44%) sectors all experienced moderate decreases in their respective values. 

Currency Market Updates

In the latest currency market updates, the US dollar faced a significant retreat, driven by short-term US yield movements in response to Federal Reserve Chair Jerome Powell’s recent speech. Powell’s comments hinted at a reluctance to raise interest rates unless compelling data suggests a sustained reversal in inflation trends. The EUR/USD pair notably gained 0.46%, building on earlier increases despite widening spreads between German bund and US Treasury yields. This development raised concerns about the potential economic repercussions of higher Treasury yields and the rapidly narrowing 2-10-year yield curve, reaching its tightest level since September 2022. These indicators are perceived as potential warnings for the US economy in the long term, particularly impacting interest rate-sensitive sectors. In the currency market, EUR/USD’s movements near the pivotal levels of October’s high and 23.6% of the July-October decline at 1.0640-43 became crucial.

Additionally, USD/JPY’s effort to reattain the 150 level faced challenges, retracting by 0.05% after a broader pullback in the US dollar following Powell’s speech. Despite this retreat, it was modest, as the decrease in 2-year Treasury yields and spreads over Japanese Government Bond (JGB) yields was somewhat offset by an increase in 10-year yield spreads. The attractiveness of these spreads is maintained due to the gradual pace of policy normalization by the Bank of Japan (BoJ). Meanwhile, the British pound experienced a 0.07% gain, albeit not reaching its earlier highs linked to 2-year gilts-Treasury yield spreads, as short-term US Treasury yields decreased in response to Powell’s statements. However, the pound still remains distant from recent recovery highs and key resistance levels compared to the EUR/USD pair, which surged to break its 200-day moving average for the first time since May. In the broader market, the US dollar index dropped by 0.34%, primarily due to the EUR/USD’s rise, but found support at the kijun level at 1.0594. For a more significant retreat to be signaled, the US dollar would need to close below the 30-day moving average at 105.87 and October’s low at 105.53, falling to a key Fibonacci level at 105.50.

Finally, it is noteworthy that Japan’s Consumer Price Index (CPI) and UK retail sales are anticipated as the final major data releases for the week. Moreover, risk sentiment and oil prices, particularly those of crude-related currencies, will be influenced by the Israel-Hamas conflict and its broader implications. Israel’s defense minister’s statement about troops entering Gaza is expected to have a significant impact on these markets.

Picks of the Day Analysis
EUR/USD (4 Hours)

EUR/USD Gains Momentum Despite Obstacles and Weak Dollar

The EUR/USD saw an upward trend on Thursday, aiming for its highest daily close in over a week, fueled by a weaker US dollar amidst market risk aversion. Nevertheless, it struggled to hold above the 1.0600 mark, signaling potential challenges ahead. Key events to watch include Germany’s upcoming Producer Price Index report and the European Central Bank meeting, with expectations of unchanged key rates. In the US, mixed economic data, Federal Reserve Chair Jerome Powell’s stance on rate stability, and concerns about inflation have contributed to the USD’s weakness, maintaining intrigue in the EUR/USD pairing.

Chart EURUSD by TradingView

Based on technical analysis, the EUR/USD was slightly lower on Thursday, pushing towards the upper band of the Bollinger Bands. Currently, the EUR/USD is trading just above the middle band, suggesting the potential for another lower movement. The Relative Strength Index (RSI) stands at 55, indicating that the EUR/USD is still in neutral bias.

Resistance: 1.0616, 1.0672

Support: 1.0561, 1.0502

XAU/USD (4 Hours)

XAU/USD Surge to Three-Month High as US Dollar Weakens Amid Middle East Tensions and Fed Chairman’s Speech

Gold prices remain on a bullish trajectory, with XAU/USD surpassing $1,970 per troy ounce, its highest level in three months. Initially, the US Dollar found support due to risk-averse sentiment driven by tensions in the Middle East and anticipation of Jerome Powell’s speech at the Economic Club of New York. However, the Greenback later weakened despite global equities’ poor performance and rising government bond yields, as investors interpreted Powell’s words to mean the Federal Reserve would avoid further rate hikes. Speculative interest turned against the USD during Powell’s speech, allowing XAU/USD to maintain its gains. Notably, the 2-year Treasury note yield dropped to 5.16% after reaching a multi-year peak of 5.25%.

Chart XAUUSD by TradingView

Based on technical analysis, XAU/USD is moving higher on Thursday and able to reach the upper band of the Bollinger Bands. Currently, the price of gold is moving just below the upper band, suggesting a possible continuation movement. The Relative Strength Index (RSI) currently registers at 79, indicating a bullish bias for the XAU/USD pair.

Resistance: $1,985, $2,002

Support: $1,973, $1,947

Economic Data
CurrencyDataTime (GMT + 8)Forecast
GBPRetail Sales14:00-0.3%

Notification of Server Upgrade – October 19, 2023

Dear Client,

As part of our commitment to provide the most reliable service to our clients, there will be server maintenance this weekend.

Maintenance Hours :
21st of October 2023 (Saturday) 02:00 – 04:00 (GMT+3)

Please note that the following aspects might be affected during the maintenance:

1. The price quote and trading management will be temporarily disabled during the maintenance. You will not be able to open new positions, close open positions, or make any adjustments to the trades.

2. There might be a gap between the original price and the price after maintenance. The gaps between Pending Orders, Stop Loss and Take Profit will be filled at the market price once the maintenance is completed.

3. Please refer to MT4/MT5 for the latest update on the completion and market opening time. Our services will be back online once the maintenance is completed.

Thank you for your patience and understanding about this important initiative.

If you’d like more information, please don’t hesitate to contact [email protected]

Dividend Adjustment Notice – October 19, 2023

Dear Client,

Please note that the dividends of the following products will be adjusted accordingly. Index dividends will be executed separately through a balance statement directly to your trading account, and the comment will be in the following format “Div & Product Name & Net Volume ”.

Please refer to the table below for more details:

The above data is for reference only, please refer to the MT4/MT5 software for specific data.

If you’d like more information, please don’t hesitate to contact [email protected].

Stocks Tumble as Earnings Reports Disappoint, Treasury Yields Surge

In a tumultuous day for the stock market, major indexes, including the Dow Jones Industrial Average, S&P 500, and Nasdaq Composite, saw significant declines as corporate earnings reports fell short of expectations. The 10-year Treasury yield reached levels not seen since 2007, signaling rising interest rates, while mortgage rates hit a two-decade high. Individual companies were impacted by their earnings reports, with some facing notable declines and others, like Procter & Gamble, experiencing stock gains. The market’s focus has now shifted to revenue growth during the earnings season, and geopolitical factors, such as the Israel-Hamas conflict and U.S. President Joe Biden’s visit to Israel, also influenced market sentiment. Meanwhile, in the currency market, the U.S. dollar saw a modest increase, driven by losses in the EUR/USD and GBP/USD pairs. The rise in Treasury yields compared to bunds attracted investors seeking safety amid growing geopolitical risks.

Stock Market Updates

Stocks experienced a decline on Wednesday as corporate earnings reports continued to roll in, and Treasury yields reached multiyear highs. The Dow Jones Industrial Average fell 332.57 points, or 0.98%, to close at 33,665.08. Similarly, the S&P 500 dropped 1.34% to 4,314.60, while the Nasdaq Composite slipped 1.62% to 13,314.30. None of these major indexes traded in positive territory throughout the day. A key development was the 10-year Treasury yield surpassing 4.9%, a level not seen since 2007, signaling rising interest rates. Simultaneously, the average 30-year fixed mortgage rate hit 8%, the highest rate since 2000.

Earnings reports had a notable impact on individual companies’ stock prices. Companies like J.B. Hunt and United Airlines faced significant declines due to disappointing earnings and soft guidance. In contrast, Procter & Gamble’s stock rose after beating analyst expectations. The market’s attention is now shifting to revenue growth during this earnings season, as investors assess which companies are experiencing increased demand and which are merely improving earnings through cost-cutting measures. Additionally, chip stocks faced challenges as restrictions on the sale of advanced artificial intelligence chips to China were announced by the U.S. Department of Commerce, leading to continued selling in the sector. Geopolitical factors, such as the ongoing Israel-Hamas conflict and U.S. President Joe Biden’s visit to Israel, also contributed to market sentiment.

Data by Bloomberg

On Wednesday, the overall market experienced a decline of 1.34%. Among the various sectors, there was a mixed performance. Energy and Consumer Staples saw gains of 0.93% and 0.39%, respectively. In contrast, there were losses in several sectors, with the largest declines in Consumer Discretionary (-2.33%), Industrials (-2.43%), and Materials (-2.58%). Other sectors, including Health Care, Utilities, Information Technology, Communication Services, Financials, and Real Estate, also saw losses ranging from -0.90% to -2.18%.        

Currency Market Updates

In recent currency market updates, the US dollar experienced a modest increase, with the dollar index rising by 0.16%. This rise was primarily driven by losses in the EUR/USD and GBP/USD currency pairs. The increase in Treasury yields compared to bunds attracted investors seeking safety amid growing geopolitical risks. However, it’s worth noting that the yen and Swiss franc appreciated more against other currencies than the US dollar did, particularly against high-beta currencies. EUR/USD faced a decline of 0.23% as the spreads between 2-year bund and Treasury yields reached their most negative levels since August. Additionally, 10-year spreads were at their lowest point since May 2022, but a late pullback in Treasury yields may influence the overall trend. Notably, there hasn’t been a close below 1.0500 for EUR/USD since October 3.

The market also observed that concerns over the Israel-Hamas conflict potentially impacting energy supplies posed a greater threat to eurozone countries that rely more heavily on energy imports than the United States. Meanwhile, the rise in 2-year Treasury yields was influenced by stronger-than-expected US economic data and comments from Federal Reserve speakers favoring maintaining higher interest rates for an extended period while monitoring economic indicators. Unless the Fed decides to raise rates again in January, which is currently priced at a 50% probability, there may be limited upside left for 2-year yields. Other notable movements included a decline in the British pound (GBP) as risk-off sentiment prevailed, though gilt-treasury yield spreads rebounded slightly due to above-forecast UK inflation data. The Australian dollar and other risk-sensitive currencies also fell, while the Chinese yuan slipped following brief gains on above-forecast Chinese data. Upcoming economic events include jobless claims, existing home sales, and comments from Federal Reserve Chair Jerome Powell.

Picks of the Day Analysis
EUR/USD (4 Hours)

EUR/USD Slips Below Key Moving Average as US Dollar Strengthens Amid Geopolitical Concerns and Soaring Treasury Yields

EUR/USD dropped below the 20-day Simple Moving Average (SMA) as it faced resistance at 1.0600, primarily due to the US Dollar’s overall strength driven by deteriorating market sentiment and rising Treasury yields. The initial boost in market sentiment from positive Chinese growth data was short-lived, with geopolitical concerns taking center stage and further supporting the US Dollar. The 10-year Treasury yield reached its highest level since 2007 at 4.92%, adding to the Greenback’s momentum. The upcoming economic data releases and a speech by Federal Reserve Chair Powell, underscore the continuing bearish trend for the EUR/USD pair due to favorable fundamentals for the US Dollar.

Chart EURUSD by TradingView

Based on technical analysis, the EUR/USD was slightly lower on Wednesday, pushing towards the middle band of the Bollinger Bands. Currently, the EUR/USD is trading just below the middle band, suggesting the potential for another lower movement. The Relative Strength Index (RSI) stands at 44, indicating that the EUR/USD is still in neutral bias.

Resistance: 1.0573, 1.0616

Support: 1.0502, 1.0460

XAU/USD (4 Hours)

XAU/USD Surges to Two-Month High Amid Escalating Middle East Tensions

Gold (XAU/USD) made a strong resurgence, hitting a fresh two-month high at $1,962.62 per troy ounce as Middle East tensions escalated. Despite some mid-American session retracement to around $1,949, XAU/USD maintained its gains, partly due to the U.S. Dollar’s uptick following a decline in stock markets. Meanwhile, President Joe Biden’s brief visit to Israel further heightened the geopolitical situation in the region. Mixed macroeconomic data, including robust Chinese growth and higher-than-expected UK inflation, added to market uncertainty, leading to a 0.52% decline in the Dow Jones Industrial Average amid a challenging day for earnings reports.

Chart XAUUSD by TradingView

Based on technical analysis, XAU/USD is moving slightly higher on Wednesday and is able to reach the upper band of the Bollinger Bands. Currently, the price of gold is moving just below the upper band, suggesting a possible correction to reach the middle band. The Relative Strength Index (RSI) currently registers at 69, indicating a bullish bias for the XAU/USD pair.

Resistance: $1,952, $1,962

Support: $1,939, $1,928

Economic Data
CurrencyDataTime (GMT + 8)Forecast
AUDEmployment Change08:306.7K (Actual)
AUDUnemployment Rate08:303.6% (Actual)
USDUnemployment Claims20:30210K

Demystifying Japanese Candlesticks: A Beginner’s Guide 

The story of Japanese candlesticks unfolds in 18th century Japan, a time when rice trading was a pivotal economic activity. Merchants and traders required a reliable method to analyse and predict price movements of rice, a commodity of immense importance. This necessity led to the development of what we now know as Japanese candlesticks. 

Dojima Rice Exchange in Japan, 18th century
source: JPX

Japanese traders, in their quest for a more intuitive and visual way to interpret market movements, created a graphical representation that would later revolutionise the world of financial analysis. The candlestick charting technique was born, allowing them to observe the price action in a structured and insightful manner. 

Fast forward to the present day, Japanese candlesticks have become an integral part of technical analysis in financial markets across the globe, particularly in the vast arena of Forex trading. The elegance and effectiveness of this tool have stood the test of time, making it a cornerstone of modern trading strategies. 

Understanding Japanese candlesticks is more than just learning about patterns and shapes. It’s about delving into a historical narrative that encapsulates the evolution of financial markets and the human desire to decode the enigma of market behaviour. 

By grasping the essence of Japanese candlesticks, traders gain a powerful lens through which they can decipher price movements, enabling them to make informed and strategic trading decisions. 

In this guide, we will explore the fundamentals of Japanese candlesticks and equip you with the knowledge needed to navigate the Forex market confidently. 

Understanding Japanese Candlesticks 

Japanese candlesticks serve as the cornerstone of technical analysis in the realm of Forex trading. These simple yet powerful graphical representations offer invaluable insights into price movements, making them an essential tool for traders. 

Japanese Candlestick Types

Structure of a Candlestick 

A candlestick is like a visual snapshot of the price movement over a specific time period. It encapsulates three crucial components that provide a comprehensive view of market dynamics: 

  • Body: The central, solid part of the candlestick represents the price range between the opening and closing prices during the given time frame. If the closing price is higher than the opening price, the body is typically coloured green or white, indicating a bullish movement. Conversely, if the closing price is lower than the opening price, the body is coloured red or black, indicating a bearish movement. 
  • Wick (Upper and Lower Shadows): The thin lines, often referred to as the wicks or shadows, extend from the body at both ends. The upper shadow denotes the highest price reached during the time period, while the lower shadow represents the lowest price. These wicks help visualise the price fluctuations and volatility. 
  • Shadow: The entire length from the highest point of the upper shadow to the lowest point of the lower shadow is termed as the shadow, signifying the entire price range for that period. 

Types of Candlesticks 

Candlesticks come in various shapes and forms, each conveying unique market sentiments. They are broadly categorised into three types

  • Bullish Candlesticks: These candlesticks signal a price increase during the specified time period. Their bodies are usually green or white, illustrating a positive market sentiment and a potential uptrend. 
  • Bearish Candlesticks: Conversely, bearish candlesticks indicate a price decrease over the designated time frame. Their bodies are commonly red or black, symbolising a negative market sentiment and a potential downtrend. 
  • Doji Candlesticks: The Doji candlestick is a special case where the opening and closing prices are nearly equal, resulting in a very short or non-existent body. Doji candlesticks signify market indecision and often precede significant price movements. 

Colour Coding of Candlesticks 

Understanding the colour coding of candlesticks aids traders in swiftly identifying market trends and interpreting price movements: 

  • Bullish Candlesticks: Typically, these candlesticks are portrayed in green or white, signifying optimism and an upward price movement. 
  • Bearish Candlesticks: Conversely, bearish candlesticks are usually depicted in red or black, indicating a pessimistic outlook and a downward price movement. 

Interpreting Japanese Candlesticks 

To effectively utilise Japanese candlesticks in Forex trading, understanding common candlestick patterns and their implications is crucial. These patterns can provide valuable insights into market sentiment and potential trend changes, aiding traders in making informed decisions. 

Japanese Candlestick Patterns
source: ResearchGate

Common Candlestick Patterns 

  • The Doji candlestick is a significant pattern that signifies market indecision. It occurs when the opening and closing prices are very close to each other, resulting in a candlestick with a very short or non-existent body. Doji patterns suggest that neither buyers nor sellers have gained control, often preceding major price movements. 
  • The Hammer candlestick pattern is characterised by a small body at the top and a long lower shadow, resembling a hammer. It typically occurs after a downtrend and signals a potential price reversal. Hammers indicate that sellers drove the price lower during the session, but buyers managed to push the price up, showcasing potential buying interest. 
  • A Shooting Star candlestick pattern is the opposite of a hammer. It has a small body at the bottom and a long upper shadow, resembling an inverted hammer. This pattern occurs after an uptrend and implies a potential bearish reversal. It suggests that although buyers pushed the price higher during the session, sellers entered the market and pushed the price down, indicating potential selling pressure. 
  • The Engulfing candlestick pattern involves one candle completely “engulfing” the previous one. In a bullish engulfing pattern, the first candle is smaller and bearish, followed by a larger bullish candle. This suggests a reversal in the current downtrend. Conversely, a bearish engulfing pattern occurs during an uptrend, indicating a potential reversal to a downtrend. 
  • A Spinning Top candlestick is characterised by a small body and long upper and lower shadows. This pattern reflects market indecision, showcasing a battle between buyers and sellers. Spinning tops suggest that neither buyers nor sellers were able to dominate, leaving the market uncertain about its direction. 

Analysing Length and Shape 

Apart from candlestick patterns, the length and shape of the candlestick body and wicks provide additional insights into market sentiment: 

  • Candlestick Body Length: A long bullish (green or white) or bearish (red or black) body indicates strong buying or selling activity during the session, reflecting market conviction. 
  • Wick Length: Long wicks signify price fluctuations and uncertainty. Longer upper shadows indicate potential resistance levels, while longer lower shadows indicate potential support levels. 
Japanese Candlesticks Strength
source: priceNpedia on x.com

Applying Japanese Candlesticks in Forex Trading 

To leverage Japanese candlesticks effectively in your trading strategy, follow these tips

1. Identify Trends 

  • Identifying Trend Reversals: Look for reversal patterns like the Hammer or Shooting Star after a prolonged trend. For instance, a Hammer after a downtrend could signal a potential trend reversal to the upside. 
  • Spotting Continuation Patterns: Patterns like Bullish or Bearish Engulfing can suggest that the existing trend is likely to continue. If the pattern aligns with the current trend direction, it provides confidence in holding or adding to a position. 

2. Combine with Indicators 

  • Moving Averages: Utilise moving averages to identify the overall trend direction. When a candlestick pattern aligns with the moving average direction, it provides a more robust confirmation of potential market movements. 
  • Relative Strength Index (RSI): RSI is excellent for gauging overbought or oversold conditions. When a candlestick pattern suggesting a reversal aligns with RSI indicating an overbought or oversold market, it strengthens the reversal signal. 

3. Set Entry and Exit Points 

  • Entry Points: Use bullish patterns like Bullish Engulfing or Hammer as signals to enter a trade, especially if they align with a trend confirmation from other indicators. Place your entry point just above the high of the pattern. 
  • Exit Points: For exit points, utilise bearish patterns like Bearish Engulfing or Shooting Star. These patterns can indicate potential price declines, prompting you to exit a trade. Set your exit point just below the low of the bearish pattern. 
  • Implement Stop-loss and Take-profit Strategies: Always incorporate stop-loss and take-profit levels to manage your risk effectively. Determine your stop-loss based on the pattern’s low for bullish trades and high for bearish trades. Adjust your take-profit levels based on the potential price movement indicated by the pattern. 

Common Mistakes and How to Avoid Them 

Avoid these common errors to enhance your candlestick analysis: 

  • Overcomplicating Analysis: Keep your analysis simple and focused on the most essential patterns. Overcomplicating can lead to confusion and poor decision-making. 
  • Ignoring Market Context: Consider broader market trends and economic indicators alongside candlestick patterns to make well-informed trading decisions. 
  • Trading Solely Based on Candlestick Patterns: While candlesticks are powerful, relying solely on them can be risky. Always consider a holistic approach to your analysis. 

In conclusion, mastering Japanese candlesticks is a fundamental step towards becoming a successful Forex trader. By understanding their structure, interpreting patterns, and applying them effectively, you can gain valuable insights into market sentiment and potential trends. Avoiding common mistakes and integrating candlestick analysis into a comprehensive trading strategy will set you on the path to success in the dynamic world of Forex trading. Keep learning and practicing to refine your skills and achieve your trading goals. 

Summary: 

  • Japanese candlesticks, originating in 18th century Japan, are crucial in modern financial analysis, especially in Forex trading. 
  • Understanding candlestick structure and types is vital for interpreting market movements. 
  • Colour coding (green/white for bullish, red/black for bearish) helps identify trends quickly. 
  • Common candlestick patterns provide insights into market sentiment and trend changes. 
  • Analysing length and shape of candlestick components (body, wicks) offers additional market insights. 
  • Applying candlesticks in Forex involves identifying trends, combining with indicators, and setting entry/exit points with stop-loss/take-profit strategies. 
  • Avoid overcomplicating analysis and integrate candlestick analysis into a comprehensive trading strategy for success in Forex trading. 
Back To Top
server

Hai 👋

Bagaimana saya boleh membantu?

Segera berbual dengan pasukan kami

Chat Langsung

Mulakan perbualan secara langsung melalui...

  • Telegram
    hold Ditangguh
  • Akan datang...

Hai 👋

Bagaimana saya boleh membantu?

telegram

Imbas kod QR dengan telefon pintar anda untuk mula berbual dengan kami, atau klik di sini.

Tidak ada aplikasi Telegram atau versi Desktop terpasang? Gunakan Web Telegram sebaliknya.

QR code