The US stock market struggled to make gains due to concerns that a recent surge in prices may be overblown, given ongoing economic risks. The fate of the 2023 stock market recovery hinges on four major events before the Federal Reserve’s March 22 meeting, which will determine if the market will rebound after its February slump or experience a setback. Prior to the influential jobs report on Friday, Fed Chair Powell’s two-day appearance before Congress will set expectations for the next policy meeting. While Powell may highlight the economy’s resilience and the challenges of reaching inflation targets, experts predict he will not be overly hawkish or suggest a 50 basis-point hike.
On Monday, the S&P 500 briefly rose almost 1% before losing momentum. Most sectors remained relatively unchanged, with four staying in positive territory by the end of the day. Information technology performed best with a daily gain of 0.53%, while the materials sector suffered the most, falling 1.65%. Additionally, the Nasdaq 100 remained relatively stable, the Dow Jones Industrial Average rose 0.1%, and the MSCI world index gained 0.3% for the day.
Main Pairs Movement
On Monday, the US dollar experienced a 0.23% decrease in value. The Euro and CHF saw gains as Eurozone bond yields rose following hawkish comments from ECB officials. Investors are anxiously waiting for the key testimony from Federal Reserve Chairman Jerome Powell, especially given the challenges for the Fed’s hawkish monetary policy in light of recently mixed US data and Fed talks.
The EUR/USD pair reached weekly highs near 1.0700 but trimmed its gains, as it struggled to reclaim the round-level resistance of 1.0700 at the end of Monday. Eurozone Retail Sales data showed an annual contraction of -2.3%, which underscores the European Central Bank’s need for increased retail demand to achieve price stability.
Gold experienced a 0.52% decrease in value and remains under pressure after reversing from a three-week high. The upcoming speech from Federal Reserve Chairman Jerome Powell this week may have a negative impact on the price of gold, and the rebound of US Treasury bond yields has extended the downward pressure on the metal. Gold’s first support level is at the confluence of $1846.00, and if it breaks through, the price is expected to fall toward the March 3 daily low of $1835.51.
Technical Analysis
EUR/USD (4-Hour Chart)
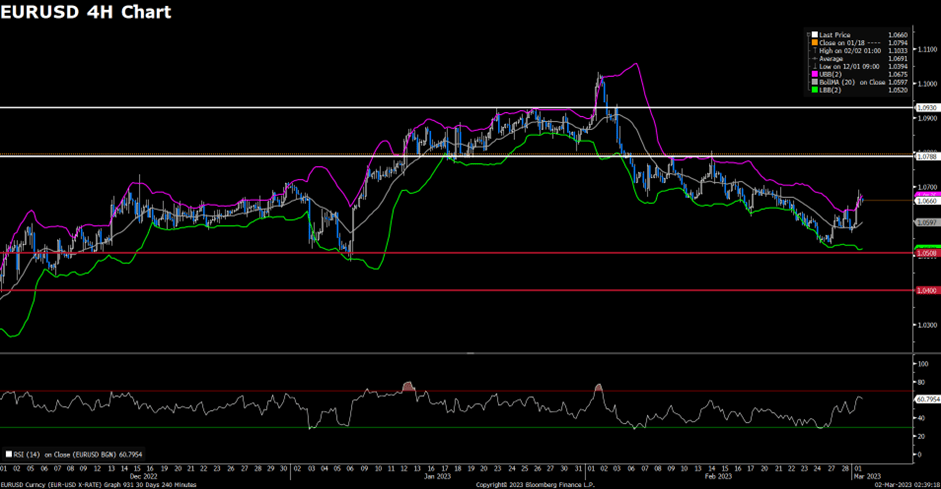
On Monday, the EUR/USD pair gained bullish momentum, climbing to a daily high around the 1.0690 mark due to a positive shift in risk sentiment. Currently, the pair is trading at 1.0672, with a daily gain of 0.36%. The EUR/USD is staying in positive territory, mainly due to the weaker US Dollar against its major rivals and the risk-on impulse in the financial markets as reflected by US equities. Investors are also preparing for the US Federal Reserve (Fed) Chairman Jerome Powell’s speech at the US Congress on March 7 and 8, where he is expected to reiterate the Fed’s commitment to curb inflation and emphasize the need to maintain higher rates for longer periods.
Despite lower-than-expected economic data in the Eurozone, the Euro is outperforming on Monday. The Sentiment Investor Confidence index dropped in March to -11.1, and Retail Sales rose only 0.3% in February, below the 1% increase expected by the market consensus.
Regarding technical analysis, the RSI indicator is at 60, suggesting that the pair may witness some short-term corrections as the RSI is falling toward 60. The Bollinger Bands indicate that the price failed to maintain its upside traction and retreated from the upper band, indicating some downside movements. In conclusion, we believe that the market will be bearish as long as the 1.0710 resistance line holds. On the upside, bulls could have better chances if the EUR/USD regains the aforementioned 1.0710 level.
Resistance: 1.0710, 1.0790
Support: 1.0624, 1.0580, 1.0540
XAUUSD (4-Hour Chart)
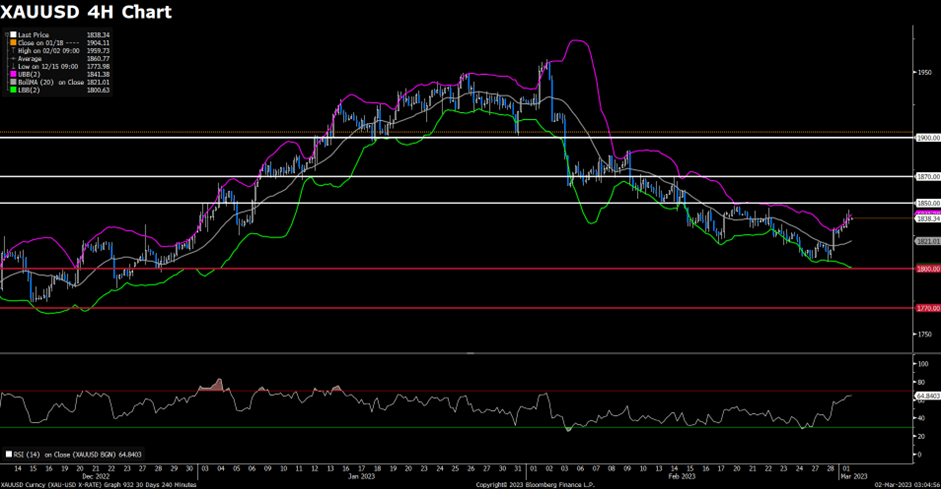
The price of gold has fallen below $1,850 due to elevated US bond yields. At the time of writing, XAUUSD is trading at a daily low of $1,846.195, which represents a 0.5% or $13.085 drop from Monday’s trading session close. The US stock market is reflecting a risk-on impulse in the financial markets.
XAUUSD is likely to remain volatile as market participants prepare for US Federal Reserve Chairman Jerome Powell’s speech at the US Congress on March 7 and 8. Additionally, the market is focused on US employment data. In the prior month’s US Nonfarm Payrolls report, which crushed estimates of 200K, over 500K jobs were created in the economy. Positive data would send the price of gold further down, as further tightening in the labor market would warrant higher rates in the US economy to curb inflation.
On the technical side, from a daily chart perspective, the price is neutral to upward-biased once it conquers the 20 and 50-day EMAs. However, as US treasury bond yields trend upwards, gold is feeling the pressure, falling back to the $1,850 area. Moreover, the RSI exceeded 50 before turning bearish. Therefore, in the short term, the path of least resistance is downwards. The first support would be the 20 and 50-day EMAs at $1,846, followed by the previous low of $1835.51, the 100-day EMAs at $1,822.15, and the 200-day EMAs at $1805.16.
Major central banks are setting the stage for global markets this week, as key economies such as Japan and Australia will announce changes to their benchmark interest rates. The markets will also closely observe the US and Canada Employment Change. Monitoring these key metrics worldwide can help traders make better trading decisions.
Here are key events to watch out for:
Consumer Price Index (CPI) | Switzerland (March 6)
In January 2023, the CPI in Switzerland rose by 0.6% from the previous month. The figure for February is projected to be 0.4%.
Reserve Bank of Australia (RBA) Rate Statement | Australia (March 7)
The RBA increased the cash rate by 25bps to 3.35% in February, the ninth increase since May 2022.
Analysts expect the RBA to raise interest rates by another 25bps to 3.6%.
ADP Non-Farm Employment Change | US (March 8)
US private businesses generated 106,000 jobs in January 2023, substantially lower than the 253,000 jobs created in December 2022.
Analysts anticipate the US to add 168,000 jobs for February.
Bank of Canada (BOC) Rate Statement | Canada (March 8)
In its first meeting of 2023, the BOC increased its overnight rate by 25bps to 4.5% and suggested that it would conclude its aggressive tightening cycle if economic developments conformed to the central bank’s outlook.
For this month, analysts project that the BOC will keep the rates unchanged.
Bank of Japan (BOJ) Rate Statement | Japan (March 10)
During its January meeting, the BOJ unanimously decided to retain its key short-term interest rate at -0.1%, and maintain the 10-year bond yields at approximately 0%.
For this month, analysts predict that the BOJ will keep the rates unchanged.
Gross Domestic Product (MoM) | UK (March 10)
For the first time in three months, the British economy shrank 0.5% month-on-month in December 2022.
Analysts predict the UK GDP to be 0.0% in January 2023.
Employment Change | US and Canada (March 10)
In January 2023, the US economy added an unexpected 517,000 jobs, marking the most jobs created since July 2022, while the unemployment rate fell to 3.4%, the lowest since May 1969. During the same period, Canada added 150,000 jobs, the highest since February last year, and maintained an unemployment rate of 5%.
For February 2023, analysts anticipate the US to add 200,000 jobs, resulting in an unemployment rate of 3.6%. In Canada, employment is expected to increase by 20,000, with an unemployment rate of 5.2%.
US stocks managed to snap a three-week losing streak following Friday’s rally. Market sentiment remained upbeat despite a report showing resilience in the service sector, as more investors wagered the impact of the Fed’s hikes on the economy would be delayed. Bond yields rose for the week though Treasuries rallied on Friday, with the 10-year yield hovering around 3.96%. A dollar benchmark had its worst week since mid-January, ending four consecutive weeks of gains.
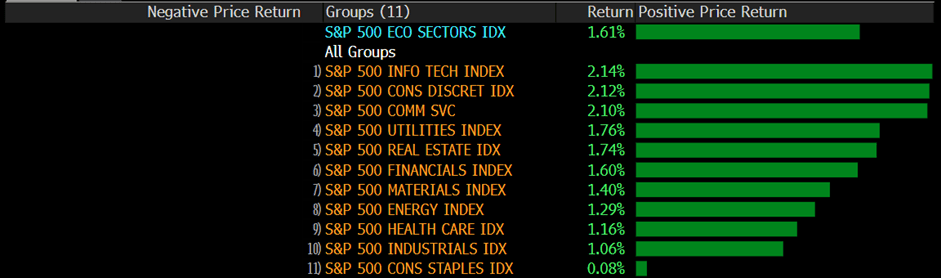
All eyes will be on the non-farm payrolls report next week for clues on whether the economy can handle more rate hikes. Data this week showed continued labor-market resilience in the US, supporting the case for the Fed to stick to its tightening policy. This theme had pushed almost every major asset into the red in February. In the benchmark, the Nasdaq 100 scored its best day since early February and all sectors of the S&P500 stayed in positive territory on Friday. Especially for the Information technology, Consumer Discretion, and Communication Services, sectors recorded more than 2% gains on a daily basis. Apart from this, the Dow Jones Industrial Average rose 1.2%, the Nasdaq 100 rallied by 2%, and the MSCI world index edged higher by 0.4% on Friday.
Main Pairs Movement
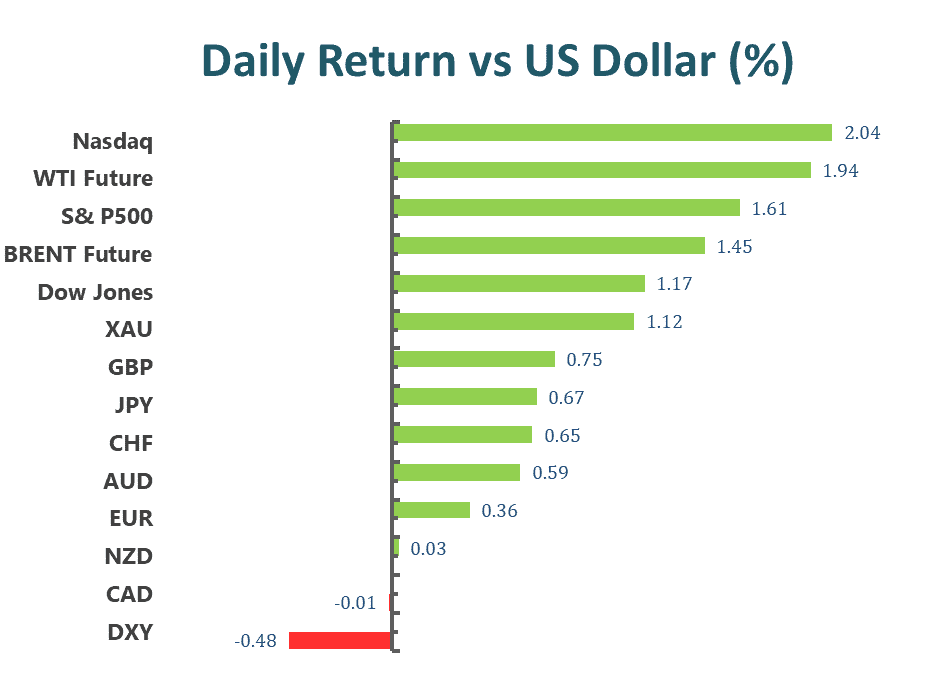
On Friday, the US dollar fell 0.48% against a basket of major currencies as investors increasingly bet that the Fed would hold off on raising interest rates, despite a report showing resilience in the service sector. The DXY index remained bearish throughout the day, closing below the key level of 104.530, even with the strong-than-expected labor report.
In contrast, the GBPUSD saw strong upward momentum, surging above the 1.2040 level, buoyed by the weaker US dollar. The pair closed the day with a 0.75% gain. The EURUSD also recovered, rising 0.36% on Friday, supported by the falling US dollar.
Meanwhile, gold rallied dramatically with a 1.12% gain on Friday, marking its first weekly gain in five weeks as buyers cheered the softer US dollar. The XAUUSD was surrounded by strong bullish momentum, closing above the $1855 mark on the last day of the week.
Technical Analysis
EURUSD (4-Hour Chart)
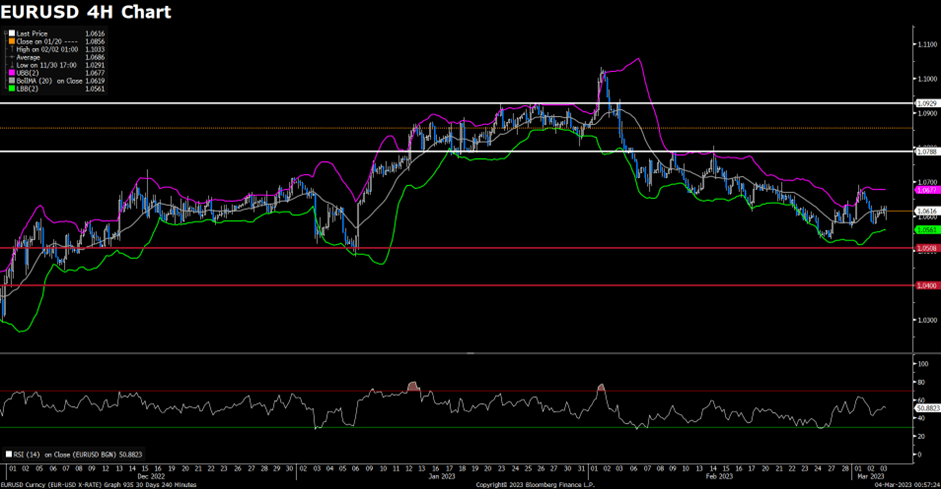
On Friday, the EURUSD saw a rally above the 1.0600 level in the middle of the American trading session. The US ISM Non-Manufacturing PMI for February was 55.1, which was slightly lower than the previous month’s 55.2, but it exceeded market expectations of 54.5, indicating that business activity is still strong. However, the Prices Paid Index subcomponent, which is looked at by investors for inflationary pressures, increased to 65.6, above estimates of 64.5, acting as a tailwind for the US Dollar. In the Eurozone, ECB Vice-President De Guindos suggested that headline inflation should fall below 6% at some point in mid-year. He also reiterated that decisions on future rate hikes will remain data-dependent and that the economy of the region is doing better than expected.
From a technical perspective, the four-hour scale RSI indicator rallied to the neutral region at 51 figures, suggesting that the pair currently has no obvious tendency. As for the Bollinger Bands, the pair was pricing around the 20-period moving average, showing that the pair now needs some fuel to help decide the direction.
Resistance: 1.0788, 1.0929
Support: 1.0508, 1.0400
XAUUSD (4-Hour Chart)
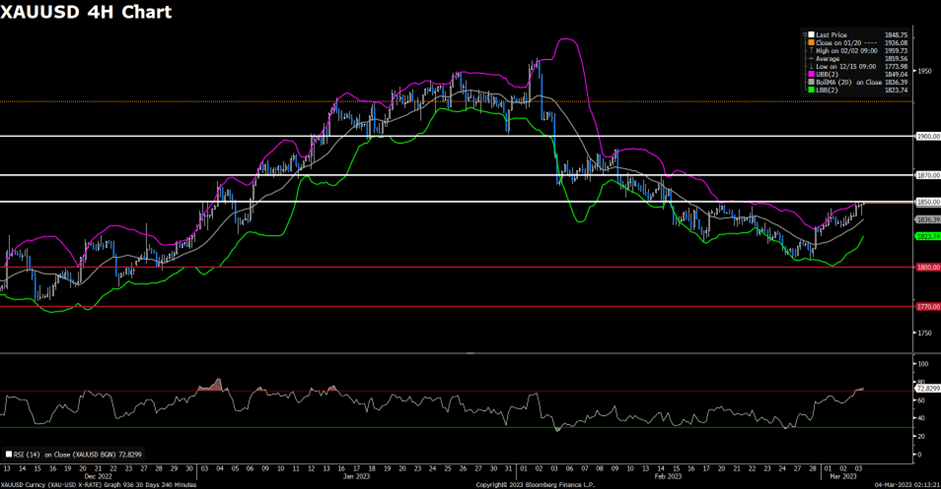
Despite the ISM Services PMI strengthening the US Dollar, gold prices rebounded toward the $1850 level on Friday. Additionally, the benchmark 10-year US Treasury bond yield remaining below 1.4% at the time of writing further supported the XAUUSD’s upward movement. The latest round of Federal Reserve (Fed) talks has renewed speculation about a policy pivot and combined with mixed US data, put downside pressure on the US Dollar and Treasury bond yields. However, cautious sentiment ahead of top-tier data/events and concerns about the Sino-American tussle over China’s ties to Russia is limiting XAU/USD’s immediate upside potential. Investors should focus on next week’s Fed Chairman Jerome Powell’s testimony and the monthly US jobs report for February.
From a technical standpoint, the four-hour RSI indicator has risen into the overbought zone at 72, indicating strong bullish momentum for the pair, and investors should be cautious of potential corrective pullbacks. Regarding the Bollinger Bands, the pair continues to price along the upper band, but the distance between the upper and lower bands has decreased, indicating that the upward trend may not be sustainable for an extended period.
US stocks rebounded on Thursday, ending a two-day losing streak, following Federal Reserve Bank of Atlanta President Raphael Bostic’s announcement that the central bank may pause rate hikes this summer. US Treasury bond yields had earlier risen to multi-month highs amid inflation fears, supporting the US dollar. However, other central bank officials have reiterated hawkish rhetoric, with Boston Fed President Susan Collins stating that more rate hikes are needed to control inflation, and economic data indicates a more restrictive monetary policy. Initial Jobless Claims declined to 190K, and Unit Labor Cost for Q4 was revised higher from 1.6% to 3.2%.
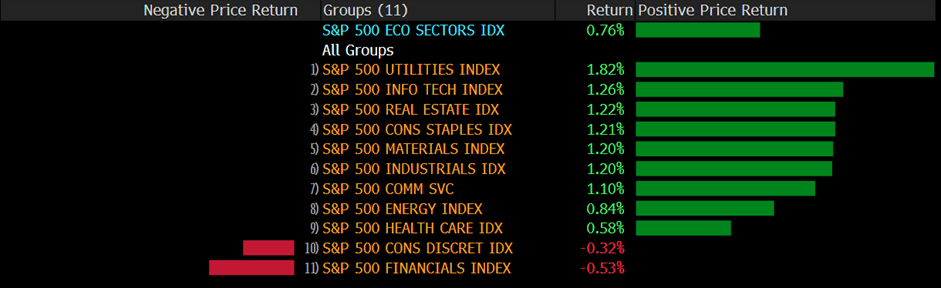
Both the S&P 500 and Dow Jones Industrial Average rebounded higher on Thursday, with the S&P 500 jumping the most in over two weeks and rising by 0.8%, while the Dow Jones Industrial Average rose by 1.1%. Nine out of eleven sectors in the S&P 500 stayed in positive territory, with the Utilities and Information Technology sectors being the best performers, rising 1.82% and 1.26%, respectively. Meanwhile, the Nasdaq 100 climbed higher with a 0.9% gain, and the MSCI World index remained little changed for the day.
Main Pairs Movement
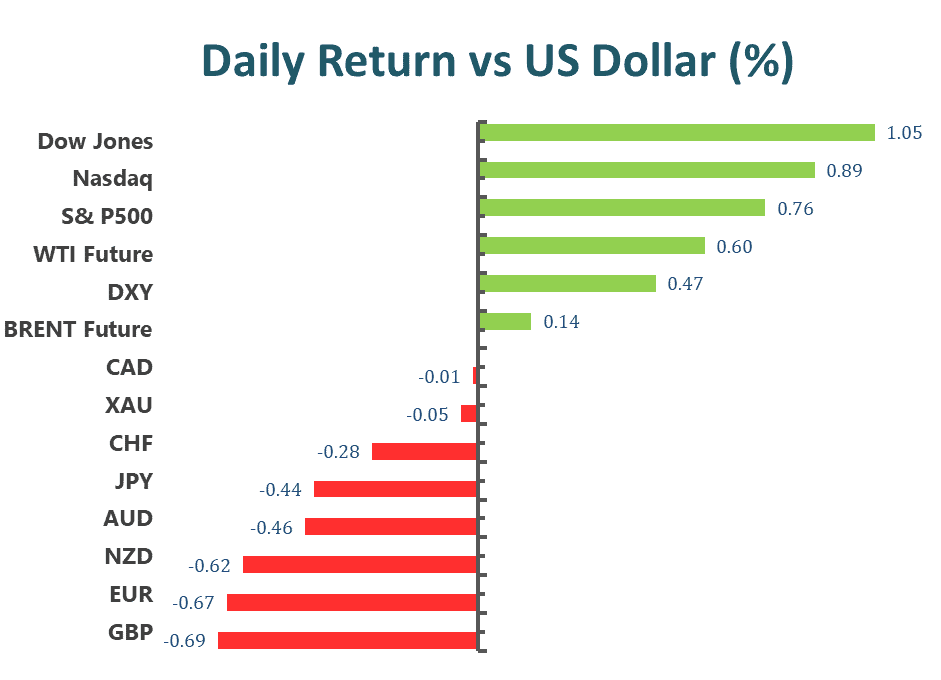
The US dollar advanced higher on Thursday, erasing its recent losses and extending the intraday rally to a daily high above the 105.10 mark on the back of US economic data and higher US yields. The escalating fears of inflation and higher rates from major central banks allowed the US Dollar to post the biggest daily jump since early February. However, late Thursday’s comments from Bostic joined the cautious mood and let the greenback hold onto its gains.
GBP/USD dropped lower on Thursday with a 0.69% loss after the cable extended its intraday slide and touched a daily low near the 1.1930 mark in the late US session after US economic data warranted further tightening by the US Federal Reserve. On the UK front, investors are anticipating a pause or a deceleration in the pace of interest rate hiking by the Bank of England, which is expected to dump the Cable. Meanwhile, EUR/USD also witnessed selling momentum and touched a daily low below the 1.0580 mark, down almost 0.67% for the day.
Gold retreated slightly with a 0.05% loss for the day after halting its recent surge and falling from the weekly high above the $1842 level during the US trading session, as US Treasury bond yields gathered strength and exerted bearish pressure on the yellow metal. Meanwhile, WTI Oil climbed higher with a 0.60% daily gain.
Technical Analysis
EURUSD (4-Hour Chart)
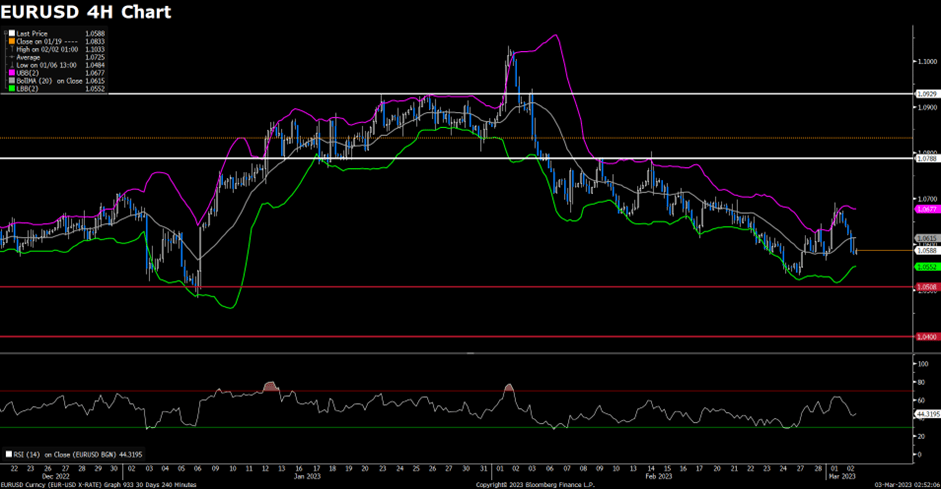
On Thursday, the EURUSD faced bearish pressure and dropped below the 1.0600 level in the early American trading session. This was due to the Unit Labor Costs in the US increasing at a more robust pace than expected in Q4, causing the US Dollar to gain more strength. While the US Federal Reserve and European Central Bank officials maintained their hawkish rhetoric, ECB President Christine Lagarde noted in a TV interview that bringing inflation down will take time. She repeated that the possibility of a 50 basis points rate hike this month is still on the table since inflation remains high. However, the Eurozone Harmonised Index of Consumer Prices (HICP) rose 8.5% YoY in February compared to January’s 8.6%, missing the market’s expectation of 8.2%. Additionally, the core annual reading printed at 5.6%, higher than the previous 5.3%, and above the market expectations.
In technical terms, the four-hour scale RSI indicator retreated to a neutral area of 46 figures, suggesting that the pair is currently moving sideways. As for the Bollinger Bands, the pair was falling below the 20-period moving average, and the size between the upper and lower bands has changed little, indicating that the pair has not made a directive move.
Resistance: 1.0788, 1.0929
Support: 1.0508, 1.0400
XAUUSD (4-Hour Chart)
On Thursday, XAUUSD declined as the US Dollar gained momentum due to concerning news. Financial markets are preoccupied with worries about inflation and how central banks will react to persistent price pressures. In February, the Eurozone Harmonised Index of Consumer Prices (HICP) rose 8.5% YoY, a slight improvement from January’s 8.6%. However, it missed market expectations of 8.2%. Furthermore, the core annual reading came in at 5.6%, higher than both the previous and expected 5.3%. These troubling figures align with ECB President Lagarde’s statement that inflation’s decline is still unstable and remains too high. Meanwhile, the US Fed is also delivering hawkish messages, suggesting that the central bank may raise rates by more than 25 bps in upcoming meetings.
From a technical perspective, the RSI indicator on the four-hour scale was stable above the midline and measured 60 at the time of writing. This suggests that the pair had strong positive momentum. The Bollinger Bands showed that the pair was trading firmly in the upper area, indicating that gold retained its bullish momentum and was more likely to continue on an upward trajectory shortly.
US stocks declined lower on Wednesday, witnessing some selling pressure, and dropped for a second straight session after economic data highlighted persistent inflationary pressures and Federal Reserve officials continued to sound hawkish. Data released in the US showed ISM Manufacturing PMI increases to 47.7 in February, which came in below the market expectation of 48.
The PMI report indicated that the economic activity in the US manufacturing sector continued to contract in February, providing some support to the US Dollar. Meanwhile, stock markets witnessed downside pressure as investors are still struggling to ignore fears of more rates from the Federal Reserve. Moreover, hawkish commentaries delivered by Fed policymakers also fueled US Treasury yields as Minneapolis Fed President Neel Kashkari reiterated on Wednesday that inflation in the US is still very high and that their job is to bring it down. The jump in the US Treasury bond yields suggests the market’s fears of inflation and recession, which in turn undermined the stock markets.
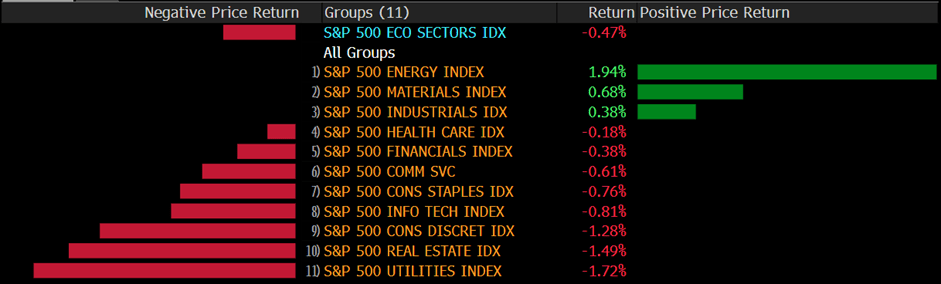
The benchmarks, S&P 500 and Dow Jones Industrial Average both declined lower on Wednesday as the S&P 500 closed the day at its lowest level in nearly six weeks as market sentiment remained fragile after Fed officials stay hawkish. The S&P 500 was down 0.5% daily and the Dow Jones Industrial Average meanwhile was little changed for the day. Eight out of eleven sectors in the S&P 500 stayed in negative territory as the utility sector and the Real Estate sector is the worst performing among all groups, losing 1.72% and 1.49%, respectively. The Nasdaq 100 meanwhile dropped the most with a 0.9% loss on Wednesday and the MSCI World index was down 0.3% for the day.
Main Pairs Movement
DXY was lower across the board after the release of China’s manufacturing PMI last month, the highest in over a decade. Price fell 0.45% to 104.40 in late trading New York session on Wednesday. The ISM Manufacturing Index edged up to 47.7 last month, the first increase in six months, but remains in contractionary territory. At the time of writing, the price traded at 104.385.
WTI bulls are in the market amid signs of stronger demand in Asia and Europe. Fundamentally, US commercial crude oil inventories gained less than expected last week, rising only 1,166kbbl. However, US exports of crude hit a record high of 5,629kbbl last week (+22.4% w/w). At the time of writing, the price traded at 77.764.
The Dow Jones Industrial Average rose 5.14 points, or 0.02%, to 32,661.84, the S&P 500 lost 18.76 points, or 0.47%, to 3,951.39 and the Nasdaq Composite dropped 76.06 points, or 0.66%, to 11,379.48.
Technical Analysis
EURUSD (4-Hour Chart)
The EURUSD trimmed gains but held above the critical short-term support level following the release of the ISM Manufacturing PMI, which boosted the US Dollar across the board. Data released in the US showed activity in the Manufacturing sector contracted again in February with the ISM PMI rising from 47.4 to 47.7 (below 50 marks contraction), against a market consensus of 48. The inflation indicators of the ISM report pushed Treasury yields to the upside. The US 10-year bond yield reached 4% for the first time since November. In the Eurozone, the preliminary estimate of the German Harmonized Index of Consumer Prices (HICP) rose at an annualized pace of 9.3% in February, hotter than the previous 9.2% and the 9% anticipated by market players. The news pushed the Euro further up, meaning the ECB could take an even more aggressive stance.
From a technical perspective, the four-hour RSI indicator rallied dramatically to 60 figures as of writing, suggesting that the pair was surrounded by strong bullish momentum. As for the Bollinger Bands, the pair was pricing around the upper band and the size between the upper and lower bands get larger, showing the pair was amid strong positive traction and more favored to the upside path.
Resistance: 1.0788, 1.0929
Support: 1.0508, 1.0400
XAUUSD (4-Hour Chart)
The XAUUSD extended its rally on Wednesday and tried to challenge the $1840 mark in the American trading session despite tepid US macroeconomic figures helping the greenback. Market participants have been moving away from the US Dollar these days amid positive news affecting its major rivals as well as some tepid data. Earlier, the US released the February ISM Manufacturing PMI, which resulted at 47.7, barely improving from the previous 47.4 and missing the expected 48. The survey further showed that “new order rates remain sluggish due to buyer and supplier disagreements regarding price levels and delivery lead times,” indicating persistent price pressures. The report triggered a run to safety, which benefited the safe-haven greenback, however, not for long. Apart from this, the 10-year Treasury note is currently at around 4.0%, and the 2-year note yield hovering near a 16-year high of 4.904%.
From the technical perspective, the four-hour scale RSI indicator edged higher further, showing the upside traction surrounding gold is still strong. As for the Bollinger Bands, the pair was continuing trading along with the upper band and the gap between the upper and lower bands get larger, indicating that the pair’s upside momentum would persist in the near term.
The Dow fell Tuesday, wrapping up February with a monthly loss as surging rates battered stocks after a string of data pointing to underlying strength in the economy forced investors to price in higher for longer Federal Reserve interest rates.
The Dow Jones Industrial Average fell 0.65%, or 214 points, taking losses for February to about 4%. The S&P 500 fell 0.29%, and the Nasdaq Composite was down 0.10%.
Tech, which is down about 5% from its peak earlier this month, pared earlier gains despite a jump in Meta. On the economic front, meanwhile, consumer confidence in February fell to its lowest reading since November, pointing to signs strong consumer spending, which has underpinned strong growth so far this year, may be starting to slow.
The yield on the benchmark 10-year Treasury note was last lower by 1 basis point at 3.912%. Earlier, it touched a high of 3.983%, its highest level since Nov. 10. Meanwhile, the yield on the 30-year Treasury bond rose less than 1 basis point to 3.922%. Tuesday marks the final day of trading in February. The 10-year Treasury yield has advanced more than 50 basis points for the month, and the 2-year yield has gained more than 70 basis points. Those gains come as traders increasingly bet on Federal Reserve rates staying higher for longer, as recent data points to persistent inflation. The core personal consumption expenditures price index rose 4.7% in January from the year-earlier period, beating expectations. The overall PCE index advanced 5.4% year over year, also more than expected.
Main Pairs Movement
DXY bulls flirt with the 105.00 hurdles during Wednesday’s sluggish Asian session, following a stellar rebound marked a few hours ago. In doing so, the US Dollar’s gauge versus the six major currencies portrays the market’s cautious mood as traders brace for the key data/events lined up during the all-important March month, comprising Federal Reserve Chairman Jerome Powell’s speech and Fed’s monetary policy meeting. At the time of writing, the price traded at 105.042.
West Texas Intermediate futures on NYMEX, have corrected firmly after facing firmer barricades above $77.50 in the late New York session. The oil price has dropped $76.60 and is expected to remain on the tenterhooks as investors are awaiting the release of the Caixin Manufacturing PMI data for fresh impetus. At the time of writing, the price is trading at 76.65.
The AUD/USD pair has slipped sharply to near 0.6700 as the Australian Bureau of Statistics has reported mixed Gross Domestic Product (GDP) (Q4) data. The GDP data landed at 0.5% in Q4, lower than the consensus of 0.8% and the Q3 figure of 0.6%. At the time of trading, the price traded at 0.6700.
Technical Analysis
EURUSD (4-Hour Chart)
The EURUSD lost bullish momentum and retreated below the 1.0600 level in the US trading session after touching a daily high of around 1.0650 level. The US Consumer Confidence Survey declined to 6.3% in February from 6.7% in January, however, failing to provide a robust boost for the pair. Now, the effects of rate hikes have not yet shown up because of the usual lags in their impact. This will change and price pressures will then ease noticeably as the year progresses. If this does not happen, and the Fed has not cooled demand sufficiently, then we can expect there will be more rate hikes than previously the market anticipated. In Eurozone, Spanish, and French inflation figures came in above market expectations in February, according to preliminary estimates. At the time being, speculative interest pricing in rate hikes will continue until early 2024, while the ECB’s terminal rate is currently seen at 4%.
From a technical perspective, the four-hour scale RSI indicator slid below the midline, suggesting that bearish momentum triggered by US data failed to sustain in the middle of the US trading hour and also showed that the pair currently have no clear moving path. As for the Bollinger Bands, the pair was capped by the upper band around the 1.0640 level and trading in the upper area, indicating the pair was more favored to hover in a range from 1.0580 to 1.0650.
Resistance: 1.0788, 1.0929
Support: 1.0508, 1.0400
XAUUSD (4-Hour Chart)
The XAUUSD recovered further on Tuesday and was trading around the $1830 mark as of writing, as the US Dollar turned south during the American trading hour. The greenback was hit by the Conference Board Consumer Confidence Index as it fell for a second consecutive month in February, printing at 102.9 against the 108.5 anticipated by market players. Moreover, the Expectations Index fell further to 69.7 from a downwardly revised 76.0 in January. A reading below 80 often signals a recession within the next year, according to the official report. Meanwhile, the US equity market was trading with a mixed tone, the Nasdaq held on to modest intraday gains, while the Dow Jones Industrial Average witnessed heavy selling transactions for a second consecutive day. Meanwhile, US government bond yields ticked north. Early news indicating increased inflationary pressures in Spain and France spurred speculation the European Central Bank (ECB) will maintain its monetary tightening policy until early 2024, while the terminal rate is now seen at 4%.
From a technical perspective, the four-hour scale RSI indicator surged to 58 figures, suggesting that the pair were surrounded by strong bearish traction. As for the Bollinger Bands, the pair was capped by the upper band at the moment of writing, if the price could break through the upper band, the bull could target the next resistance of the $1850 mark.
Stocks rose Monday as traders tried to recover some ground following the worst week of the year on Wall Street. Investors also looked ahead to another big week in retail earnings. The Dow closed higher Monday, as dip buying in beaten-down growth stocks helped the broader market recover following its worst week of the year.
The Dow Jones Industrial Average gained 72.17 points, or 0.22%, to close at 32,889.09.
The S&P 500 was up 0.31% at 3,982.24, and the Nasdaq Composite rose 0.63% to 11,466.98.
The moves came as Treasury yields eased, following a jump on Friday after a hotter-than-expected reading from the Federal Reserve’s favorite inflation metric.
Last week, some data frightened investors, and the US bond yield climbed again. People have become a bit numb to rate hikes and understand that the terminal rate may be higher than expected, and the market is not concerned about inflation data for the next month, but for the next 6, 9, or even 12 months.
Main Pairs Movement
USD Index eyes the first monthly gain in five despite week-start retreat from the multi-day top
US Dollar Index holds lower grounds near $104.60 during the mid-Asian session on Tuesday, after posting the biggest daily loss in five. It’s worth noting that the greenback’s previous losses could be linked to mixed US data and a retreat in the US Treasury bond yields. At the time of writing, the price traded at $104.639.
The cable is flat in Asia as markets consolidate the opening range and the US Dollar softness that kicked in at the start of the week. Meanwhile, the Bank of England is seen increasing Bank Rate by a further 25 bps to 4.25% in March. At the time of writing, the price is trading at $1.20666 and has stuck to a $1.2042/67 range so far.
WTI advances towards $76.00 as investors look optimist for Caixin Manufacturing PMI.
WTI futures on NYMEX, have extended their recovery above the immediate resistance of $75.80 in the early Asian session. The oil price is exposed to the critical resistance of $76.00 as investors are optimistic about the release of the Caixin Manufacturing PMI data, which is scheduled for Wednesday.
At the time of writing, the price traded at $75.561.
Technical Analysis
EURUSD (4-Hour Chart)
The EURUSD is having so far the best day since February 1 on Monday, boosted by a weaker US Dollar across the board on the back of an improvement in risk sentiment and a retreat in Treasury yields. The pair was currently trading at the 1.0590 level and facing some headwinds around the psychological resistance at the 1.0600 level. On the data side, US data showed a larger-than-expected decline in Durable Goods Orders. The headline dropped by 4.5%, against expectations of a 4% slide. Most details of the report were positive. A different report showed Pending Home Sales surged 8.1% in January, surprising market participants that expected an increase of 1%. Compared to a year ago, sales were down 24.1%. The US Dollar further weakened after the economic figures, helping EURUSD move further north.
From the technical perspective, the four-hour scale RSI indicator climbed back to the neutral area, showing the heavy selling pressure has weakened. As for the Bollinger Bands, the pair was trading around a 20-period moving average and the gap between upper and lower bands became smaller, suggesting the market is waiting for more clues for the future path. In our view, Investors should be aware of the downside tendency has not vanished, the pair is still more favored to the south path despite a strong corrective rebound on Monday.
Resistance: 1.0788, 1.0929
Support: 1.0508, 1.0401
XAUUSD (4-Hour Chart)
The XAUUSD regain positive strength and rebound to above the $1815 mark at the moment of writing, as the US dollar lost its upside momentum since the European trading session. This week, a bunch of mid-tier US macroeconomic releases could help shape how much more room gold price can have to the downside ahead of the crucial March 22 Federal Reserve (Fed) meeting. The US Durable Goods Orders data released earlier today came out mixed. The headline figure was worse than expected, showing a bigger decline (-4.5%) than what the consensus had forecast (-4.0%). Gold price reacted modest-but-positively to this release as the US Dollar witnessed heavy selling transactions.
From the technical perspective, the four-hour scale RSI indicator returned to the 45 figures, suggesting the pair were still surrounded by slight bearish traction. As for the Bollinger Bands, the pair was supported by the lower band and capped by the 20-period moving average, showing the pair continued to move in the downside pattern.
Resistance: 1850, 1870, 1900
Support: 1820, 1800
Economic Data
Currency
Data
Time (GMT + 8)
Forecast
AUD
Retail Sales (MoM) (Jan)
08:30
1.50%
CAD
GDP (MoM) (Dec)
21:30
0.10%
USD
CB Consumer Confidence (Feb)
23:00
108.5
Written on February 28, 2023 at 6:24 am, by anakin
US stocks suffered from daily losses last Friday, witnessing heavy selling pressure, and extended their weekly rout following data that showed the core PCE rose at the highest rate in six months. The annual Core PCE Price Index, which is also the Federal Reserve’s preferred gauge of inflation, edged higher to 4.7% and came in higher than the market expectation of 4.3%.
Therefore, the hotter-than-estimated inflation data suggested growing bets the Federal Reserve has a long way to go in its aggressive tightening crusade, making the odds of a soft landing look slimmer. Investors dumped US equities after a higher-than-anticipated jump in consumer spending in January fueled the risk of more policy tightening by Fed chair Jerome Powell in March. On top of that, the Federal Reserve (Fed) officials were also hawkish and backed the US Dollar bulls, as well as weighing on the equity markets. As per the latest reading of the FEDWATCH tool, market players price a year-end effective fed funds rate at 5.3%, versus 5.1% signaled by the US central bank in its December meeting.
The benchmarks, S&P 500 and Dow Jones Industrial Average both declined lower last Friday as the S&P 500 experienced the worst slide in 2023 after hot PCE inflation data provided a boost to the US Treasury bond yields. The S&P 500 was down 1.1% daily and the Dow Jones Industrial Average meanwhile dropped lower with a 1.0% loss for the day. Nine out of eleven sectors in the S&P 500 stayed in negative territory as the Real Estate sector and the Information Technology sector are the worst performing among all groups, losing 1.82% and 1.77%, respectively. The Nasdaq 100 meanwhile dropped the most with a 1.7% loss last Friday and the MSCI World index was down 1.2% for the day.
Main Pairs Movement
The US dollar advanced higher last Friday, marking a four-week uptrend by the end of the day, and ground near the highest levels in seven weeks amid strong United States data. The hawkish Federal Reserve concerns have provided strong support to the safe-haven greenback, as hawkish Federal Reserve (Fed) talks underpin markets bets of higher Fed rates. Cleveland Fed President Loretta Mester told CNBC on Friday that his funds’ rate was above the median in December and still thinks they need to be somewhat above 5%.
GBP/USD dropped lower last Friday with a 0.57% loss after the cable extended its intraday slide and touched a daily low near the 1.1930 mark in the late US session amid a stronger US Dollar and higher US yields. On the UK front, bets for additional rate hikes by the BoE might limit the downside for the currency. Meanwhile, EUR/USD also witnessed some selling interest and touched a daily low below the 1.0540 mark. The pair was down almost 0.45% for the day.
Gold suffered from daily losses with a 0.62% loss for the day after dropping to the lowest levels in two months below the $1810 level during the US trading session, as the strong US data underpinned hawkish Federal Reserve concerns and weighed on the yellow metal. Meanwhile, WTI Oil rebounded sharply with a 1.23% gain for the day.
Technical Analysis
EURUSD (4-Hour Chart)
The EURUSD further declined to its lowest level since early January below 1.0550 as of writing following the surprisingly high US core PCE inflation, rising to 4.7% in January, compared to market expectation of 4.3%, which provided a boost to the US Dollar. More detailed data saw Personal Income expand by 0.6% MoM also in January and Personal Spending increased by 1.8% compared to the previous month. However, it’s also worth noting that markets are already fully pricing in two more 25 basis points for Fed rate hikes in March and May. Currently, speculation the Fed will do a 50 basis points rate hike is mounting based on the stronger-than-expected growth in monthly core PCE inflation, and the CME FedWatch Tool showed the probability of a 50 bps rate hike rose to 32.9%.
From the technical perspective, the four-hour scale RSI indicator fell below the critical overselling level, suggesting that the pair were surrounded by strong bearish momentum, but investors should be aware of the corrective pullback. As the Bollinger bands, the pair continued to move along with the lower band, showing the pair was more favored to the downside path.
Resistance: 1.0788, 1.0929
Support: 1.0508, 1.0401
XAUUSD (4-Hour Chart)
Gold price remained under bearish pressure and priced at its lowest level since late December near the $1810 mark. On the back of stronger-than-expected PCE inflation data for January, the benchmark 10-year US Treasury bond yield is up more than 1% on the day near 3.95%, weighing on XAUUSD. The recent series of strong United States economic data and hawkish Federal Reserve (Fed) commentary has heightened expectations for three rate hikes this year – 25 basis points (bps) each in the March, May, and June meetings. Earlier in the US session, the US headline PCE rose 5.4% in the year to January from 5.3% and the core PCE rallied to 4.7% from a year earlier, both prints surpassing initial estimates. Markets now price the Federal Reserve terminal rate at 5.347% in July, remaining above 5% through the year.
From the technical perspective, the four-hour scale RSI indicator dropped below overselling level, suggesting that the pair was under heavy bearish pressure, but market participants should be cautious about a corrective pullback. As for the Bollinger Bands, the gold was priced below the lower band and the size between upper and lower bands gets larger, showing the downside tendency would persist shortly.
Resistance: 1850, 1870, 1900
Support: 1820, 1800
Economic Data
Currency
Data
Time (GMT + 8)
Forecast
USD
Core Durable Goods Orders (MoM) (Jan)
21:30
0.10%
USD
Pending Home Sales (MoM) (Jan)
23:00
1.00%
Written on February 27, 2023 at 2:19 am, by anakin