This week, market participants are closely monitoring the release of key economic indicators in the US, including the Consumer Price Index, Producer Price Index, and Retail Sales. The Rate Statement from the European Central Bank is also expected to draw significant attention. These highly anticipated releases have the potential to cause significant fluctuations in the markets, providing valuable insights for traders to guide their decisions.
Here are key events to watch out for:
Consumer Price Index (CPI) | US (March 14)
In January 2023, the US witnessed a 0.5% month-on-month rise in consumer prices, the most in three months.
Analysts anticipate a 0.4% increase in February.
Producer Price Index (PPI) | US (March 15)
Producer prices for final demand in the US increased 0.7% month-on-month in January 2023, the most in seven months.
Analysts expect a 0.3% increase in February.
Retail Sales | US (March 15)
Retail sales in the US unexpectedly jumped 3% month-on-month in January 2023, the biggest increase since March 2021.
For February, analysts expect a 0.2% increase.
Employment Change | Australia (March 16)
Employment in Australia unexpectedly declined by 11,500 to 13.72 million in January 2023. Meanwhile, unemployment rate unexpectedly increased to 3.7% in January 2023 from December’s near five-decade low of 3.5%.
For February, analysts estimate that 51,000 jobs will be added, while unemployment rate will be at 3.6%
European Central Bank Rate Statement (March 16)
The ECB raised its interest rate by 50bps to 3% in February 2023.
Markets have fully priced in a 50bps increase this month, with a chance of a similar hike to be delivered in May, after several policymakers backed the idea that rates will have to rise higher and stay higher for some time to bring inflation back to target.
Prelim UoM Consumer Sentiment (March 17)
The University of Michigan’s consumer sentiment for the US rose to 67 in February 2023, up from the preliminary reading of 66.4, and marking the highest level since January 2022.
Analysts anticipate that the index for this month will be in the range of 67.5 to 68.
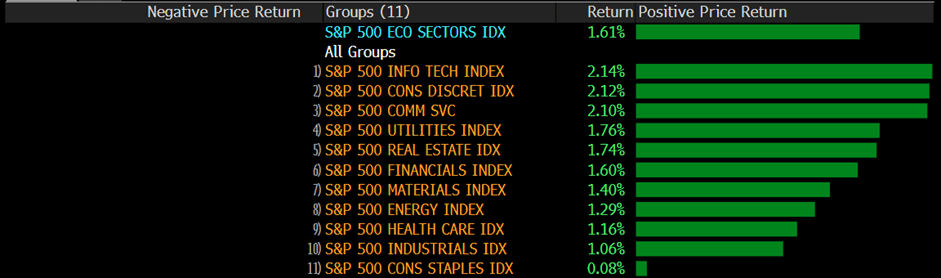
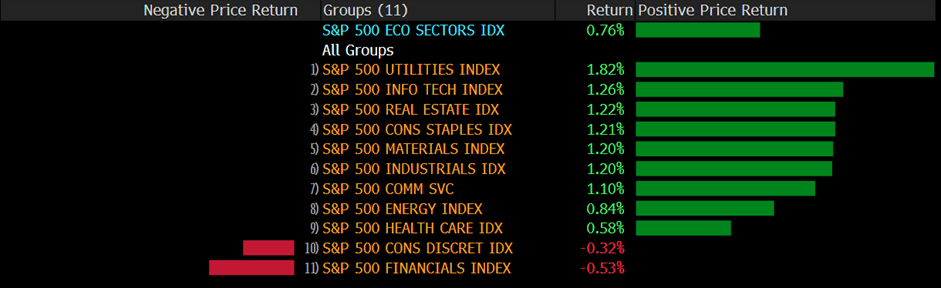
The US stock market experienced its worst week since September. Silicon Valley Bank’s financial troubles sparked concerns about further distress in the banking industry amid the Federal Reserve’s most-aggressive tightening campaign in a generation. Despite reassurances from experts that a systemic financial crisis is unlikely, investors remained anxious, leading to widespread de-risking. The S&P 500 lost 1.45%, erasing most of its 2023 gains, with all eleven sectors falling into negative territory.
The Real Estate and Material sectors were hit hardest, plummeting by 3.25% and 2.15%, respectively. In addition, the Nasdaq 100, Dow Jones Industrial Average, and MSCI world index all suffered losses on Friday. Market anxiety is also high ahead of next week’s consumer price index report.
Main Pairs Movement
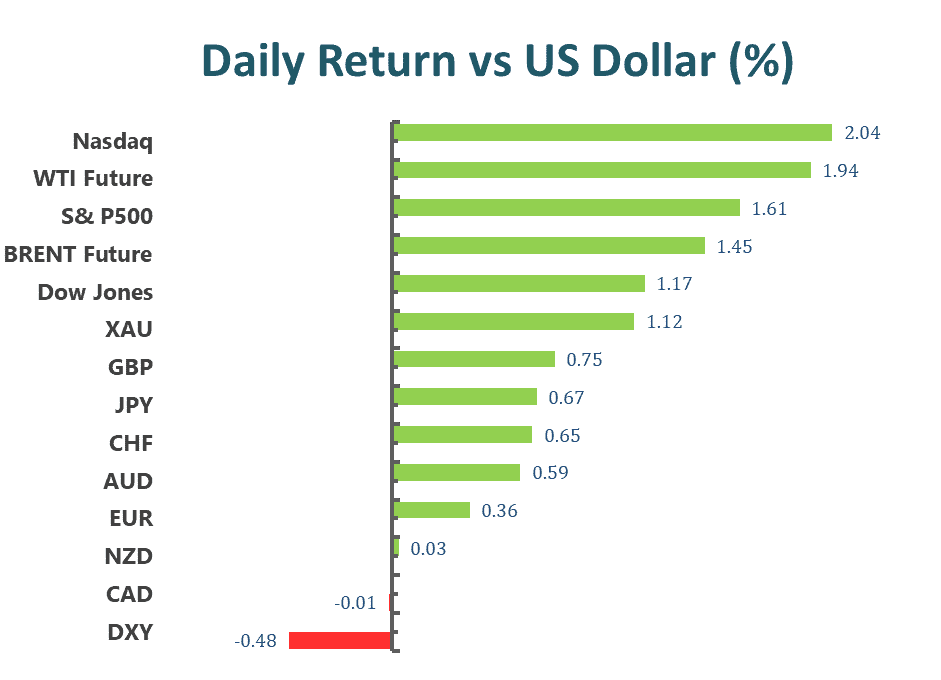
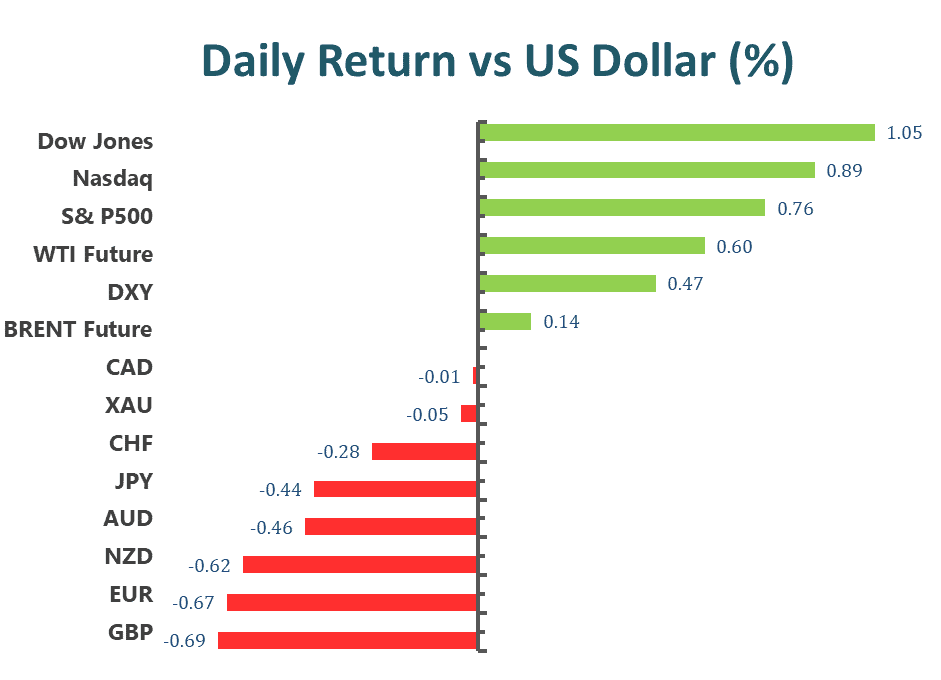
On Friday, the US dollar weakened due to slower wage growth in the US labor data for February. This suggests that inflation pressures may ease, leading to the Federal Reserve’s interest rate hikes being modest, and making the dollar less attractive. The DXY index dropped below the 104.20 level before the US trading hour, but then saw a modest recovery to close around the 104.60 level.
Due to the general weakness of the US dollar, the GBPUSD rallied 0.88% daily. The pair reached the daily high of 1.2112 level during the opening of the American trading hour but lost momentum and closed at the 1.2020 level at the end of the day. Meanwhile, the EURUSD gained 0.59% during the day and closed at 1.064.
Gold prices rose sharply by 2.03% on Friday due to the US dollar selling off after a mixed labor market report and the risk aversion flow triggered by SVB’s turmoil. The XAUUSD continued to move upwards during the late European trading hour to the end of the US trading session, earning around 2% before closing at $1867 on Friday.
Technical Analysis
EURUSD (4-Hour Chart)
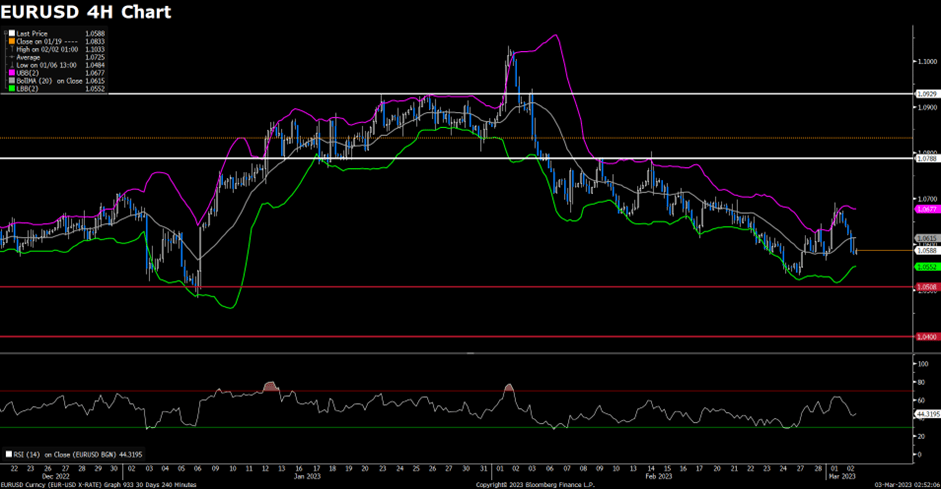
On Friday, the EUR/USD pair experienced a significant increase in buying, climbing to a daily high above the 1.0670 level as market participants continued to analyze the mixed US jobs report for February. The pair is currently trading at 1.0676, with a daily gain of 0.93%. The EUR/USD remains in positive territory due to renewed US Dollar weakness, with US yields decreasing further after the US jobs report, causing the greenback to lose further ground and break below the key 105.00 barrier. The US Nonfarm Payrolls data for February showed an increase of 311,000, surpassing the market expectation of 205,000 and following January’s print of 504,000. However, the Unemployment Rate also increased to 3.6%, removing optimism from the NFP report. The CME Group FedWatch Tool’s probability of a 50 bps hike at the next policy meeting declined to 40%. In the Eurozone, the focus now shifts to the ECB’s next moves after the bank has already anticipated another 50 bps rate raise at the March event.
In terms of technical analysis, the RSI indicator is at 68, suggesting that the bulls are in control as the RSI rises toward the overbought zone. As for the Bollinger Bands, the price has maintained its upside momentum and moved out of the upper band, indicating that a strong continuation of the upside trend can be expected. In conclusion, the market will likely be bullish as the pair heads towards testing the 1.0685 resistance line.
Resistance: 1.0685, 1.0750, 1.0790
Support: 1.0580, 1.0531
XAUUSD (4-Hour Chart)
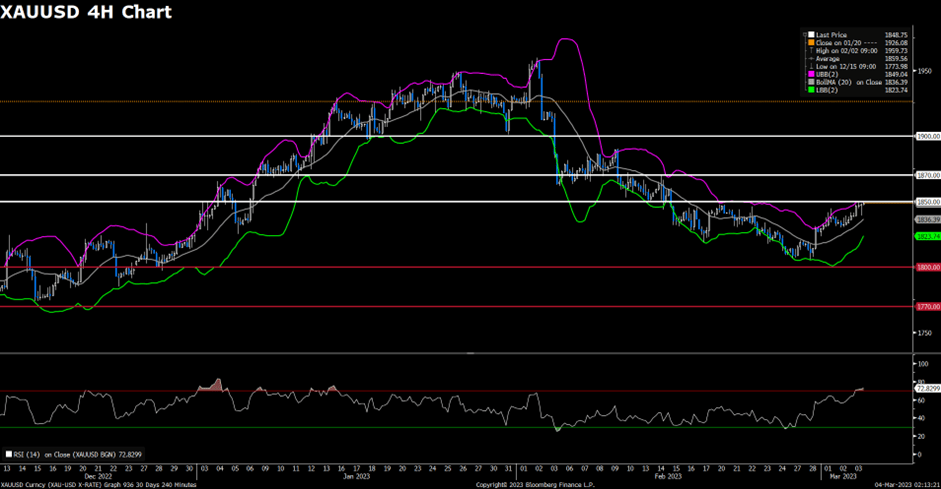
On Friday, the XAU/USD pair climbed above $1,850 as market participants analyzed the mixed US jobs report for February, with gold rising by 1.4% to trade at $1,856. Despite the healthy growth in Nonfarm Payrolls, the increase in the Unemployment Rate led to the 10-year US T-bond yield dropping below 3.8%, contributing to XAU/USD’s gains. Federal Reserve chair Jerome Powell’s hawkish speech warning that a 50 basis point hike was possible had initially increased the likelihood of a 50bp hike by the Fed in March to 75%. However, after investors reevaluated the US jobs report, the probability of a 50bp hike declined to 56%.
In terms of technical analysis, the RSI indicator is at 76, which suggests the possibility of short-term corrections as the RSI remains above 70. The price moved out of the upper Bollinger Band, indicating that the upward trend should continue. We predict that the market will be slightly bearish as long as the resistance level of $1,856 holds. However, if buyers continue to dominate and exceed the $1,856 level, there is a possibility of an upward move toward the $1,924 level.
On Thursday, the US equity market took a turn for the worse as concerns grew over trouble in the banking sector and investors braced for Friday’s payrolls report. Weekly jobless claims, released on Thursday, surpassed expectations and marked the first time claims had risen above 200K since early January. Stronger-than-expected figures in Friday’s monthly jobs report could lead to a bigger hike at the March 21-22 Fed meeting, which may adversely impact the global stock market. Additionally, cryptocurrencies, including Bitcoin, slid significantly as a result of Silvergate’s meltdown.
The S&P 500 benchmark fell to its lowest level since January 19th, with financial companies in the index experiencing a drop of over 4%. The KBW Bank Index, which includes regional lenders, suffered a 7.7% plunge. The banking sector faced increased scrutiny in Washington after Silvergate Capital Corp. collapsed overnight, leading to a record drop in SVB Financial Group’s stock following a sale to mitigate losses. The Nasdaq 100, Dow Jones Industrial Average, and MSCI world index also experienced declines, with drops of 1.8%, 1.7%, and 1.2% respectively for the day.
Main Pairs Movement
The US dollar experienced a decline after suffering its largest daily loss in a week. This can be attributed to a sense of caution ahead of upcoming US data and downbeat early signals for NFP, which weighed on the greenback. Throughout Thursday, the DXY index continued to trend downward, ultimately falling by 0.38% for the day.
In contrast, GBPUSD saw a significant uptick, gaining 0.68% in a single day, marking its biggest daily jump in over a week. This rise was fueled by strong momentum amid a weaker US Dollar across the board, as well as anticipation for key statistics from both the UK and the US. Similarly, EURUSD also saw an upward trend, gaining 0.34% on a daily basis.
Gold prices rebounded on Thursday, registering the biggest daily gains of the week at 0.95%. This can be attributed to softer US treasury bond yields, as well as investor caution ahead of Nonfarm Payrolls. During the Thursday trading session, XAUUSD managed to climb from $1812 to $1830.
Technical Analysis
EURUSD (4-Hour Chart)
On Thursday, the EUR/USD pair continued to gain momentum, maintaining its recovery trend and holding above the 1.0570 level, with a daily gain of 0.33%. The weaker US Dollar across the board, combined with trader cautiousness ahead of the US Non-farm Payrolls release on Friday, led to a moderate pullback in the greenback and supported the EUR/USD pair. However, the US Weekly Initial Jobless Claims, which came in worse than the market expectation, indicating a cooling labor market, could limit the downside for the US Dollar as hawkish Fed expectations remain. In the Eurozone, employment-related figures are relevant before the release of the February Nonfarm Payrolls report on Friday.
From a technical perspective, the RSI indicator suggests that the pair is picking up some upside traction, while the Bollinger Bands show the price maintaining its upside momentum, moving toward the moving average. The market is expected to remain bullish as the pair tests the 1.0580 resistance line, with sustained strength above this level potentially leading to additional gains.
Resistance: 1.0580, 1.0685, 1.0790
Support: 1.0531, 1.0508, 1.0461
XAUUSD (4-Hour Chart)
Despite positive data on job openings and a strong ADP report on Wednesday, the XAU/USD pair continued to rise, reaching a two-day high above the $1834 mark due to a decrease in US Dollar demand. At the time of writing, the Gold price is trading at $1,830, representing a 0.91% increase on a daily basis. However, the higher-than-expected US Jobless Claims for the week ending March 4 may ease the tightness of the labor market and reduce the pressure on the Federal Reserve. The market will now focus on the closely-watched monthly jobs data from the United States, known as NFP, which is set to release on Friday. A weak US Nonfarm Payrolls report, along with high unemployment claims, may decrease the Federal Reserve’s need to tighten conditions at a faster pace.
From a technical perspective, the RSI indicator shows a figure of 53, indicating that the upside is more favored as the RSI has turned slightly north within neutral levels. In addition, the price has maintained its upside traction and crossed above the moving average, which suggests that the uptrend should continue. In conclusion, we believe the market will be slightly bullish as the pair heads towards testing the $1,838 resistance level. On the downside, if sellers take control and the price falls below the $1,808 support level, a downside move toward the $1,792 level cannot be ruled out.
On Wednesday, the US equity market experienced volatility despite the reassurance from Fed chief Jerome Powell that the central bank is not seeking to cause a recession and that no decision has been made on the size of a rate increase in March. Powell’s testimony to American lawmakers increased bets that the Federal Reserve will remain hawkish in the coming months, particularly after the release of another round of hot jobs figures. Powell reiterated that officials are likely to raise rates higher than previously anticipated and could move at a faster pace if necessary. Policymakers will closely scrutinize Friday’s jobs report for three key indicators: payrolls, wage gains, and the unemployment rate.
In terms of performance, the S&P500 and Nasdaq100 edged higher on a daily basis with gains of 0.14% and 0.5%, respectively. Seven out of eleven sectors in the S&P500 stayed positive, with the Real Estate sector performing the best with a daily gain of over 1%. However, the Dow Jones Industrial Average fell 0.2%, and the MSCI world index edged lower by 0.1% for the day.
Main Pairs Movement
On Wednesday, the US dollar remained steady but was down from its three-month highs reached earlier in the day. This followed Federal Reserve Chairman Jerome Powell’s second day of testimony before Congress, which offered no major surprises. Investors are now waiting for Friday’s jobs data. The DXY index traded in a range between 105.4 and 105.8, with a daily low of 105.36 during Powell’s speech.
The GBPUSD edged higher with a 0.13% gain for the day, remaining sideways within a narrow range from 1.8000 to 1.8500. The EURUSD was little changed down as investors also waited for jobs data on Friday.
Gold was little changed up with a 0.02% daily gain, as investors looked for more clues amid concerns about the hawkish Federal Reserve and recession woes. XAUUSD surged above $1820 during the early American trading session but lost bullish momentum and fell back to around the $1814 region.
Technical Analysis
EURUSD (4-Hour Chart)
According to the 4-hour chart analysis, the EUR/USD pair was little changed on Wednesday, recovering slightly from a two-month low and holding onto modest daily gains above the 1.0540 level. The pair is currently trading at 1.0546, posting a 0.02% loss on a daily basis. The market has priced in Powell’s hawkishness from Tuesday, and the pair stayed in positive territory amid renewed US dollar weakness.
The RSI indicator is currently at 35, suggesting that the downside is more favored as it is stable near the oversold territory. However, the price rebounded from the lower Bollinger Band, indicating some upside movements can be expected. If the 1.0531 support line holds, the market is expected to be slightly bullish. However, a steeper decline could be expected on a break below the 1.0531 level.
The resistance levels for the EUR/USD pair are at 1.0631, 1.0685, and 1.0790, while the support levels are at 1.0531 and 1.0467. The European Central Bank is ready for its monetary policy announcement next week, which could also impact the pair’s movements.
Resistance: 1.0631, 1.0685, 1.0790
Support: 1.0531, 1.0467
XAUUSD (4-Hour Chart)
The XAU/USD pair extended its downtrend during Wednesday’s trading session, reaching the lowest since February. The bearish move was not sustained, and the price bounced back slightly to trade around $1814.26 at the time of writing. The daily chart shows a bearish outlook for gold, and the risk remains skewed to the downside.
Looking at the 4-hour chart, the bears remain in control as gold trades below all its moving averages, with the 20 SMA accelerating south between the longer ones. The momentum indicator remains directionless within negative levels, while the RSI indicator resumed its decline after correcting oversold conditions, currently at around 36.
If the bearish pressure continues, the immediate support levels to watch are $1,804, $1,789, and $1,774. On the other hand, a rebound in gold’s price could face resistance at $1,829, $1,841, and $1,858.
In conclusion, the bearish trend in gold remains intact, and a sustained break below the support levels could lead to further downside momentum. However, any rebound in price would face significant resistance levels, and a reversal in the trend would require a significant shift in market sentiment.
Jerome Powell’s hawkish rhetoric triggered a surge in Federal Reserve rate expectations, sparking concerns of a potential recession and causing a sell-off in the riskier segments of the market, resulting in Wall Street experiencing a reality check. During a Senate hearing, Powell suggested that the Fed may accelerate the pace of tightening and raise interest rates if inflation continues to soar. According to the CME FedWatchTool, the market now predicts a potential half-point hike in March and estimates the peak rate to reach around 5.6%. Additionally, the US 2-year yield surpassed the 10-year yield by one percentage point, indicating a curve inversion, which can be a sign of a looming recession.
As a result, the S&P 500 tumbled below 4,000, and all eleven sectors of the S&P500 remained bearish. The Financial and Real Estate sectors were hit the hardest, declining by more than 2% each, while the Nasdaq 100, Dow Jones Industrial Average, and MSCI world index fell by 1.2%, 1.7%, and 1.5%, respectively. The sudden sell-off showed that the stock market was surrounded by bearish traction across the board, with no sector showing positive performance. The current situation in the market has raised concerns among investors, who fear that the economy may be heading toward a recession, especially since curve inversions are often seen as a potential harbinger of a recession.
Main Pairs Movement
The US dollar surged to a three-month high, marking its most significant gains since early October 2022. This unexpected rise was due to Fed Chair Powell’s surprising readiness for more rate hikes and bolstered bets of a 50 bps Fed rate hike in March. These remarks propelled “higher for longer” Fed rate expectations, bolstered US Treasury bond yields, and negatively impacted equities.
In particular, GBPUSD experienced a 1.62% drop as Powell’s hawkish testimony, Brexit concerns, and BoE rate hike worries weighed on Cable bears, causing the pair to fall sharply by almost 0.9% following Powell’s speech. Meanwhile, EURUSD also tumbled by 1.22% on Tuesday.
Additionally, XAUUSD witnessed a 1.82% drop on a daily basis, with gold prices being highly susceptible to the possibility of a firmer 50 bps rate hike from the Federal Reserve. As a result, the price of gold continued to decline throughout the trading session, experiencing almost 1% in losses within an hour.
Technical Analysis
EURUSD (4-Hour Chart)
On Tuesday, the EUR/USD pair plummeted below the 1.0580 level, recording a 0.92% loss for the day. The renewed strength of the US dollar, supported by the recovery of the US 10-year Treasury bond yield, pushed the pair into negative territory after Fed Chair Powell’s hawkish speech. Powell’s remarks about increasing the pace of rate hikes and a higher terminal rate than previously anticipated prompted the market to raise the odds of a 50 basis points rate hike at the March FOMC meeting to 50%. Meanwhile, investors in the Eurozone are anticipating more rate hikes from the ECB amid fears of higher inflation.
From a technical perspective, the RSI indicator and Bollinger Bands suggest a downside trend, with the pair testing the 1.0576 support line and the risk skewing to the downside if it falls below that level.
Resistance: 1.0686, 1.0790
Support: 1.0576, 1.0540, 1.0508
XAUUSD (4-Hour Chart)
Powell’s hawkish remarks have caused the gold price to drop below $1,820, reaching $1,815 at the moment. Market participants viewed Powell’s speech as hawkish, causing the chance of a 50 basis points rate hike to jump to nearly 50%. Gold prices continued to decline despite US yields moving off lows, as a stronger greenback and risk aversion influenced the market.
From a technical perspective, the gold price dropped by about 1.69% on the daily chart and is approaching the bottom of the range. The price is back below a bearish 20 SMA, which is currently converging with the 23.6% retracement of the latest decline at $1,841.05. On the four-hour chart, the gold price is developing below all its moving averages, with the 20 SMA gaining downtrend traction between the longer ones. Additionally, technical indicators are well below their midlines, indicating sustained selling interest.
The US stock market struggled to make gains due to concerns that a recent surge in prices may be overblown, given ongoing economic risks. The fate of the 2023 stock market recovery hinges on four major events before the Federal Reserve’s March 22 meeting, which will determine if the market will rebound after its February slump or experience a setback. Prior to the influential jobs report on Friday, Fed Chair Powell’s two-day appearance before Congress will set expectations for the next policy meeting. While Powell may highlight the economy’s resilience and the challenges of reaching inflation targets, experts predict he will not be overly hawkish or suggest a 50 basis-point hike.
On Monday, the S&P 500 briefly rose almost 1% before losing momentum. Most sectors remained relatively unchanged, with four staying in positive territory by the end of the day. Information technology performed best with a daily gain of 0.53%, while the materials sector suffered the most, falling 1.65%. Additionally, the Nasdaq 100 remained relatively stable, the Dow Jones Industrial Average rose 0.1%, and the MSCI world index gained 0.3% for the day.
Main Pairs Movement
On Monday, the US dollar experienced a 0.23% decrease in value. The Euro and CHF saw gains as Eurozone bond yields rose following hawkish comments from ECB officials. Investors are anxiously waiting for the key testimony from Federal Reserve Chairman Jerome Powell, especially given the challenges for the Fed’s hawkish monetary policy in light of recently mixed US data and Fed talks.
The EUR/USD pair reached weekly highs near 1.0700 but trimmed its gains, as it struggled to reclaim the round-level resistance of 1.0700 at the end of Monday. Eurozone Retail Sales data showed an annual contraction of -2.3%, which underscores the European Central Bank’s need for increased retail demand to achieve price stability.
Gold experienced a 0.52% decrease in value and remains under pressure after reversing from a three-week high. The upcoming speech from Federal Reserve Chairman Jerome Powell this week may have a negative impact on the price of gold, and the rebound of US Treasury bond yields has extended the downward pressure on the metal. Gold’s first support level is at the confluence of $1846.00, and if it breaks through, the price is expected to fall toward the March 3 daily low of $1835.51.
Technical Analysis
EUR/USD (4-Hour Chart)
On Monday, the EUR/USD pair gained bullish momentum, climbing to a daily high around the 1.0690 mark due to a positive shift in risk sentiment. Currently, the pair is trading at 1.0672, with a daily gain of 0.36%. The EUR/USD is staying in positive territory, mainly due to the weaker US Dollar against its major rivals and the risk-on impulse in the financial markets as reflected by US equities. Investors are also preparing for the US Federal Reserve (Fed) Chairman Jerome Powell’s speech at the US Congress on March 7 and 8, where he is expected to reiterate the Fed’s commitment to curb inflation and emphasize the need to maintain higher rates for longer periods.
Despite lower-than-expected economic data in the Eurozone, the Euro is outperforming on Monday. The Sentiment Investor Confidence index dropped in March to -11.1, and Retail Sales rose only 0.3% in February, below the 1% increase expected by the market consensus.
Regarding technical analysis, the RSI indicator is at 60, suggesting that the pair may witness some short-term corrections as the RSI is falling toward 60. The Bollinger Bands indicate that the price failed to maintain its upside traction and retreated from the upper band, indicating some downside movements. In conclusion, we believe that the market will be bearish as long as the 1.0710 resistance line holds. On the upside, bulls could have better chances if the EUR/USD regains the aforementioned 1.0710 level.
Resistance: 1.0710, 1.0790
Support: 1.0624, 1.0580, 1.0540
XAUUSD (4-Hour Chart)
The price of gold has fallen below $1,850 due to elevated US bond yields. At the time of writing, XAUUSD is trading at a daily low of $1,846.195, which represents a 0.5% or $13.085 drop from Monday’s trading session close. The US stock market is reflecting a risk-on impulse in the financial markets.
XAUUSD is likely to remain volatile as market participants prepare for US Federal Reserve Chairman Jerome Powell’s speech at the US Congress on March 7 and 8. Additionally, the market is focused on US employment data. In the prior month’s US Nonfarm Payrolls report, which crushed estimates of 200K, over 500K jobs were created in the economy. Positive data would send the price of gold further down, as further tightening in the labor market would warrant higher rates in the US economy to curb inflation.
On the technical side, from a daily chart perspective, the price is neutral to upward-biased once it conquers the 20 and 50-day EMAs. However, as US treasury bond yields trend upwards, gold is feeling the pressure, falling back to the $1,850 area. Moreover, the RSI exceeded 50 before turning bearish. Therefore, in the short term, the path of least resistance is downwards. The first support would be the 20 and 50-day EMAs at $1,846, followed by the previous low of $1835.51, the 100-day EMAs at $1,822.15, and the 200-day EMAs at $1805.16.
Major central banks are setting the stage for global markets this week, as key economies such as Japan and Australia will announce changes to their benchmark interest rates. The markets will also closely observe the US and Canada Employment Change. Monitoring these key metrics worldwide can help traders make better trading decisions.
Here are key events to watch out for:
Consumer Price Index (CPI) | Switzerland (March 6)
In January 2023, the CPI in Switzerland rose by 0.6% from the previous month. The figure for February is projected to be 0.4%.
Reserve Bank of Australia (RBA) Rate Statement | Australia (March 7)
The RBA increased the cash rate by 25bps to 3.35% in February, the ninth increase since May 2022.
Analysts expect the RBA to raise interest rates by another 25bps to 3.6%.
ADP Non-Farm Employment Change | US (March 8)
US private businesses generated 106,000 jobs in January 2023, substantially lower than the 253,000 jobs created in December 2022.
Analysts anticipate the US to add 168,000 jobs for February.
Bank of Canada (BOC) Rate Statement | Canada (March 8)
In its first meeting of 2023, the BOC increased its overnight rate by 25bps to 4.5% and suggested that it would conclude its aggressive tightening cycle if economic developments conformed to the central bank’s outlook.
For this month, analysts project that the BOC will keep the rates unchanged.
Bank of Japan (BOJ) Rate Statement | Japan (March 10)
During its January meeting, the BOJ unanimously decided to retain its key short-term interest rate at -0.1%, and maintain the 10-year bond yields at approximately 0%.
For this month, analysts predict that the BOJ will keep the rates unchanged.
Gross Domestic Product (MoM) | UK (March 10)
For the first time in three months, the British economy shrank 0.5% month-on-month in December 2022.
Analysts predict the UK GDP to be 0.0% in January 2023.
Employment Change | US and Canada (March 10)
In January 2023, the US economy added an unexpected 517,000 jobs, marking the most jobs created since July 2022, while the unemployment rate fell to 3.4%, the lowest since May 1969. During the same period, Canada added 150,000 jobs, the highest since February last year, and maintained an unemployment rate of 5%.
For February 2023, analysts anticipate the US to add 200,000 jobs, resulting in an unemployment rate of 3.6%. In Canada, employment is expected to increase by 20,000, with an unemployment rate of 5.2%.