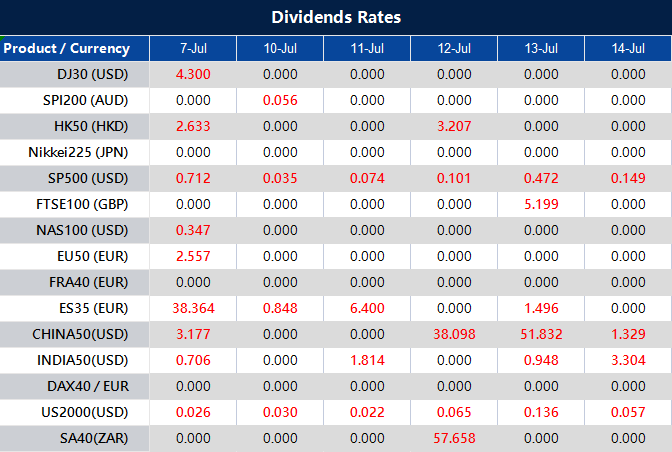
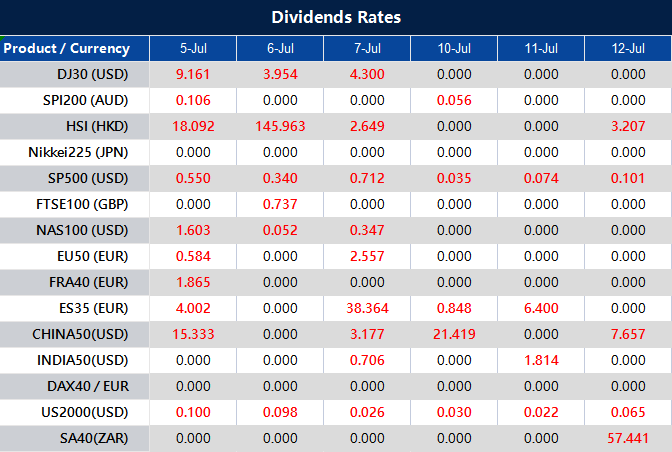
Please note that the dividends of the following products will be adjusted accordingly. Index dividends will be executed separately through a balance statement directly to your trading account, and the comment will be in the following format “Div & Product Name & Net Volume ”.
Please refer to the table below for more details:
The above data is for reference only, please refer to the MT4/MT5 software for specific data.
If you’d like more information, please don’t hesitate to contact [email protected].
Stocks experienced a significant decline on Thursday as the release of stronger-than-anticipated jobs data heightened investors’ apprehension about the state of the economy and the trajectory of interest rates.
The Dow Jones Industrial Average dropped 1.07%, or 366.38 points, closing at 33,922.26, while the S&P 500 and Nasdaq Composite fell by 0.79% and 0.82% respectively. This marked the worst daily performance for both the Dow and S&P 500 since May.
With just Friday’s session remaining in the holiday-shortened trading week, all three major indexes are on track to end the week in negative territory, with the Dow poised for a 1.4% decline, and the S&P 500 and Nasdaq facing losses of 0.9% and 0.8% respectively.
In June, the private sector witnessed a substantial increase of 497,000 jobs, according to data from payroll processing firm ADP, surpassing the Dow Jones consensus estimate of 220,000. This robust gain, the largest since July 2022, exceeded expectations by a wide margin, especially when compared to the downwardly revised 267,000-job addition in May.
The market’s reaction to this positive news indicates that investors may now anticipate a stronger employment report, potentially prompting the Federal Reserve to resume its interest rate hikes after a pause in June.
Traders are pricing in a 92% chance of a rate hike at the central bank’s upcoming meeting, as suggested by CME Group’s FedWatch tool. Amidst these concerns, the Labor Department’s report showing a larger-than-expected decline in job openings in May provides a glimmer of hope that the tight job market could be showing signs of loosening.
On Thursday, the stock market experienced a broad decline across all sectors, with the S&P 500 index falling by 0.79%. The Information Technology sector showed the smallest decline at 0.16%, followed by Consumer Staples (-0.34%), Real Estate (-0.60%), and Materials (-0.71%).
Industrials and Health Care both dropped by 0.74% and 0.87% respectively. Financials and Communication Services had larger declines at 0.91% and 1.06% respectively, while Utilities experienced a more significant drop of 1.21%.
The Consumer Discretionary sector saw the largest decline of 1.65%. The Energy sector had the most substantial decrease, falling by 2.45% on Thursday. This widespread decline across sectors reflects the overall negative sentiment in the market on that day.
Major Pair Movement
USD/JPY experienced a 0.3% decline following a brief rally, as a combination of risk-off flows and caution ahead of the Non-Farm Payrolls (NFP) report limited gains. The pair struggled to reach the previous day’s high despite a temporary surge in 2-year Treasury yields, which retreated from the 16-year highs seen on Thursday.
The inability to sustain momentum, coupled with speculation surrounding potential Yield Curve Control (YCC) adjustments by the Bank of Japan’s Deputy Governor Uchida, weighed on USD/JPY. Market participants are now eagerly awaiting the NFP report, given the historically weak correlation between the ADP jobs data and the official payroll figures.
Positive outcomes on Friday could reinforce dip-buying strategies, while disappointing data may shift sentiment.
EUR/USD initially pierced the 10-day moving average and reached 1.0901 on EBS during early New York trading. However, the pair reversed course and turned negative as US yields and the US dollar rallied.
The market received a series of indicators pointing to a robust jobs market and a strong economy, subsequently increasing expectations for future Federal Reserve rate hikes, as implied by rates futures. The risk-off sentiment led to a decline in equities and gold prices, while USD/CNH saw gains.
Nevertheless, USD sellers emerged later, pushing EUR/USD into positive territory, hovering near 1.0880 by the end of the session. The formation of a daily doji candle reflects market indecision, with upcoming key data, particularly the US June jobs report and Average Hourly Earnings (AHE), poised to influence further direction. Should the data provide an optimistic outlook, EUR/USD bears may take control.
Picks of the Day Analysis
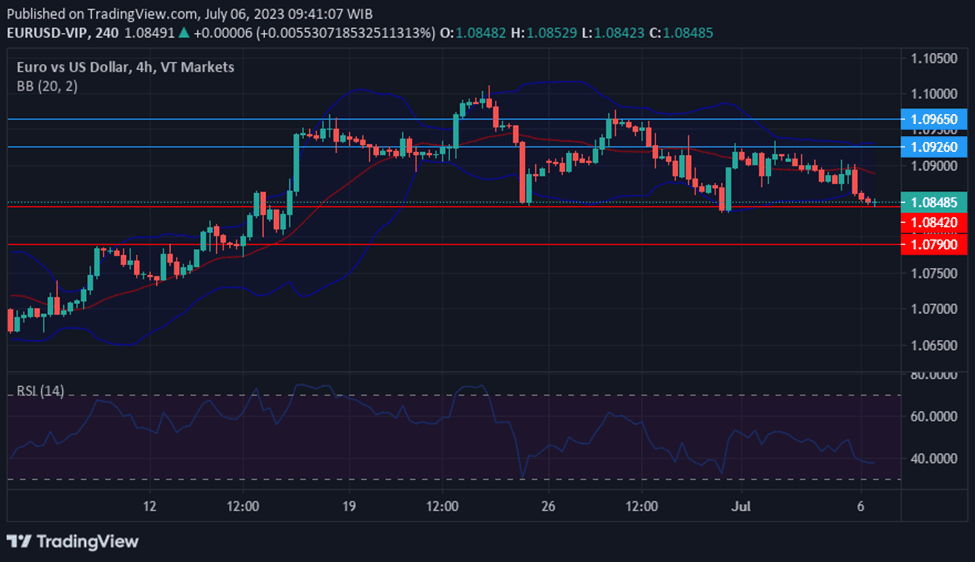
EUR/USD (4 Hours)
EUR/USD Rebounds from Three-Week Lows Amid Positive US Data, Lingering Downside Risks
The EUR/USD currency pair experienced a rebound from three-week lows near 1.0830, surging towards 1.0900 on Thursday. The recovery occurred twice during the European session and following the release of favourable US economic data.
However, despite the notable bounce, various factors such as risk aversion, positive US data, and technical indicators suggest that the downside risks persist for the EUR/USD. Key events in the Eurozone, including flat retail sales and a significant increase in German factory orders, alongside upcoming reports on industrial production and a speech by European Central Bank (ECB) representative De Guindos, could impact the currency pair’s trajectory.
Additionally, the positive surprises in US data, including a robust rise in ADP Private Employment and an increase in the ISM Service PMI, have further strengthened the US Dollar and contributed to the decline in Treasury bonds. The bond market is undergoing a repricing of central bank policies, with both US and European bond yields surging as a result.
According to technical analysis, the EUR/USD pair moved higher on Thursday and reached the middle band of the Bollinger Bands. Currently, the price is moving just above the middle band, indicating a potential for further upside towards the upper band of the Bollinger Bands. The Relative Strength Index (RSI) is currently at 51, suggesting a shift from bearish sentiment to a more neutral stance for the EUR/USD.
Resistance: 1.0926, 1.0965
Support: 1.0842, 1.0790
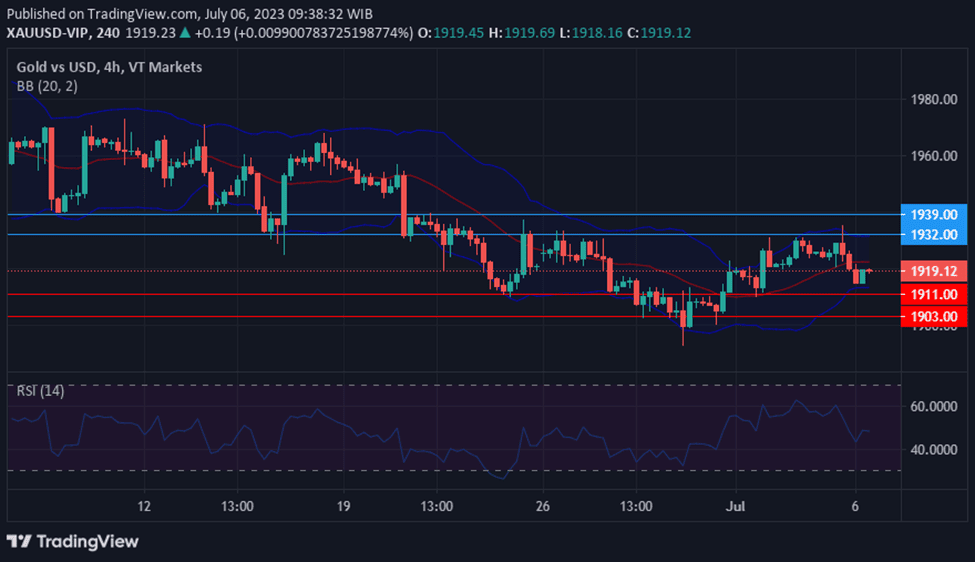
XAU/USD (4 Hours)
Spot Gold (XAU/USD) Prices Plunge as US Dollar Surges on Strong Employment Data and Risk Aversion
Gold prices experienced a significant drop on Thursday, as the XAU/USD pair traded as low as $1,902.62 per troy ounce. The decline was fueled by the US Dollar’s surge, driven by robust American employment-related data that sparked risk aversion and triggered a sell-off in stocks.
The Greenback also benefited from a resurgence in government bond yields, with the 2-year Treasury note reaching 5.12% before settling at 5.04%. The impressive employment figures in the US, including the ADP private jobs creation report surpassing expectations at 497K in June, along with a slight increase in Initial Jobless Claims and a decrease in job openings, indicate a tight labour market that supports the likelihood of further monetary tightening.
Additional positive data, such as an improved ISM Services PMI and upward revisions in S&P Global’s Services and Composite PMIs, underscore the resilience of the US economy and reinforce expectations of continued rate hikes by the Federal Reserve.
According to technical analysis, the XAU/USD pair is undergoing a downward movement on Thursday, approaching the lower band of the Bollinger Bands. Presently, the price is gradually rising from the lower band, suggesting a potential upward movement towards the middle band of the Bollinger Bands. The Relative Strength Index (RSI) is currently at 41, having declined from a higher level, indicating a neutral stance for XAU/USD with a slight bearish inclination.
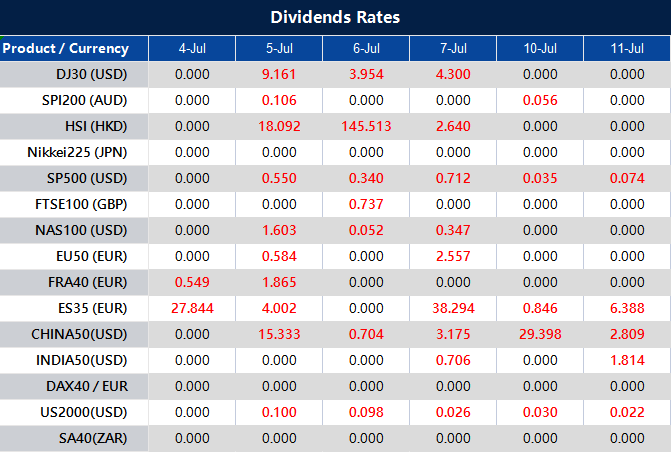
Please note that the dividends of the following products will be adjusted accordingly. Index dividends will be executed separately through a balance statement directly to your trading account, and the comment will be in the following format “Div & Product Name & Net Volume ”.
Please refer to the table below for more details:
The above data is for reference only, please refer to the MT4/MT5 software for specific data.
If you’d like more information, please don’t hesitate to contact [email protected].
On Wednesday, the Dow Jones Industrial Average experienced a decline as Wall Street returned from the Fourth of July holiday break. Investors analyzed the recently released minutes from the Federal Reserve meeting, seeking insights into the current state of monetary policy.
The Dow dropped by 129.83 points or 0.38%, closing at 34,288.64, while the S&P 500 fell 0.2% to 4,446.82, and the Nasdaq Composite slipped 0.18% to end at 13,791.65. This marked the end of three-day winning streaks for both the Dow and S&P 500.
The minutes revealed that most officials indicated the possibility of future interest rate hikes, which made investors more cautious due to concerns about the market and economic trajectory for the second half of the year.
The released data on Wednesday morning showed weaker-than-expected factory orders in May, further contributing to market uncertainties. Investors will be closely monitoring employment and wage data later in the week to gauge the strength of the labour market.
The previous week had been positive for the Nasdaq, which had its best first half of the year since 1983, and the S&P 500, which saw its best first-half advance since 2019. However, the Dow had a more modest gain of only 3.8% during the same period. The holiday-shortened week brought attention to the impact of the Federal Reserve’s rate hike policies on market sentiment and expectations for the rest of the year.
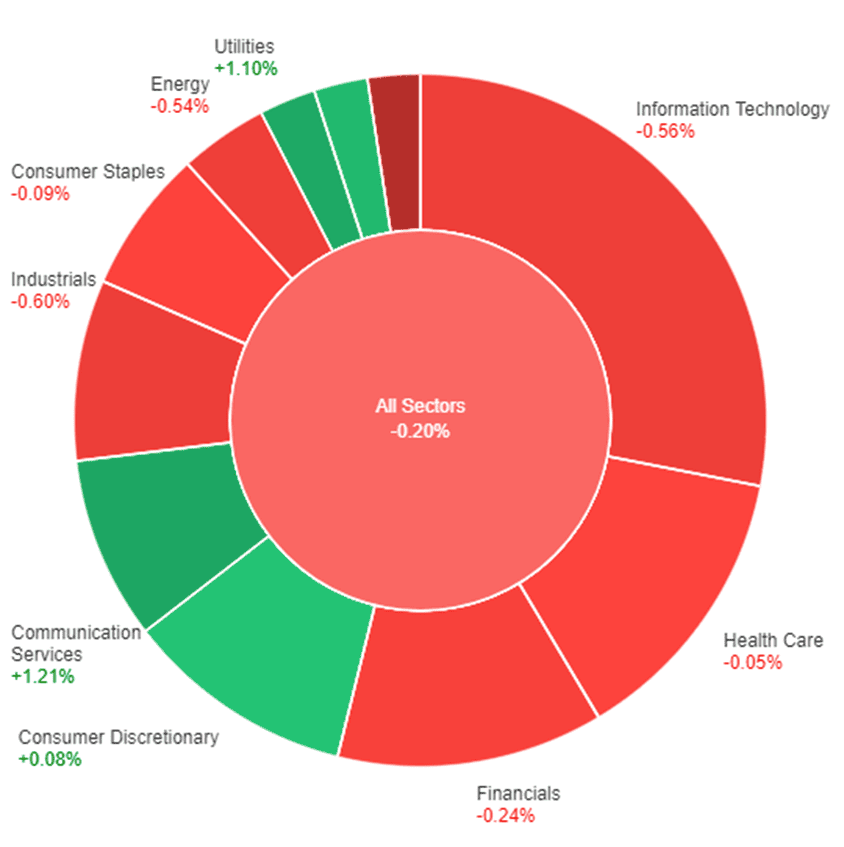
On Wednesday, the overall performance of the stock market saw a slight decline of 0.20%. However, some sectors managed to buck the trend and achieve positive gains. Communication Services experienced the highest increase of 1.21%, followed closely by Utilities with a rise of 1.10%.
Real Estate also showed a modest growth of 0.47%. On the other hand, certain sectors faced losses, with Materials taking the biggest hit at -2.47%. Energy and Information Technology also saw declines of -0.54% and -0.56% respectively.
The remaining sectors, including Consumer Discretionary, Health Care, Consumer Staples, Financials, Industrials, and Materials, all experienced smaller drops ranging from -0.05% to -0.60%.
Major Pair Movement
In Wednesday’s trading, the dollar index experienced a 0.3% gain, seen as a precursor to important upcoming data releases in the United States on Thursday and Friday. The dollar’s performance was supported by weaker-than-expected data and risk-off sentiment due to concerns in the market.
The Federal Reserve’s minutes from their recent meeting confirmed existing expectations of a hawkish stance. The decision by the Reserve Bank of Australia to keep interest rates unchanged on Tuesday also contributed to the dollar’s strength.
Additionally, with major central banks raising rates to combat inflation and uncertainties surrounding China’s economy, investors turned to the dollar as a safe haven. As a result, the AUD/USD pair fell by 0.54%, while the USD/CNH pair surged by 0.42%.
The focus in the coming days will be on the release of key US reports on Thursday, including data on layoffs, jobless claims, ISM services, and JOLTS. This will be followed by Friday’s highly anticipated payroll report.
These upcoming reports overshadowed the impact of the Federal Reserve’s minutes, particularly after a series of comments made by policymakers indicating the possibility of two more interest rate hikes this year.
While forecasts suggest a slightly less hawkish stance from the Fed compared to previous periods, it is worth noting that non-farm payrolls have consistently exceeded expectations this year. Investors will be closely watching the expected figure of 225,000 jobs added in June, following the substantial increase of 339,000 in May.
If this week’s data continues to present conflicting signals, as some recent releases have, then the significance of Wednesday’s consumer price index (CPI) will grow. Expectations for Fed rate hikes have remained relatively stable, with a skipped hike in June and a projected 25 basis point increase in July or, at the latest, September.
There is only about a 35% probability of a final rate increase beyond that. The euro fell by 0.25%, briefly touching the daily cloud support level that held June’s lows at 1.08355 on EBS. The European Central Bank is expected to raise rates by 25 basis points two more times.
The Japanese yen, on the other hand, rose by 0.14% after a temporary drop towards 144, a level where 2.38 billion of options are set to expire on Thursday. The yen’s upward trend is consolidating within a range of 144-145 as currency traders await key US data releases.
The British pound declined by 0.16% as investors weigh the potential economic consequences against the market’s pricing of 143 basis points of Bank of England rate hikes.
Picks of the Day Analysis
EUR/USD (4 Hours)
EUR/USD Slips as Dollar Strengthens and Economic Concerns Weigh
The EUR/USD pair experienced a second consecutive day of losses, dropping below the 20-day simple moving average. Factors contributing to the decline included a cautious sentiment in equity markets, higher US yields, and a stronger US dollar following the release of the FOMC minutes.
In Eurozone data, while inflation expectations remained steady, the Producer Price Index showed a negative annual rate, and the final June Services and Composite PMI figures were revised lower, sparking recession fears. The US dollar strengthened across the board, supported by the FOMC minutes and rising US yields.
Attention now shifts to US labour market data, including the ADP private employment report, Jobless Claims, and JOLTS, followed by Nonfarm Payrolls later in the week.
According to technical analysis, the EUR/USD pair moved lower on Wednesday and has reached the lower band of the Bollinger Bands. Currently, the price is still hovering around the lower band, indicating a potential for further downward movement. The Relative Strength Index (RSI) is currently at 37, suggesting a bearish sentiment for the EUR/USD.
Resistance: 1.0926, 1.0965
Support: 1.0842, 1.0790
XAU/USD (4 Hours)
Spot Gold (XAU/USD) Prices Decline as Market Sentiment Deteriorates Ahead of FOMC Meeting Minutes
Gold prices faced downward pressure as market sentiment worsened, causing XAU/USD to trade at around $1,924 after reaching a weekly high of $1,934.99. The demand for the US Dollar increased due to a deteriorated market sentiment ahead of the release of the Federal Open Market Committee (FOMC) Meeting Minutes.
Additionally, concerns arose over China’s export restrictions on metals essential for the chip industry and softer-than-expected growth in the services sector. The FOMC’s decision to maintain the Fund Rate at 5.00/25% and the possibility of multiple rate hikes by year-end further influenced market expectations and the potential for US Dollar gains.
According to technical analysis, the XAU/USD pair is experiencing a downward movement on Wednesday, with the potential to reach the lower band of the Bollinger Bands. Currently, the price is slightly below the middle band and may move further down towards the lower band of the Bollinger Bands. The Relative Strength Index (RSI) currently stands at 48, having fallen from a higher level, indicating a neutral stance for XAU/USD with a slight bearish bias.
Please note that the dividends of the following products will be adjusted accordingly. Index dividends will be executed separately through a balance statement directly to your trading account, and the comment will be in the following format “Div & Product Name & Net Volume ”.
Please refer to the table below for more details:
The above data is for reference only, please refer to the MT4/MT5 software for specific data.
If you’d like more information, please don’t hesitate to contact [email protected].
U.S. stock futures showed little change on Tuesday night as Wall Street prepared to resume trading after the Fourth of July holiday. Dow Jones Industrial Average futures declined by 0.1%, while S&P 500 and Nasdaq 100 futures dipped by less than 0.1%.
The market had closed early on Monday, with slight gains in the Dow Jones, S&P 500, and Nasdaq Composite. The positive session followed a strong first half of the year, particularly for the Nasdaq Composite and S&P 500, which experienced their best starts since 1983 and 2019, respectively.
Market participants remain optimistic about a potential rally in the second half of the year, despite the possibility of a pullback later on.
Investors are keeping an eye on upcoming economic indicators, such as May factory orders data, which is expected to show a rise of 0.6% compared to the previous month. Additionally, the release of June’s Federal Reserve meeting minutes at 2 p.m.
ET will provide insight into the future of interest rate hikes. New York Fed President John Williams is scheduled to speak later in the day at the 2023 Annual Meeting of the Central Bank Research Association (CEBRA) in New York City.
Overall, with the holiday period ending, traders are cautiously anticipating the market’s direction, while remaining hopeful for a potential rally in the second half of the year.
The stock market is closed on Tuesday due to Independence Day in the US.
On Monday, the overall market showed a slight increase of 0.12%. Among the different sectors, Consumer Discretionary experienced the highest growth with a positive change of 1.07%, followed by Real Estate at 0.85% and Consumer Staples at 0.69%.
Utilities and Financials also saw positive gains with increases of 0.67% and 0.54% respectively. Energy and Materials both had modest growth of 0.31%. Communication Services had a minimal increase of 0.13%, while Industrials only saw a slight rise of 0.07%. On the other hand, Information Technology suffered a decline of -0.31%, and Health Care experienced the largest decrease with a negative change of -0.82%.
Major Pair Movement
The GBP/USD pair displayed resilience by closing up 0.2% despite the strengthening of the US dollar, while the EUR/GBP pair experienced a decline of 0.5%. This strength in the British pound can be attributed to varying expectations regarding interest rate hikes, which are providing a solid foundation of support.
Despite the challenges posed by the stronger US dollar, the pound managed to hold its ground and maintain a positive trajectory.
The AUD/USD pair commenced trading with a 0.31% increase, following a relatively calm session influenced by holiday factors. The Australian dollar (AUD) managed to gain against all major currencies except for the New Zealand dollar (NZD).
Market participants brushed off the Reserve Bank of Australia’s decision to pause, as an underlying hawkish bias remained intact. The positive sentiment surrounding the AUD/USD pair reflected the market’s indifference towards the central bank’s cautious approach.
The EUR/USD pair began trading with a decline of 0.35% after a quiet session influenced by holiday-related factors. The selling pressure on the euro (EUR) against the Japanese yen (JPY) contributed to this lower opening.
The EUR/USD pair faced challenges due to the light selling of EUR/JPY, which weighed on its performance. The impact of the holiday season was felt in the market, resulting in subdued trading activity and influencing the euro’s initial weakness against the US dollar (USD).
Picks of the Day Analysis
EUR/USD (4 Hours)
EUR/USD Modestly Falls on Quiet Day, Focus Shifts to FOMC Minutes and US Labor Market Data
The EUR/USD experienced a slight decline on a quiet day in the financial markets, with limited price action due to a US holiday. The Euro lagged behind the pound without any significant economic reports. Volatility is expected to increase on Wednesday with the release of Eurozone economic data and the FOMC minutes.
Market participants remained cautious on US Independence Day, but trading activity is expected to return to normal. The focus is now on the FOMC minutes and upcoming US labour market data, which will influence expectations regarding the actions of the Federal Reserve.
In the Eurozone, the May Producer Price Index (PPI) is anticipated to show a decline, providing some positive news for the European Central Bank (ECB).
Additionally, the final reading of the Markit Services PMI is due, with no major revisions expected.
According to technical analysis, the EUR/USD pair remained unchanged on Tuesday and reached the middle band of the Bollinger Bands. Currently, the price is slightly below the middle band, indicating a possible downward movement towards the lower band.
The Relative Strength Index (RSI) is currently at 43, suggesting that the EUR/USD is in a neutral position but slightly bearish.
Spot Gold (XAU/USD) Holds Near Weekly High as Financial Markets Remain Quiet on Independence Day
Spot Gold maintained its position near the weekly high reached on Monday at $1,930.98, extending its gains for the fourth consecutive day. With the United States observing Independence Day and no significant news developments, financial assets remained stagnant, trading within familiar levels.
The Reserve Bank of Australia (RBA) announced no change to the Official Cash Rate (OCR) at 4.1%, noting that inflation in the economy has peaked. Initially, the decline in the Australian dollar provided support to the US Dollar, but the American currency reversed its course and weakened against most major counterparts, buoyed by stable Asian shares.
However, European markets closed in the negative territory. Market participants eagerly awaited upcoming labour market updates from the United States scheduled for the latter half of the week, as the macroeconomic calendar offered little else of significance.
According to technical analysis, the XAU/USD pair is experiencing an upward movement on Tuesday, with the potential to reach the upper band of the Bollinger Bands. Currently, the price is slightly below the upper band and may potentially move downward towards the middle band of the Bollinger Bands. The Relative Strength Index (RSI) currently stands at 55, having fallen from a higher level, indicating a neutral stance for XAU/USD.
Please note that the dividends of the following products will be adjusted accordingly. Index dividends will be executed separately through a balance statement directly to your trading account, and the comment will be in the following format “Div & Product Name & Net Volume ”.
Please refer to the table below for more details:
The above data is for reference only, please refer to the MT4/MT5 software for specific data.
If you’d like more information, please don’t hesitate to contact [email protected].
In a shortened session marking the start of a new trading month, quarter, and half, stock markets experienced slight gains on Monday. The Dow Jones Industrial Average rose by 0.03%, adding 10.87 points to close at 34,418.47.
Similarly, the S&P 500 climbed 0.12% to end at 4,455.59, while the Nasdaq Composite advanced 0.21% to 13,816.77. Tesla shares surged by 6.9% after the company exceeded analysts’ expectations with impressive delivery and production numbers, leading to a boost in other electric vehicles stocks like Rivian, Fisker, and Lucid.
The first half of the year proved to be exceptional for Wall Street, with the Nasdaq Composite registering its highest first-half gain since 1983, surging by 31.7%. The S&P 500 also performed well, jumping 15.9%, marking its best first-half performance since 2019.
Meanwhile, the Dow Jones Industrial Average had a more modest gain of 3.8% during the period. Factors such as increasing enthusiasm around artificial intelligence and resilient U.S. economic data, which defied concerns over rising interest rates, contributed to positive investor sentiment.
Investors are now shifting their mindset from fear of missing out (FOMO) to a more positive outlook for the second half of the year. Sam Stovall, chief investment strategist at CFRA Research, suggests that after a strong first half, investors are considering the potential for continued positive momentum.
While the ISM’s manufacturing purchasing managers’ index for June fell slightly below expectations, signalling a decline in economic activity, investors will be closely watching job market data later in the week for further insights.
On Monday, the overall market showed a slight increase of 0.12%. Among the different sectors, Consumer Discretionary experienced the highest growth with a positive change of 1.07%, followed by Real Estate at 0.85% and Consumer Staples at 0.69%. Utilities and Financials also saw positive gains with increases of 0.67% and 0.54% respectively.
Energy and Materials both had modest growth of 0.31%. Communication Services had a minimal increase of 0.13%, while Industrials only saw a slight rise of 0.07%. On the other hand, Information Technology suffered a decline of -0.31%, and Health Care experienced the largest decrease with a negative change of -0.82%.
Major Pair Movement
The dollar index initially gained in early European trading but later levelled off as Treasury yields decreased and proved to be less inflationary than anticipated. However, with significant data scheduled to be released later in the week and a U.S. holiday on Tuesday, market reactions remained limited.
The EUR/USD currency pair initially rose from 1.0870 to 1.0934 before stabilizing near unchanged levels. The final eurozone PMI manufacturing index, although slightly higher than the flash estimate, indicated caution for investors and suggested waiting for more data, especially the U.S. claims, ISM services, JOLTS, and employment report to be released later in the week.
The minutes from the Federal Reserve meeting are also set to be released on Wednesday.
USD/JPY broke through a support level that had been holding since June 16. However, despite weaker ISM data, buyers emerged around the 144 level, preventing a significant correction.
For a larger correction to occur, there would need to be a retreat in the spread between Treasury and Japanese Government Bond yields. This retreat seems plausible only if U.S. labour data turns out to be weaker than expected, reversing the trend of mostly positive outcomes.
Additionally, the British pound received a boost following the release of the ISM data, after a previous decline. Market expectations for future rate hikes by the Bank of England continue to overshadow those anticipated by the Federal Reserve.
Picks of the Day Analysis
EUR/USD (4 Hours)
EUR/USD Recovers as Weak US Data and Holidays Keep Market Calm
The EUR/USD rebounded above 1.0900 during the American session as the US dollar lost momentum due to disappointing economic data and the US holidays. The upcoming release of employment data and FOMC minutes will play a crucial role.
Despite negative revisions to the Eurozone Manufacturing PMI, the European Central Bank (ECB) plans to raise interest rates in July and the odds of another hike in September are over 50%. The weaker US dollar pushed the EUR/USD higher, while hawkish Federal Reserve comments provided support.
According to technical analysis, theEUR/USD pair remained flat on Monday and reached the middle band of the Bollinger Bands. Currently, the price is slightly above the middle band of the Bollinger Bands, indicating a potential upward movement towards the upper band. The Relative Strength Index (RSI) is currently at 51, suggesting that the EUR/USD is in a neutral position.
Resistance: 1.0926, 1.0965
Support: 1.0883, 1.0842
XAU/USD (4 Hours)
Spot Gold (XAU/USD) Gains as Weak US Data Pushes Dollar Down
Spot Gold (XAU/USD) experienced a recovery on Monday, bouncing back from its lowest level since mid-March at $1,892.95 per troy ounce. The US Dollar initially found some support but eventually turned south against most rivals during the American session.
The advance of XAU/USD intensified following the release of disappointing US data, with the June ISM Manufacturing PMI falling to 46, missing expectations of 47.2. The contraction in manufacturing output for eight consecutive months, along with easing inflation, has kept financial markets positive and diverted attention away from the USD.
Employment-related figures will be closely watched this week, leading up to the release of the June Nonfarm Payrolls report on Friday.
According to technical analysis, the XAU/USD pair is experiencing an upward movement on Monday, with the ability to reach the upper band of the Bollinger Bands. At present, the price is slightly below the upper band and may potentially move downwards towards the middle band of the Bollinger Bands.
The Relative Strength Index (RSI) currently stands at 56, having risen from a lower level, indicating a neutral stance for XAU/USD.
In response to the current market volatility,VT Markets will modify the trading setting of US Shares on July 10, 2023:
The above data is for reference only, please refer to the MT4/MT5 software for specific data.
Friendly reminders:
1. All specifications of forex stay the same except leverage.
2. The margin requirement of the trade may be affected by this adjustment, please make sure the funds in your account are sufficient to hold the position before this adjustment.
If you’d like more information, please don’t hesitate to contact [email protected].
Sydney, Australia, 4 July 2023 – VT Markets, a global multi-asset broker, is proud to announce the expansion of its corporate social responsibility (CSR) with new sponsorship and donation initiatives. In a bid to make a positive impact on the world outside of trading, the brokerage is actively seeking collaborations with individuals and organisations that share its values of servant leadership and sustainable development.
VT Markets recognises that leadership requires more than just being exceptional in the trading industry. It involves actively engaging with communities and contributing in ways that benefit both the economy and the environment. The brokerage firmly believes that businesses have a responsibility to give back and make a meaningful contribution beyond profit margins.
“We challenge the common misconception that businesses lack empathy or concern for society,” affirmed a VT Markets representative. “Corporate social responsibility isn’t an afterthought for us. It represents our ethos as a brokerage firm that prosperity should extend to communities and the environment.”
VT Markets’ sponsorship and donation initiatives aim to empower individuals and organisations striving to improve sectors such as education, healthcare, social welfare, and environmental conservation. The company plans to allocate at least millions over the next few years towards its CSR efforts. By providing this funding, VT Markets hopes these collaborations can impart lasting effects, foster meaningful relationships, and demonstrate that success in business means success for humanity.
VT Markets encourages organisations and charitable causes across the globe to contact the company’s CSR team to discuss partnership opportunities. The team will evaluate each application and determine how VT Markets can best support the most deserving causes.
For more information about VT Markets’ corporate social responsibility initiatives and partnership opportunities, please visit www.vtmarketsmy.com or contact the CSR team at [email protected]
About VT Markets:
VT Markets is a global multi-asset broker, providing access to a wide range of financial markets for traders and investors worldwide. With a strong commitment to innovation, technology, and client satisfaction, VT Markets offers competitive trading conditions, advanced trading platforms, and a comprehensive suite of educational resources. As a responsible corporate citizen, VT Markets is dedicated to making a positive impact on society through its corporate social responsibility initiatives.
For more information, please visit the official VT Markets website. Alternatively, follow VT Markets on Meta, Instagram, or LinkedIn.
For media enquiries and sponsorship opportunities, please email [email protected]