Back

Margin Forex Trading: How to Harness Leverage for Financial Growth

Imagine you have $1,000 and want to invest in the foreign exchange market, commonly known as Forex. Traditionally, your $1,000 would only allow you to control a small trade size. However, with margin trading, you can now control a much larger position, say $100,000, with just a fraction of your own money. This means that even small fluctuations in currency prices can lead to substantial profits or losses. Welcome to the world of Margin Forex Trading! 

The Basics of Margin Forex Trading 

Margin trading in the Forex market refers to the practice of borrowing funds from your broker to trade larger positions than what your account balance would typically allow. It is important to understand that while margin trading offers the potential for higher returns, it also increases the risk of significant losses. 

In cash trading, you only use the money you have in your account to execute trades. In contrast, margin trading allows you to leverage your positions by using borrowed money from your broker. 

One of the key concepts in margin trading is leverage. Leverage is the ratio between the amount of capital you have and the amount you can control. 

For instance, if your broker offers a leverage of 1:100, you can control a position worth $100 for every $1 of your own money. Leverage can amplify both gains and losses, making it a powerful tool that requires careful use. 

Understanding Margin 

Margin, in the context of Forex trading, refers to the collateral you need to provide to open and maintain a leveraged position. It acts as a security deposit to ensure you can cover potential losses. The margin requirement is usually expressed as a percentage and varies depending on the broker and the currency pair you’re trading. 

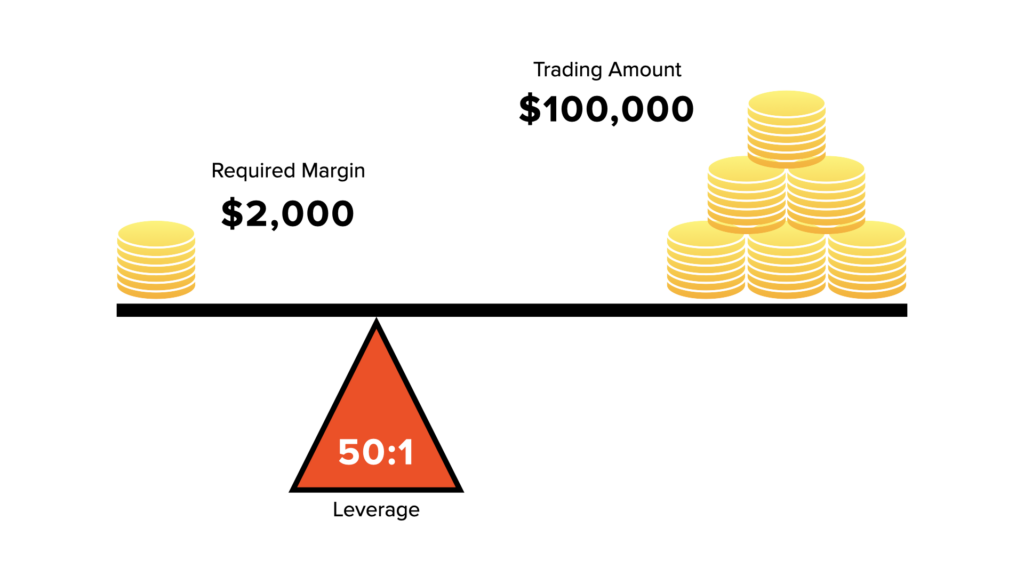
For example, with a 2% margin requirement, to control a $100,000 position, you would need to have $2,000 in your account. This means you are leveraging your account 50 times (100,000 / 2,000) to control that position. 

Leverage and Margin – A Powerful Combination 

Leverage and margin are closely related. As mentioned earlier, leverage determines how much you can control relative to your account balance. The higher the leverage, the smaller the margin required to control larger positions. 

However, traders need to be aware that while leverage can lead to significant profits, it also exposes them to more substantial losses. For instance, a 1% price movement in the opposite direction of your trade can lead to a 100% loss of the margin invested. 

How Does Margin Work? 

Let’s delve into how margin is used in Forex trading. When you open a leveraged position, your broker sets aside the required margin from your account balance as collateral. As long as your trade is active, the margin remains tied up. Once you close the trade, the margin is released back to your account, along with any profits or losses. 

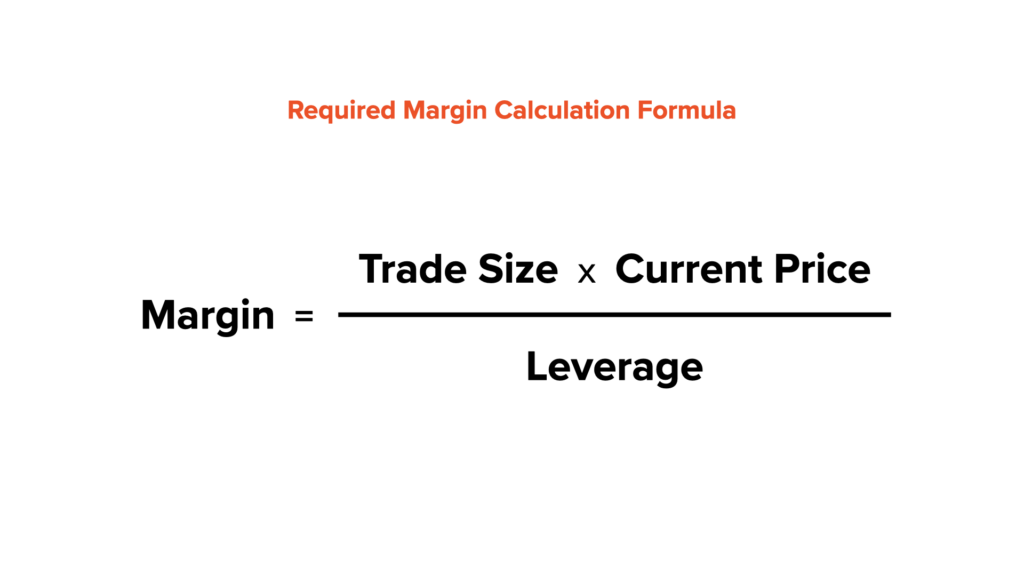
To calculate the required margin for a specific trade size, you can use the following formula: 

Margin = (Trade Size * Current Price) / Leverage 

To ensure you fully understand the margin requirements and leverage, let’s calculate them with a real-world example. Suppose you want to control a position of $50,000 on the EUR/USD currency pair with a leverage of 1:50. 

Margin = ($50,000 * 1) / 50 = $1,000 

Margin Calls and Stop-Outs: Protecting Your Investments 

In the exciting world of margin Forex trading, understanding margin calls and stop-outs is essential to safeguarding your investments and ensuring responsible trading practices. These mechanisms act as safety nets provided by brokers to protect traders from potential devastating losses. 

Margin Calls: Your Financial Alarm Bell 

A margin call is a crucial warning signal that occurs when the equity in your trading account falls below the required margin level. In simpler terms, it means that your account balance is no longer sufficient to support the open leveraged positions you have taken. 

Suppose you have a margin trading account with $5,000 and decide to open a leveraged position on the GBP/USD currency pair. The broker offers a leverage of 1:100, meaning you can control $100 for every $1 of your own money. You use your $5,000 to control a position worth $500,000 ($5,000 * 100), relying on the 1:100 leverage. 

Now, imagine that the market moves against your position, causing a loss of $4,800. As a result, your account equity drops to $200 ($5,000 – $4,800), which is now significantly below the required margin to maintain your open position. 

At this point, the broker will issue a margin call, notifying you that you need to add more funds to your account to meet the required margin level. If you fail to top up your account, the broker may automatically close your positions to prevent further losses. 

Stop-Outs: Last Line of Defence 

A stop-out is the next stage if a margin call goes unheeded. When your account equity falls further and reaches the stop-out level, the broker will automatically liquidate your positions to protect your account from going into negative territory. 

To continue with our previous example, let’s assume that despite the margin call, you didn’t deposit additional funds to meet the required margin level. The market continues to move against your position, and the losses worsen. As your account equity drops below the stop-out level, your broker will intervene and close your position automatically to prevent your account from incurring more losses. 

In our example, let’s say the stop-out level is set at 20% of the required margin, which would be $1,000 (20% of $5,000). When your account equity falls to $150 (3% of $5,000), which is below the stop-out level, the broker will execute the stop-out and close your position. 

Understanding the significance of margin calls and stop-outs is vital in maintaining your financial well-being while engaging in margin Forex trading. It is crucial to be vigilant about monitoring your account’s equity and ensuring that you have sufficient funds to support your open positions, especially during periods of high market volatility. 

Opening a Margin Trading Account 

If you’re interested in margin trading, you’ll need to open an account with a reputable Forex broker that offers leverage. For example, you can open a margin trading account with VT Markets, a trusted broker known for its user-friendly platform and up to 500:1 leverage option. 

When opening a live trading account, you’ll typically need to deposit an initial amount of funds, which will serve as your trading capital. 

Pros and Cons of Margin Trading 

Margin Forex trading offers exciting opportunities and potential rewards, but it also comes with inherent risks that traders should be aware of. Let’s examine the pros and cons of engaging in margin trading: 

Pros: 

  • Increased Profit Potential: Leverage allows controlling larger positions with a smaller investment, leading to higher potential profits. 
  • Diversification Opportunities: Traders can spread capital across multiple currency pairs to explore various market opportunities. 
  • Access to Larger Markets: Even small retail traders can access the vast Forex market due to leverage. 
  • Trading Flexibility: Leverage enables adopting different trading strategies based on risk tolerance and market analysis. 
  • Hedging: Margin trading allows using hedging strategies to protect against losses in volatile markets. 

Cons: 

  • High Risk of Losses: Leverage increases the risk of significant losses with small price movements. 
  • Margin Calls and Stop-Outs: Traders need to monitor and maintain sufficient margin levels to avoid forced position closures. 
  • Emotional Challenges: Margin trading can be emotionally taxing, leading to impulsive decisions. 
  • Increased Market Volatility: Leverage magnifies the impact of market volatility on the account balance. 
  • Overtrading: High leverage may tempt traders to overtrade, resulting in higher transaction costs and potential losses. 

Margin Trading Tips for Beginners: Navigating the Forex Market Safely 

Margin trading can be enticing for beginners, but it’s essential to approach it with caution and a solid understanding of the risks involved. Here are some valuable tips to help newcomers navigate the world of margin Forex trading safely and responsibly: 

  • Educate Yourself: Learn about Forex markets, leverage, margin requirements, and risk management. 
  • Start Small: Begin with a small account and low leverage to gain experience. 
  • Practice with Demo Accounts: Use virtual funds to practice before trading with real money. Try a risk-free Demo account by VT Markets. 
  • Understand Leverage and Margin: Know how leverage works and calculate margin requirements. 
  • Set Realistic Goals: Aim for steady progress and avoid chasing quick gains. 
  • Use Stop-Loss Orders: Implement stop-loss to limit potential losses. 
  • Avoid Emotional Trading: Stick to your plan and don’t let emotions drive decisions. 
  • Manage Risk: Risk only a small percentage of your capital on each trade. 
  • Stay Informed: Keep up with news and events affecting currency prices. 
  • Avoid Overtrading: Trade with discipline and avoid excessive transactions. 
  • Review Your Strategy: Regularly assess and adapt your trading approach. 
  • Be Prepared for Losses: Accept losses as part of trading and learn from them. 
  • Keep a Trading Journal: Record trades and analyse for insights. 

In conclusion, margin Forex trading offers the potential for substantial profits, but it also carries significant risks. Aspiring traders should approach margin trading with caution and always prioritise continuous learning and risk management. By understanding the concepts of margin, leverage, and risk, you can navigate the Forex market with greater confidence and success. 

Summary: 
  • Margin trading in Forex allows controlling larger positions with a small investment, amplifying both profits and losses. 
  • Understanding leverage and margin is essential, as higher leverage requires less margin but increases risk. 
  • Margin calls occur when account equity falls below required levels, while stop-outs liquidate positions if equity drops further. 
  • Pros of margin trading include increased profit potential and market access, while cons involve higher risk and potential for emotional challenges. 

Diversifying Beyond Volatility: How to Trade Bonds? 

Imagine this scenario: The stock market is experiencing wild fluctuations, cryptocurrencies are in a rollercoaster ride of ups and downs, and investors are feeling a sense of unease. 

However, in the midst of this turbulence, bondholders remain unfazed, enjoying the steady and predictable returns from their bond investments. 

Just like a lighthouse guiding ships to safety during a dark and stormy night, bonds can act as a reliable guiding light for investors seeking a secure harbour for their hard-earned money. 

source: BoredPanda

Bonds represent one of the most favoured financial assets, but if you haven’t explored their nature and functionality, you might be deterred by their reputation for complexity and limited returns. 

In reality, bonds are extensively traded assets that can fortify your portfolio’s risk-return profile and provide diversification without subjecting you to excessive volatility. Although they may offer lower returns, they come with reduced risk, making them a secure option for investors. Additionally, their inverse correlation to interest rates presents lucrative opportunities for trading bond CFDs

This article aims to provide a comprehensive breakdown of bonds, their various types available for trading, and how you can effectively integrate them into your investment portfolio to diversify beyond traditional stocks. 

Understanding Bonds 

Bonds can be best described as a type of debt instrument. While individuals typically approach banks or credit unions for loans, companies and governments raise capital by seeking investors, who then become bondholders within the organisation. 

These bondholders receive interest on the asset, known as a coupon rate, until the bond reaches its maturity date, at which point the initial loan amount (referred to as the principal) is repaid. 

Bonds are generally considered less risky than other highly volatile assets, but they still carry certain risks related to interest rates, credit quality, defaults, and prepayments. Various types of bonds exist, issued by different organisations, companies, or institutions, and all are rated based on their investment grade. 

Exploring Bond Types: From Government to Corporate and Beyond 

Bonds come in two categories: secured and unsecured. 

A secured bond provides protection to the bondholder by using assets as collateral, reducing the risk of issuer default. Mortgage-backed securities are an example of secured bonds. 

On the other hand, unsecured bonds, also known as debentures, lack collateral and are considered riskier assets since both the interest payments and principal amount are guaranteed solely by the issuing company or organisation. 

There are four main kinds of bonds

Government bonds 

Some government-issued bonds are unsecured, but they are still considered among the lowest-risk investments, particularly when coming from stable governments with a solid track record of no bond defaults. In the US, they are known as Treasuries, while in the UK, they are called gilts. 

Government bonds can be issued with fixed interest rates or variable coupon payments tied to inflation. In the UK, inflation-linked bonds are referred to as index-linked gilts, while in the US, they are known as Treasury Inflation-Protected Securities or TIPS. 

source: Wikipedia.com

Corporate bonds 

As the name suggests, corporate bonds are issued by corporations to raise funding. The risk level associated with these bonds depends on the size and established nature of the company. 

Corporate bonds are generally riskier than government bonds, but bondholders receive more protection from loss compared to ordinary shareholders. In the event of company bankruptcy, liquidated assets are used to pay bondholders ahead of shareholders, a concept known as a liquidation preference. Corporate bonds may be secured and are rated by agencies such as Standard & Poor’s, Moody’s, and Fitch Ratings, which assess their overall investment grade. 

Municipal bonds 

Similar to government bonds, municipal bonds (munis) are issued by municipalities, councils, cities, and other local governments. They often come with lower interest rates and are considered less risky than some other bond types. 

Municipal bonds may also appeal to investors because they are not subject to taxation in the US. 

Agency bonds 

Agency bonds are securities issued by government-backed enterprises or federal government departments other than the US Treasury. Mainly prevalent in the US, they can be backed by the US government, as is the case with government department-issued bonds, or not, as with those issued by government-sponsored enterprises (GSEs). 

The Fannie Mae National Mortgage Association and the Freddie Mac Federal Home Loan Mortgage bonds are examples of GSE bonds. 

How Do Bonds Work? 

Bonds are straightforward debt instruments that facilitate the process of lending money, known as the principal or face value, from a bondholder to a public or private institution, known as the issuer.  

The issuer then repays this amount on an annual, semi-annual, or monthly basis, as specified in the bond’s terms. Upon reaching maturity, which is the bond’s expiration date, the principal is returned to the bondholder. 

Being negotiable securities, bonds can be bought and sold in a secondary market, much like stocks. However, it’s essential to note that stocks and bonds function differently. While some bonds are listed on the stock exchange, the majority of bond trading occurs through Over-the-Counter (OTC) products like Contracts for Differences (CFDs), traded through brokers. 

Interest rates play a significant role in determining bond prices. Generally, when interest rates rise, the demand for bonds decreases as investors seek better rates elsewhere. Conversely, when interest rates decrease, the demand for bonds rises, resulting in an increase in their prices. 

Bond Characteristics 

Bonds possess distinct features that differentiate them from other assets and debt instruments. These include maturation and duration, credit rating, face value and issue price, and coupon rates and dates. 

  • Maturation and Duration: While often perceived as interchangeable, maturation and duration have distinct meanings. Maturation refers to the active term of a bond, representing the time until it expires and its final payment is made. Duration, on the other hand, encompasses both a timeframe and a measurement of a bond’s price sensitivity to interest rate changes. The Macaulay duration measures the actual time required to repay a bond’s principal, expressed in years. Calculating a bond’s modified duration using the Macaulay duration allows us to understand its vulnerability to fluctuations in interest rates. 
  • Credit Rating: Credit ratings serve as a grading system that assesses the creditworthiness of bonds. Ratings agencies like Standard & Poor’s and Fitch Ratings assign these grades. Credit ratings play a crucial role in attracting investors by showcasing a bond’s attractiveness to issuers. For potential bondholders, credit ratings are valuable tools for gauging a bond’s risk level. Bonds with the highest creditworthiness receive the AAA rating, while those considered below investment grade are rated from BB+ (often referred to as junk bonds). 
Fitch credit rating for every country 2022
source: reddit.com
  • Face Value: Also known as the principal, the face value is the amount the issuer agrees to pay the bondholder, excluding any coupon (interest) rate payments. Typically, the face value is paid as a lump sum upon the bond’s expiration and remains fixed from its initial setting. However, there are exceptions, such as TIPS (Treasury Inflation-Protected Securities), which are adjusted based on inflation figures. Theoretically, the issue price should match the bond’s face value since both represent the full loan value. Nevertheless, the issue price can differ in the secondary market, where it may fluctuate significantly. 
  • Coupon Rates and Dates: The coupon rate, also known as the interest rate, refers to the interest paid to bondholders, usually on an annual or semi-annual basis. It is also referred to as the nominal yield, calculated by dividing the bond’s annual repayments by its full face value. Coupon dates determine the intervals at which coupon payments occur, which can be monthly, semi-annually, annually, or quarterly, as specified in the bond’s terms. 

Factors Influencing Bond Prices 

The prices of bonds are influenced by several key factors, including demand and supply dynamics, inflation rates, the credit rating of the bonds, and their proximity to maturity. 

As we have discussed, there exists an inverse relationship between bonds and interest rates. When bond prices rise, interest rates decline, and vice versa. Consequently, the demand for bonds is contingent on prevailing interest rates, attracting investors with low interest rates or enticing them with better opportunities during higher interest rate periods. If interest rates become overly high, issuers might reduce the supply of bonds to align with demand. 

Credit ratings serve as a robust indicator of a bond’s overall risk, with cheaper bonds generally carrying higher risks of default. Traders must decide how to manage this risk, and credit rating agencies offer valuable guidance in identifying bonds that represent sound investments. 

As a bond matures, its price naturally gravitates back to its face value, reaching its initial loan amount. Additionally, the number of coupon payments yet to be made influences the bond’s price. 

How to Start Trading Bonds? 

To start trading bonds, follow these steps: 

  1. Choose the type of bonds you want to trade, such as government bonds or corporate bonds, and consider bond CFDs for greater flexibility. 
  1. Decide on your bond trading strategy, considering either hedging or interest rate speculation. 
  1. Open a bond trading account, such as the ones offered by VT Markets, either in live or demo mode to practice your strategy. 
  1. Initiate and monitor your first bond trading position using a reliable trading platform like MetaTrader 4 or MT5. 

In conclusion, understanding bonds and their trading process offers a stable investment option with predictable returns. Diversifying portfolios with various bond types strengthens risk-return profiles. With knowledge of bond characteristics, credit ratings, and influencing factors, we can navigate the financial world confidently. So, let’s set sail on this rewarding journey with bonds as our guiding light! 

Summary: 
  • Bonds provide a stable and predictable investment option, offering a secure harbour amidst market fluctuations. 
  • Bonds are debt instruments where bondholders lend money to institutions, receiving interest until the bond’s maturity, when the principal is repaid. 
  • Various bond types include government bonds, corporate bonds, municipal bonds, and agency bonds. 
  • Diversifying portfolios with different bond types strengthens risk-return profiles and reduces volatility exposure. 
  • Understanding bond characteristics, credit ratings, and influencing factors helps make informed investment decisions. 

Week Ahead: Markets to Focus on US Jobs Reports, RBA Rate Statement, and BOE Rate Statement

This week’s economic calendar features key events that will have a considerable impact on the markets. Major events include the US jobs reports, the Reserve Bank of Australia (RBA) rate statement, and the Bank of England (BOE) rate statement. Traders are advised to carefully prepare for potential market volatility triggered by these announcements and adapt their strategies accordingly. 

Here are some notable highlights coming up over the next week:

Reserve Bank of Australia Rate Statement (1 August 2023)

After raising its interest rate by 25 bps in June, the Reserve Bank of Australia announced during its July meeting that it has maintained its interest rate at 4.1%. This represents a total increase of 400 bps since May 2022. 

The central bank will announce the next interest rate adjustment on 1 August, with analysts expecting an increase of 25 bps to 4.35%.

ISM Manufacturing PMI (1 August 2023)

The ISM manufacturing PMI in the US fell to 46 in June 2023 from 46.9 in May 2023. 

The figures for July are scheduled for release on 1 August, with analysts expecting the index to increase to 48.

Switzerland’s Consumer Price Index (3 August 2023)

Switzerland’s CPI increased by 0.1% in June 2023 from the previous month. 

Analysts anticipate a 0.1% decrease in the figures for July, which will be released on 3 August.

Bank of England Rate Statement (3 August 2023)

The Bank of England raised its policy interest rate by 50 bps to 5% during its June meeting, marking a 13th consecutive hike. 

Analysts expect the next rate hike to be another 25-bps increase to 5.25%.

US ISM Services PMI (3 August 2023)

The ISM services PMI rose to 53.9 in June 2023. This mark, which is well above the 50 seen in May, points to the strongest growth in the services sector in four months. 

The ISM’s data for July 2023 is scheduled for release on 3 August, with analysts anticipating a decrease in PMI to 52.

Canada Employment Change (4 August 2023)

The Canadian economy saw 59,900 jobs created in June. This increase was driven by the rise in full-time jobs and marks the highest number of jobs created in five months. However, the unemployment rate also rose to 5.4% in June from 5.2% in May, the highest since February 2022. 

The figures for July are set to be released on 4 August, with analysts predicting the creation of 20,000 additional jobs. However, the unemployment rate is also expected to remain at 5.4%.

US Jobs Report (4 August 2023)

The US economy added 209,000 jobs in June 2023, lower than the 306,000 seen in May. The unemployment rate in the country decreased slightly to 3.6%, which is also lower than May’s seven-month high of 3.7%. 

The data for July 2023 will be released on 4 August, with analysts predicting the creation of 190,000 additional jobs. However, the unemployment rate is also expected to remain at 3.6%.

Dow Jones Ends Historic Winning Streak Amid Economic Data and Rate Hike Uncertainty

The Dow Jones Industrial Average’s extraordinary winning streak of 13 consecutive gains came to a halt as investors opted to take profits, leading to a 0.67% decline, with the index closing at 35,282.72 points. The historic run, dating back to 1897, would have tied the record if it had gained for a 14th day. The bullish momentum had been driven by promising economic signs, such as evading a recession, decreasing inflation, and strong corporate earnings. However, the recent surge in the 10-year Treasury yield above 4% and uncertainty surrounding the Federal Reserve’s rate hike decisions caused market sentiment to waver. With upcoming data releases in sight, traders are closely observing the economic indicators, speculating on the Fed’s potential response, as the central bank’s actions may have a significant impact on market trends.

One contributing factor to the Dow’s previous gains was the robust performance of companies like Meta Platforms, whose shares surged 4.4% due to impressive quarterly results and promising guidance, fueled by a rebound in advertising revenue. Additionally, the latest gross domestic product (GDP) reading for the second quarter indicated a 2.4% rise, surpassing economists’ expectations. Notably, the report suggested that price pressures were easing, with the personal consumption expenditures price index rising 2.6%, lower than anticipated. Despite the Fed’s recent rate hike, investors remained relatively optimistic, believing that Federal Reserve Chair Jerome Powell’s commitment to data-driven decision-making could potentially prevent further aggressive monetary tightening. However, the Dow’s remarkable winning streak came to an end, prompting caution among investors and heightened attention to forthcoming economic data releases.

Data by Bloomberg

On Thursday, all sectors in the market experienced a general decline, with the overall market showing a decrease of 0.64%. The Communication Services sector was an exception, bucking the trend with a gain of 0.85%. However, the Information Technology sector saw a slight dip of 0.34%. The Energy sector also experienced a modest decline of 0.54%, while the Materials sector faced a drop of 0.67%. Health Care and Consumer Staples sectors both declined by 0.77% and 0.81%, respectively. The Industrials and Consumer Discretionary sectors had larger losses, both falling by 0.82% and 0.87%, respectively. The Financials sector showed the most significant decrease, experiencing a notable drop of 1.29%. The Utilities sector followed closely with a decline of 1.73%, and the Real Estate sector suffered the largest loss, plummeting by 2.12%.

Major Pair Movement

On Thursday, the forex market witnessed a volatile session, with the dollar initially retreating after the Federal Reserve’s data-dependent stance but later rebounding. The yen surged higher following a report that the Bank of Japan (BoJ) would discuss tweaking its yield curve control at an upcoming meeting. This led to a significant impact on currency pairs like EUR/USD, which fell 0.9% to its lowest level since July 11. Additionally, USD/JPY faced fluctuations, initially rebounding but later dropping as the BoJ’s potential policy changes raised concerns about a stronger yen. The outcome of the BoJ meeting on Friday is closely watched, as any indications of a shift towards less accommodative policies may further strengthen the yen.

Furthermore, other factors influenced currency movements, such as surging Treasury yields, which contributed to the broader rise of the dollar and caused declines in currencies like Sterling, AUD/USD, and yuan. Traders are now awaiting several economic indicators scheduled for release on Friday, including Tokyo CPI, euro zone regional CPIs, U.S. core PCE, ECI, and Michigan sentiment, which could drive further market volatility and impact forex trends.

Picks of the Day Analysis

EUR/USD (4 Hours)

EUR/USD Plunges Amid Strong Dollar Surge After ECB Meeting and Upbeat US Data

The EUR/USD experienced a sharp decline on Thursday following the European Central Bank (ECB) meeting, driven primarily by the strength of the US dollar, which soared across the board due to encouraging US economic data. The data showed that the US economy surpassed expectations in the second quarter, with Initial Jobless Claims dropping to their lowest level in five months and Durable Goods Orders surging over 4% in June. This evidence of a healthy US economy overshadowed the ECB’s expected 25 basis points policy rate hike, as no further rate hike announcements were made, leaving all options open for the next meeting. The potential pause in monetary policy divergence between the US and the Eurozone could impact the EUR/USD exchange rate. Inflation data will play a crucial role in limiting the Dollar’s rally, with the focus shifting to the US Core Personal Consumption Expenditure Index, the Federal Reserve’s preferred measure, and the preliminary July Consumer Price Index releases from France, Spain, and Germany.

Chart EURUSD by TradingView

According to technical analysis, the EUR/USD falls on Thursday and creates a push to the lower band of the Bollinger Bands. This movement has also resulted in a wider gap between the bands. The Relative Strength Index (RSI) currently stands at 32, indicating that the EUR/USD is starting to enter the bearish moment.

Resistance: 1.1038, 1.1121

Support: 1.0915, 1.0839

XAU/USD (4 Hours)

XAU/USD Slide Amid Stronger US Dollar and Higher Yields, Reflecting Optimistic US Economic Data

Gold prices experienced a significant drop of more than $30 during the American session, largely due to a stronger US dollar and higher US Treasury yields. The yellow metal faced technical pressures as well, hitting a low of $1,942 before a modest rebound. US economic data showing unexpected acceleration in the second quarter, with real GDP expanding at 2.4%, coupled with positive Jobless Claims and Durable Goods Orders figures, supported the notion that the economy could withstand monetary policy tightening. Consequently, the US dollar rallied, and yields surged, prompting a sharp reversal in gold prices. The European Central Bank’s rate hike and potential pause in September, along with reports of the Bank of Japan considering tweaks to its Yield Curve Control policy, also influenced market sentiment. The outlook now suggests the possibility of further short-term losses in metals given the context of higher yields and a stronger US dollar, as the US economy shows resilience and lower inflation indicators compared to European countries.

Chart XAUUSD by TradingView

According to technical analysis, the XAU/USD falls on Thursday and has created a push towards the lower band of the Bollinger Bands. Currently, the price is slightly higher, but it remains near the lower band, indicating that there is still potential for Gold to move even lower. The Relative Strength Index (RSI) currently stands at 41, which indicates that the XAU/USD pair is starting to enter a bearish stance.

Resistance: $1,954, $1,975

Support: $1,938, $1,920

Economic Data

CurrencyDataTime (GMT + 8)Forecast
JPYBOJ Outlook ReportTentative 
JPYMonetary Policy StatementTentative 
JPYBOJ Press ConferenceTentative 
EURGerman Prelim CPI m/mAll Day0.3%
CADGDP m/m20:300.3%
USDCore PCE Price Index m/m20:300.2%
USDEmployment Cost Index q/q20:301.1%
USDRevised UoM Consumer Sentiment22:0072.6

Dow Jones Extends Historic Winning Streak Amid Federal Reserve Rate Hike and Earnings Reports

In a remarkable show of strength, the Dow Jones Industrial Average experienced its best winning streak since 1987, advancing for 13 consecutive days. The 30-stock index added 82.05 points, or 0.23%, reaching 35,520.12, and is now on the cusp of matching the longest streak ever recorded dating back to June 1897. The market’s optimism was fueled by a Federal Reserve rate hike, pushing rates to their highest level in over 22 years. However, Fed Chief Jerome Powell’s comments about the possibility of a pause in future rate increases left traders uncertain, impacting Treasury yields. While some companies, like Google-parent Alphabet and Boeing, reported strong earnings leading to stock gains, others, like Microsoft, experienced declines due to slower cloud revenue growth.

Overall, the market’s mixed sentiment reflects the delicate balance between economic indicators and the Federal Reserve’s data-dependent approach in determining future monetary policies. Traders eagerly await the Fed’s decision on rates in September, hoping for signs that the economy can avoid a recession if the central bank chooses to remain on hold. The ongoing corporate earnings season is also influencing market movements, with companies like Alphabet and Boeing showing strength, while Microsoft’s performance was met with some disappointment. As the market continues to digest these factors, investors are keeping a close eye on the Dow Jones as it seeks to extend its historic winning streak.

Data by Bloomberg

On Wednesday, the overall market experienced a slight decline of 0.02%. Among the sectors, Communication Services stood out with a significant increase of 2.65%, while Industrials and Financials also showed positive gains of 0.66% and 0.65% respectively. Real Estate and Consumer Staples sectors also saw modest growth, rising by 0.34% and 0.21% respectively. However, Utilities, Consumer Discretionary, and Health Care sectors faced marginal declines, with drops of 0.05%, 0.06%, and 0.08% respectively. Energy and Materials sectors experienced somewhat larger losses, declining by 0.09% and 0.28%. Information Technology, on the other hand, took the steepest hit with a significant drop of 1.30%.

Major Pair Movement

On Wednesday, the dollar index weakened as investors focused on Federal Reserve Chair Jerome Powell’s dovish comments, overshadowing slightly improved economic growth language in the FOMC statement. While Treasury yields and the dollar initially rose after the statement mentioned the economy growing at a “moderate” pace, Powell’s news conference suggested that the end of rate hikes might be approaching. Market attention now turns to the upcoming policy announcements from the European Central Bank (ECB) and the Bank of Japan (BoJ) on Thursday and Friday, as well as crucial U.S. data. Thursday’s GDP and claims data, along with Friday’s personal income, spending, core PCE, employment cost index, and Michigan sentiment figures will be closely monitored ahead of the August Jackson Hole symposium and the September Fed meeting. Investors are also closely watching the ECB’s potential rate hike and the outlook for the EUR/USD pair, which rose after Powell’s comments, despite concerns about deteriorating euro zone economic data and the ECB’s dovish stance.

Meanwhile, USD/JPY fell as the market awaits the BoJ’s decision on whether it will tighten its policy on Friday. Governor Kazuo Ueda’s indications that policy will not be tightened are being scrutinized, but speculation about a possible rise in the JGB yield cap persists based on economic projections from the meeting. In the UK, the sterling rose after coming off earlier highs, with the possibility of a 50bp Bank of England (BoE) rate hike in August remaining slightly less favored compared to a 25bp increase. However, nearly 1% of further increases are still priced in due to the UK’s high inflation rate and the risks associated with managing it. On the other hand, the Australian dollar and the yuan faced declines after Q2 Australian inflation came in below forecasts, and doubts arose about the impact of Chinese stimulus plan promotions.

Overall, the global currency markets remain highly sensitive to central bank decisions, economic data, and policymakers’ statements, with investors assessing each currency’s strength based on a complex interplay of economic conditions and monetary policies.

Picks of the Day Analysis

EUR/USD (4 Hours)

EUR/USD Rises Amid Dovish Fed Comments, ECB Policy Announcements Awaited

The EUR/USD pair saw gains as Federal Reserve Chair Jerome Powell’s dovish remarks outweighed slight improvements in the FOMC statement on economic growth. Traders are now focused on upcoming policy announcements from the ECB along with key US economic data. Although Treasury yields and the dollar initially strengthened, Powell’s comments suggested a growing possibility of the end of rate hikes. Market participants await crucial GDP, claims, personal income, and other data before the Jackson Hole symposium and the September Fed meeting. The euro faces challenges from weakening eurozone economic data and a dovish ECB member. Uncertainty persists about whether EUR/USD has already peaked post-pandemic, with relative economic risk possibly favoring the US. Staying updated on central bank policies and economic indicators is vital for shaping the EUR/USD exchange rate.

Chart EURUSD by TradingView

According to technical analysis, the EUR/USD pair is experiencing a higher movement on Wednesday, leading the price to reach the upper band of the Bollinger Bands. This movement has also resulted in a closer gap between the bands. The Relative Strength Index (RSI) currently stands at 53, indicating that EUR/USD is back in neutral stance.

Resistance: 1.1121, 1.1208

Support: 1.1022, 1.0950

XAU/USD (4 Hours)

XAU/USD Prices Surge as Fed Raises Interest Rates, US Dollar Weakens

Gold prices have surged to weekly highs above $1,974 following the Federal Reserve’s decision to raise interest rates by 25 basis points. The increase in rates has led to a weakening of the US Dollar and an increase in market volatility. Market participants are now closely watching for any signals from the Fed that this could be the last rate hike, which could trigger a rally in bonds and drive Treasury yields lower, further benefiting the price of gold. However, the risk of a sharp reversal remains as the Fed is expected to maintain a hawkish tone until inflation shows clear signs of moving towards the target. The outcome of the Fed meeting will determine the direction of gold, and volatility is expected to persist with the European Central Bank’s decision and US economic data releases later in the week.

Chart XAUUSD by TradingView

According to technical analysis, the XAU/USD pair initially experienced a higher movement and created a push to the upper band of the Bollinger Bands. Currently, the price is still pushing the upper band of the Bollinger Bands which shows there’s still a strong higher movement for Gold. Furthermore, the Relative Strength Index (RSI) currently stands at 65, indicating that the XAU/USD pair is starting to create a bullish trend.

Resistance: $1,985, $1,992

Support: $1,969, $1,955

Economic Data

CurrencyDataTime (GMT + 8)Forecast
EURMain Refinancing Rate20:154.25%
EURMonetary Policy Statement20:15 
USDAdvance GDP q/q20:301.8%
USDUnemployment Claims20:30234K
EURECB Press Conference20:45 

Dow Jones Extends Winning Streak Amid Earnings Reports and Fed Speculations

The Dow Jones Industrial Average achieved its longest winning streak in over six years as it closed higher on Tuesday. The index rose by 0.08%, or 26.83 points, reaching 35,438.07. This marked the 12th consecutive positive session for the 30-stock index, the longest rally since February 2017. Meanwhile, the S&P 500 climbed 0.28%, and the Nasdaq Composite advanced 0.61%. Traders closely examined the latest earnings reports, with General Motors seeing a 3.5% decline despite raising its full-year earnings guidance, while General Electric surged nearly 6.3% due to stronger-than-expected second-quarter revenue.

Investors eagerly awaited the Federal Reserve’s policy decision, expecting a quarter percentage point rate increase. However, uncertainties lingered about future actions as the market sought clarity on the Fed’s stance towards inflation and its economic outlook. Amidst this backdrop, Wall Street analyzed results from major tech companies, including Alphabet and Microsoft, which were set to report after the market’s close. As earnings season progressed, around 79% of S&P 500 companies surpassed analyst expectations for the second quarter, offering optimism for the overall market performance.

Data by Bloomberg

On Tuesday, most sectors experienced modest gains, with all sectors combined showing a positive change of +0.28%. The Materials sector had the highest increase at +1.76%, followed by Information Technology at +1.19%, and Energy at +0.57%. Communication Services also saw a slight uptick of +0.42%, while Utilities and Commercial & Professional Services had more marginal gains of +0.22% and +0.42% respectively.

On the other hand, several sectors faced declines. Financials had the most significant drop, with a decrease of -0.73%, closely followed by Real Estate at -0.74%. Transportation experienced a notable decline of -0.63%, while Consumer Discretionary and Industrials both saw moderate decreases of -0.23% and -0.13% respectively. Health Care and Consumer Staples also ended the day in the red, but with marginal changes of -0.06% and -0.05% respectively.

Major Pair Movement

The dollar index slipped 0.07% as risk-on sentiment increased, reducing demand for the U.S. currency. Weak economic data weighed on the euro ahead of the Federal Reserve and European Central Bank (ECB) meetings. Sterling rose 0.4% with important supports preventing further decline. The prospect of ECB rate hikes diminished due to lackluster euro zone data in July, leading to a slide in EUR/USD.

EUR/USD fell 0.24%, marking its fifth consecutive daily loss to its lowest level since July 12, triggered by below-forecast U.S. CPI data. Dovish comments from ECB officials added to concerns about a potential rate hike beyond the expected 25bp increase this week. USD/JPY also declined 0.2% amid a broader risk-on sentiment and ahead of the Fed meeting. However, strong services data and rising Treasury yields provided some support.

Market expectations for a 25bp Fed rate hike were steady, but there were doubts about additional rate increases in the future. Speculation about increasing the pace of quantitative tightening instead of raising rates multiple times emerged. The BoJ meeting was anticipated to maintain unchanged policies, but some trimming of yen shorts was possible if there were any surprises.

Traders remained cautious due to significant upcoming U.S. data releases, including GDP, jobless claims, personal income, spending, core PCE, employment costs, and Michigan sentiment. Additionally, market participants kept an eye on earnings reports from major U.S. tech companies and beyond.

Picks of the Day Analysis

EUR/USD (4 Hours)

EUR/USD Continues Decline Amid Weaker Euro and Central Bank Decisions

The EUR/USD pair experienced its fifth consecutive day of losses as the Euro weakened ahead of central bank decisions. The European Central Bank (ECB) survey revealed a significant drop in loan demand from companies, indicating a deteriorating economic outlook. The German July IFO survey also disappointed expectations. While a 25-basis point rate hike from the ECB is anticipated, the future interest rate trajectory remains uncertain. The focus now shifts to the upcoming FOMC meeting, where the Federal Reserve’s rate decision and messaging will be critical for the EUR/USD direction, with potential for increased volatility in the market.

Chart EURUSD by TradingView

According to technical analysis, the EUR/USD pair is experiencing a downward movement on Tuesday, leading to a push towards the lower band of the Bollinger Bands. This movement has also resulted in a wider gap between the bands. The Relative Strength Index (RSI) currently stands at 29, indicating that there is potential for further downward movement in the EUR/USD pair.

Resistance: 1.1121, 1.1208

Support: 1.1022, 1.0950

XAU/USD (4 Hours)

XAU/USD Prices Up as US Dollar Surges Amidst Fragile Economic Balance

Gold prices have risen despite XAU/USD reaching a one-week low, as the US Dollar strengthened due to a bleak economic outlook. The upcoming monetary policy announcements by the US Federal Reserve and the European Central Bank are awaited with caution, with expectations of a rate hike. Traders are also keeping an eye on macroeconomic figures, including Q2 Gross Domestic Product and inflation updates for the US and Germany, to determine the direction of the FX board in the coming weeks.

Chart XAUUSD by TradingView

According to technical analysis, the XAU/USD pair initially experienced a slight decline on Monday. However, it subsequently rebounded and reached the middle band of the Bollinger Bands. At present, the price is slightly above the middle band. Furthermore, the Relative Strength Index (RSI) currently stands at 51, indicating that the XAU/USD pair is still in a neutral position.

Resistance: $1,971, $1,992

Support: $1,954, $1,941

Economic Data

CurrencyDataTime (GMT + 8)Forecast
AUDConsumer Price Index q/q09:301.0%
AUDConsumer Price Index y/y09:305.4%
USDFOMC Statement02:00 (27th) 
USDFederal Funds Rate02:00 (27th)5.50%
USDFOMC Press Conference02:30 (27th) 

Dow Jones Extends Winning Streak Amid Key Earnings Reports and Federal Reserve Policy Decision

The Dow Jones Industrial Average continued its impressive winning streak, marking the longest rally since February 2017, with an 11th consecutive day of gains. The 30-stock Dow rose 0.52%, reaching 35,411.24 points, supported by a 0.40% rise in the S&P 500 and a 0.19% gain in the Nasdaq Composite. Energy stocks led the upward trend, particularly with a 1.7% surge in the S&P 500’s energy sector following positive oil and gasoline futures. Notably, Chevron’s nearly 2% increase came after the company reported better-than-expected preliminary second-quarter earnings. However, market participants remain cautious as the upcoming week includes significant earnings reports from approximately 150 S&P 500 companies and the Federal Reserve’s policy decision. Traders are eager to gauge Chair Jerome Powell’s remarks to understand the central bank’s approach to the economy’s soft landing and the potential quarter-percentage-point rate increase anticipated at the meeting’s conclusion on Wednesday.

Investors are closely monitoring the potential impact of the earnings reports and the Fed’s policy decision on the recent bullish run. The upcoming week is marked by substantial earnings releases from major companies, including Alphabet, Microsoft, and Meta, as well as industrial firms and big oil. Furthermore, traders are eagerly awaiting the release of the personal consumption expenditures index, the Fed’s preferred inflation gauge, at the end of the week. As these critical events unfold, Wall Street remains on the lookout for any signs of market volatility and potential shifts in economic sentiment.

Data by Bloomberg

On Monday, the overall market showed positive performance, with all sectors gaining 0.40%. The energy sector led the way with a notable increase of 1.66%, followed closely by financials and real estate, which rose by 1.01% and 1.00%, respectively. Consumer discretionary stocks also performed well, posting a gain of 0.52%. Communication services and consumer staples sectors saw modest growth with increases of 0.46% and 0.38%, respectively. Materials and information technology sectors showed moderate gains of 0.31% and 0.26%. However, the health care sector experienced a slight decline of 0.23%, while utilities had a marginal decrease of 0.28% on Monday.

Major Pair Movement

The dollar index strengthened by 0.26% as both the euro and sterling faced losses due to disappointing flash euro zone and UK PMI data. This rise in the dollar index was partially offset by a 0.25% drop in USD/JPY, which followed steady Japan PMI figures. Market participants were closely monitoring the upcoming meetings of major central banks, including the Federal Reserve, the European Central Bank (ECB), and the Bank of Japan (BoJ), all scheduled later in the week.

The dollar’s resilience was supported by a rebound in Treasury yields, which had initially fallen in response to lower European yields and mixed U.S. PMI data. However, the retreat in yields was short-lived, bolstered by increased corporate supply and expectations surrounding this week’s 2, 5, and 7-year Treasury auctions. The future direction of Treasury yields and the dollar hinges largely on the statements issued by the Federal Reserve after the expected 25 basis point rate hike on Wednesday. Market sentiment remains uncertain, given broader indications of a cooling U.S. economy and lower inflation, which may potentially favor rate cuts in the coming year.

During this period of central bank activity, investors were also closely monitoring the impact of Russian attacks on Ukraine ports, which contributed to a surge in wheat prices, and the ongoing recovery in fuel prices. Additionally, traders kept a keen eye on other crucial economic indicators such as German Ifo data and U.S. consumer confidence. The ECB is expected to implement a 25 basis point rate hike on Wednesday, with further increases largely priced in by year-end. Consequently, the euro experienced a decline of 0.49%, while sterling also faced a 0.23% drop, as the Bank of England (BoE) is likely to pursue a 25 basis point rate hike in August, followed by additional hikes to tackle higher inflation in the UK. USD/JPY experienced fluctuations in line with Treasury yields, fueled by lingering hopes that the BoJ would raise its JGB yield cap on Friday. Moreover, Japanese government efforts to limit yen depreciation, which contribute to cost-push inflation rather than demand-pull inflation, also influenced the currency pair’s movements.

Picks of the Day Analysis

EUR/USD (4 Hours)

EUR/USD Extends Decline as Eurozone PMIs Miss Expectations Ahead of Central Bank Meetings

The EUR/USD currency pair continued its downward trajectory, marking its fifth consecutive day of losses and reaching its lowest daily close since July 12. The euro’s correction lower follows its earlier peak at around 1.1300, which was the highest level in over a year. Economic data from the Eurozone, particularly the disappointing Manufacturing PMI at 42.7 and Services PMI at 51.1 in June, along with a Composite Index of 48.9, the lowest since November, raised concerns about the region’s economic strength and potential recession risks. Despite this backdrop of economic weakness, the European Central Bank (ECB) is still anticipated to implement a 25 basis point interest rate hike on Thursday, with the market closely watching the bank’s messaging for further cues.

As market participants positioned themselves for the Federal Reserve’s decision, US Treasury yields experienced a slight increase. The Fed is expected to raise its key rate by 25 basis points on Wednesday, making the central bank’s statements crucial for the direction of the US Dollar and financial markets overall. The US PMI data showed mixed results, with the Services PMI falling to 52.4 in July, below the expected 54, while the Manufacturing PMI rebounded to 49, exceeding the market consensus of 46.4. Amidst these developments, the DXY (Dollar Index) continued to rise, exerting downward pressure on the EUR/USD pair. Though some stabilization may occur prior to the Fed meeting, increased volatility is expected in the coming sessions. Key events to monitor include the German IFO survey and US housing data on Tuesday.

Chart EURUSD by TradingView

According to technical analysis, the EUR/USD pair is moving lower on Monday creating a push to the lower band of the Bollinger Band and creating a wider gap between the bands. The Relative Strength Index (RSI) is currently at 31, suggesting that the EUR/USD pair has the potential of moving lower.

Resistance: 1.1121, 1.1208

Support: 1.1022, 1.0950

XAU/USD (4 Hours)

XAU/USD Under Mild Pressure as US Dollar Gains Favor Amid Encouraging Data

Gold started the week facing mild pressure and remained at the lower end of the previous week’s range, with XAU/USD trading below $1,960 per troy ounce. The US Dollar saw some market favor after mixed yet encouraging data from the United States. S&P Global’s preliminary estimates of the July Purchasing Managers’ Index (PMI) showed a higher-than-expected increase in the Manufacturing PMI, reaching 49, its highest level in three months. However, the Services PMI, though still in expansionary territory, slowed to 52.4 from the previous 54.4. Despite this, US companies indicated continued business activity growth in July, with the service sector leading the expansion. Wall Street remained resilient, disregarding negative cues from international markets, as investors focused on upcoming earnings reports and significant events, including decisions on monetary policy from the US Federal Reserve and the European Central Bank. Furthermore, crucial economic indicators such as the preliminary Q2 Gross Domestic Product (GDP) estimate and the June Personal Consumption Expenditures (PCE) Price Index were also anticipated.

Chart XAUUSD by TradingView

According to technical analysis, the XAU/USD pair moved lower on Monday but then managed to move back higher and try to reach the middle band of the Bollinger Bands. Currently, the price is slightly below the middle band. Additionally, the Relative Strength Index (RSI) is at 48, suggesting that the XAU/USD pair has returned to a neutral stance.

Resistance: $1,971, $1,992

Support: $1,954, $1,941

Economic Data

CurrencyDataTime (GMT + 8)Forecast
USDCB Consumer Confidence22:00112.1

A Comprehensive Guide to Fundamental Analysis in Forex Trading

Let’s say you are a Forex trader who is interested in trading the EUR/USD currency pair. You know that the European Central Bank (ECB) is scheduled to announce its interest rate decision tomorrow. The ECB’s interest rate decision is a major event that can have a significant impact on the value of the euro. 

Using fundamental analysis, you can assess the potential impact of the ECB’s interest rate decision on the EUR/USD currency pair. If you believe that the ECB is likely to raise interest rates, you might expect the euro to appreciate in value. Conversely, if you believe that the ECB is likely to keep interest rates unchanged, you might expect the euro to depreciate in value. 

By understanding the potential impact of the ECB’s interest rate decision, you can make a more informed decision about whether to buy or sell the EUR/USD currency pair. This is fundamental analysis use example. 

Understanding Fundamental Analysis in Forex Trading 

Fundamental analysis is a method used by Forex traders to understand the true value of a currency pair based on economic, financial, and geopolitical factors. By understanding these factors, traders can make more informed decisions about when to buy or sell currencies and other assets. 

Fundamental analysis is based on the idea that the price of a currency is ultimately determined by its underlying value. This value is influenced by a variety of factors, including: 

Economic indicators 

  • GDP growth: GDP growth is a measure of the overall size of an economy. A strong GDP growth rate is typically seen as a positive sign for a country’s currency, as it suggests that the economy is growing and becoming more prosperous. 
  • Employment data: Employment data measures the number of people who are employed in a country. A strong employment report can be a positive sign for a country’s currency, as it suggests that the economy is creating jobs and people are spending money. 
  • Inflation rates: Inflation is a measure of the rate at which prices are rising in a country. A high inflation rate can be a negative sign for a country’s currency, as it suggests that the value of the currency is decreasing. 

Central bank policies 

  • Interest rates: Interest rates are the rates at which banks lend money to each other. When interest rates are raised, it makes it more expensive for businesses to borrow money, which can slow down economic growth. This can lead to a depreciation in the value of the currency. 
  • Monetary policy: Monetary policy is the set of tools that central banks use to manage the money supply and interest rates in an economy. A central bank’s monetary policy can have a significant impact on the value of a currency. 
source: Los Angeles Times

Geopolitical events 

  • Elections: Elections can have a significant impact on the value of a currency. If a new government is elected that is seen as being more favourable to business, the value of the currency may appreciate. Conversely, if a new government is elected that is seen as being less favourable to business, the value of the currency may depreciate. 
  • Wars: Wars can have a significant impact on the value of a currency. If a war breaks out in a country, the value of the currency may depreciate as investors lose confidence in the country’s economy. 
  • Natural disasters: Natural disasters can also have a significant impact on the value of a currency. If a natural disaster strikes a country, the value of the currency may depreciate as investors lose confidence in the country’s economy. 

Market sentiment 

The overall mood of traders towards a currency pair can also have a significant impact on its value. If traders are bullish on a currency pair, they are more likely to buy it, which can drive up its value. Conversely, if traders are bearish on a currency pair, they are more likely to sell it, which can drive down its value. 

For example, a positive economic report, such as better-than-expected employment data, can boost investor confidence in a country’s economy, leading to increased demand for its currency. 

How to Use Fundamental Analysis 

Fundamental analysis can be used to inform both short-term and long-term trading decisions. However, it is more commonly used for long-term trading, as it takes time for fundamental factors to have a significant impact on currency prices. 

To use fundamental analysis, traders need to track economic data releases, central bank announcements, and other geopolitical events that could impact currency values. They can then use this information to assess the underlying value of a currency pair and make trading decisions accordingly. 

For example, if a country’s GDP growth is strong, it is likely that its currency will appreciate in value. This is because a strong economy is seen as being more stable and attractive to investors. Conversely, if a country’s GDP growth is weak, its currency is likely to depreciate in value. 

The Economic Calendar 

One of the most important tools for fundamental analysis is the economic calendar. This is a schedule of upcoming economic events and news releases that could impact currency pairs. The economic calendar is a valuable tool for traders because it allows them to stay informed about upcoming events and make informed trading decisions. 

The economic calendar typically includes information about the following: 

  • The date and time of the event 
  • The name of the event 
  • The country where the event is taking place 
  • The impact of the event on currency markets 

VT Markets offers a user-friendly Economic calendar that is accessible to beginners. The calendar is easy to navigate and provides clear information about upcoming economic events. It also includes an “importance” rating, which helps traders gauge the potential effect of an event on the market. 

Additionally, you can use a Daily market analysis by VT Markets that can be a valuable tool for fundamental analysis. The Daily market analysis provides an overview of the key economic events and geopolitical developments that could impact currency values. It also includes a technical analysis section that provides insights into the short-term trends in currency prices. 

Tips for using Fundamental Analysis in Forex trading: 

  • Start by learning about the basics of economic analysis. This includes understanding key economic indicators, central bank policies, and geopolitical events. 
  • Use a reliable economic calendar to stay informed about upcoming events. This will help you identify potential trading opportunities and avoid making uninformed decisions. 
  • Combine fundamental analysis with technical analysis to make more informed trading decisions. Technical analysis can help you identify trends and patterns in currency prices, while fundamental analysis can help you understand the underlying reasons for these trends. 
  • Don’t be afraid to experiment with different trading strategies. There is no one-size-fits-all approach to fundamental analysis, so it’s important to find a strategy that works for you. VT Markets provides a Demo account for risk-free strategy testing. 
  • Most importantly, be patient and persistent. It takes time and effort to master fundamental analysis, but it can be a valuable tool for successful Forex trading. 

Pros & Cons of Fundamental Analysis 

Pros: 

  • Fundamental analysis can help you understand the underlying factors that influence currency values. 
  • This can help you make more informed trading decisions. 
  • Fundamental analysis can be used to identify potential trading opportunities. 
  • It can also help you avoid making uninformed decisions. 

Cons: 

  • Fundamental analysis can be time-consuming and complex. 
  • It can be difficult to predict the future, even with a good understanding of fundamental factors. 
  • Fundamental analysis is not the only factor that influences currency prices. 
  • Other factors, such as technical analysis and market sentiment, can also play a role. 

In conclusion, fundamental analysis is a valuable tool for Forex traders who want to make informed trading decisions. However, it is important to remember that fundamental analysis is not the only factor that influences currency prices. By combining fundamental analysis with other trading tools, you can make more informed and confident trading decisions. 

Summary: 
  • Fundamental analysis is a method used by Forex traders to understand the true value of a currency pair based on economic, financial, and geopolitical factors. 
  • Economic indicators, central bank policies, geopolitical events, and market sentiment are key factors influencing currency values. 
  • Beginners are advised to combine fundamental analysis with technical analysis for comprehensive decision-making. 

How to trade indices? 

Transport yourself back to the remarkable year of 1896, a time characterised by industrial revolution and transformative economic changes. Amid the bustling streets of New York City, the brilliant mind of Charles Dow sparked an idea that would send ripples through the financial world. 

With a mere selection of 12 carefully chosen companies, he crafted what we know today as the Dow Jones Industrial Average (DJIA) – a beacon of brilliance among stock indices. 

Fast-forward to the present day, and these luminous indicators continue to captivate investors and economists alike. They offer a unique glimpse into a country’s economic performance, providing invaluable insights into the ever-changing global financial landscape. 

If you’re interested in understanding how indices trading works, what these indices represent, and how to analyse their price movements, continue reading to explore our detailed guide. 

Understanding Indices 

Indices are numerical representations of the top-performing shares from a particular stock exchange. They provide a snapshot of the exchange’s major players by averaging individual stock movements, consolidating a vast amount of financial activity into a single figure. 

Some of the largest indices in the world are: 

  • Dow Jones (in the US) 
  • Nasdaq (US) 
  • S&P 500 (US) 
  • DAX 40 (in Germany) 
  • CAC (in France) 
  • FTSE (in the UK) 
  • Hang Seng (in Hong Kong) 
  • Nikkei (in Japan) 
  • ASX (in Australia) 

Stock indices can be calculated using two distinct approaches: one involves considering the performance of the largest companies, known as a market capitalisation-weighted average. This method is employed for indices like the S&P 500, FTSE, and ASX, where the movements of high-value companies carry greater influence over the overall index. 

While the majority of stock indices adopt this approach, there are exceptions, and some indices are calculated using a price-weighted average. The Dow Jones and Nikkei are prime examples of indices using this method, where shares with higher prices wield more significant sway. 

Since indices represent the overall stock value of multiple top-performing companies or high-value stocks, they tend to be more volatile compared to individual company stocks, providing both trading opportunities and increased risk for traders. 

What is Index Trading? 

Since indices are just numbers representing the performance of a group of shares on an exchange, they cannot be directly bought or sold. 

Instead, traders need to choose products that mirror their performance, such as: 

  • Index funds
  • Exchange-traded funds (ETFs)
  • Futures
  • Options
  • Contracts for differences (CFDs). 

These products track the underlying index’s price, allowing traders to speculate on whether the index’s price will rise or fall and take positions accordingly. 

Image shows index drops amid the covid-19 outbreak
U.S stock indexes drops since 31/12/2019 (as %)
source: howmuch.net

Factors Influencing Index Prices 

Various factors can cause index prices to rise or fall, and understanding these factors is essential for trading indices effectively. These factors include: 

  • General economic news: As indices summarise multiple companies’ stock performances, they serve as indicators of an economy’s health and are influenced by economic news. 
  • Global news: Multinational corporations within local indices are affected by global events, such as pandemics, natural disasters, commodity price fluctuations, supply chain disruptions, and global economic turmoil. 
  • Company financial results: Individual companies’ performance within an index affects the overall index, especially for highly valued companies with significant stock price movements. 
  • Company announcements: Changes in company leadership, mergers, manufacturing updates, and other announcements have broader implications for individual stock prices and the index price. 
  • Index composition changes: Adding or removing companies from an index can impact its overall price and requires traders to reevaluate their positions. 

How to Trade Indices 

When trading stock indices, thorough research, a good understanding of the chosen product, and proper risk management strategies are crucial. Index CFDs are among the most popular trading products. They allow traders to profit from both rising and falling index prices by predicting the price direction accurately. 

Traders can approach index CFDs in two ways: going long or going short. Going long involves buying index trading products when expecting the price to rise, while going short involves selling or closing positions when expecting a price decline. Profit or loss depends on the accuracy of the prediction and the market’s overall movement. 

CFD trading involves leverage, allowing traders to open positions with a small initial deposit (margin) that represents a percentage of the total asset value. While leverage provides exposure to larger markets with less capital, it also carries the risk of incurring losses greater than the initial deposit. Traders should choose suitable strategies for their portfolios when trading CFDs. 

Tips on Successful Trading Indices 

  • Do your research: Before you start trading, it is important to do your research and understand the risks involved. Read books and articles about index trading and watch educational videos. This will help you understand how the market works and how to make informed trading decisions. 
  • Start small: Don’t start trading with a large amount of money. Start with a small amount and gradually increase your investment as you gain experience. This will help you minimise your losses if you make any mistakes. 
  • Use a demo account: VT Markets offers a Demo account [internal link: https://www.vtmarkets.com/get-trading/open-demo-account/] that allow you to trade with virtual money. This is a great way to learn the basics of trading without risking any real money. Once you feel comfortable with the process, you can start trading with real money. 
  • Be patient: Trading indices can be a volatile market, so it is important to be patient and not expect to get rich quick. It takes time and experience to become a successful trader. 
  • Use stop-loss orders: Stop-loss orders are a way to limit your losses. If the price of an index falls below a certain level, your trade will be automatically sold, preventing you from losing more money than you are comfortable with. 
  • Use take-profit orders: Take-profit orders are a way to lock in your profits. If the price of an index rises above a certain level, your trade will be automatically sold, ensuring that you don’t miss out on potential profits. 
  • Don’t trade emotionally: It is important to stay calm and make rational decisions when trading indices. Don’t let your emotions get the best of you, or you will likely make bad trading decisions. 

Starting Index Trading 

To begin trading indices in live markets, follow these steps: 

  • Select your preferred trading method: VT Markets offers indices CFDs, providing opportunities to profit from rising and falling prices. 
  • Choose between cash indices and index futures: Cash indices have tighter spreads and offer on-the-spot trade pricing, suitable for day traders. Index futures are preferred for longer-term views with fewer overnight funding charges. 
  • Create and log in to your trading account: Opening a live account [internal link: https://www.vtmarkets.com/get-trading/forex-trading-account/] with VT Markets is quick and easy. 
  • Choose the index to trade: Select from popular global indices [internal link: https://www.vtmarkets.com/trading/markets/indices/] based on available analysis and market insights. 
  • Decide to go long or short: Choose the direction based on the outlook for the economic sector or domestic market. 
  • Implement risk management strategies: Utilise stop-loss and limit orders to prevent excessive losses. 
  • Open your first position: Seize opportunities by monitoring and closing positions at the right time. 

In conclusion, trading stock indices offers a window into the performance of major companies and economies worldwide. Understanding the factors influencing index prices and utilising products like index CFDs can provide traders with both opportunities and risks. 

With proper research, risk management, and the support of a reliable broker like VT Markets, traders can confidently navigate the exciting world of index trading, diversify their portfolios, and hedge against market fluctuations. Happy trading! 

Summary: 
  • Stock indices represent the overall performance of top-performing shares from specific stock exchanges, providing a snapshot of the economy’s health. 
  • Indices can be calculated using market capitalisation-weighted or price-weighted averages, affecting their volatility and risk levels. 
  • Traders can’t directly buy or sell indices but can trade products like index funds, ETFs, futures, options, and CFDs, mirroring index performance. 
  • Several factors influence index prices, including economic news, global events, company financial results, announcements, and changes in index composition. 
  • Index CFDs are popular trading products that allow traders to profit from both rising and falling index prices with leverage. 
  • Proper research, risk management, and selecting the right trading strategy are crucial for successful index trading. 

Week Ahead: All Eyes on FOMC Meeting Minutes and ECB, BOJ Rate Decisions

The graph displays stocks with an uptrend represented in green, indicating bullish markets.

This week’s economic calendar includes important events that can significantly impact the markets: the FOMC Meeting Minutes, as well as the ECB and BOJ Rate Decisions. Traders should be well-prepared for potential market volatility resulting from these announcements and be ready to adjust their strategies accordingly.

Keep an eye on the following economic releases:

German, UK and US Flash Manufacturing PMI (24 July 2023)

Germany’s Manufacturing PMI experienced a downward revision in June 2023, reaching 40.6. In contrast, the UK’s PMI was revised upward to 46.5, while the US confirmed a PMI of 46.3, marking a six-month low. 

The figures for July 2023 will be released on 24 July. Analysts predict Manufacturing PMIs as follows: Germany at 40, the UK at 46, and the US at 46.

German, UK and US Flash Services PMI (24 July 2023)

US Services PMI was revised slightly higher to 54.4 in June 2023, while Germany’s was confirmed at 54.1, the lowest reading in three months. UK’s was confirmed at 53.7, the lowest in three months. 

Analysts predict Services PMIs for July 2023 as follows: Germany at 53.3, the UK at 53, and the US at 54.

Australia Consumer Price Index (26 July 2023) 

The annual inflation rate in Australia declined to 7% in Q1 2023, falling from an over-30-year high of 7.8% in the previous period. This marked the lowest recorded rate since Q2 2022. 

Looking ahead, analysts are forecasting a slower growth rate of 6.3% for the data covering the year up to June 2023. This information is scheduled for release on 26 July.

US FOMC Meeting Minutes (26 July 2023) 

The Fed decided to maintain its funds rate target at 5.25% in June 2023. Following the FOMC decision, the Fed Chair emphasised multiple times the necessity of raising rates further within the current year. 

For the upcoming meeting on 26 July, analysts forecast that the Fed will raise its interest rates to 5.5%.

European Central Bank Main Refinancing Rate (27 July 2023)

In its June meeting, the European Central Bank (ECB) raised its key interest rates by 25 bps to 4%. The ECB made it clear that future decisions would rely on incoming data and underscored its commitment to adopting a meeting-by-meeting approach in light of the uncertain economic environment, particularly as interest rates were nearing a potential peak level. 

For the upcoming 27 July meeting, analysts expect the central bank to implement another 25 bps increase to 4.25%.

US Advance GDP (27 July 2023)

The US economy expanded at an annualised rate of 2% on a quarter-on-quarter basis in Q1 2023. This growth was higher than the previous second estimate of 1.3%. 

The figures for Q2 2023 will be released on 27 July, with analysts projecting a slower growth rate of 1.9%. 

BOJ Rate Statement (28 July 2023) 

In its June meeting, the Bank of Japan decided to maintain its key short-term interest rate at -0.1% and kept the 10-year bond yields at 0%

For its upcoming meeting on 28 July, analysts anticipate the central bank to maintain the current interest rate levels.

Back To Top
server

您好 👋

我能帮您什么吗?

立即与我们的团队聊天

在线客服

通过以下方式开始对话...

  • Telegram
    hold 维护中
  • 即将推出...

您好 👋

我能帮您什么吗?

telegram

用手机扫描二维码即可开始与我们聊天,或 点击这里.

没有安装 Telegram 应用或桌面版?请使用 Web Telegram .

QR code