尊敬的用户:
您好!
受到 8 月国际节假日影响,VT Markets 部分产品交易时间将有所调整,详情请查看如下:
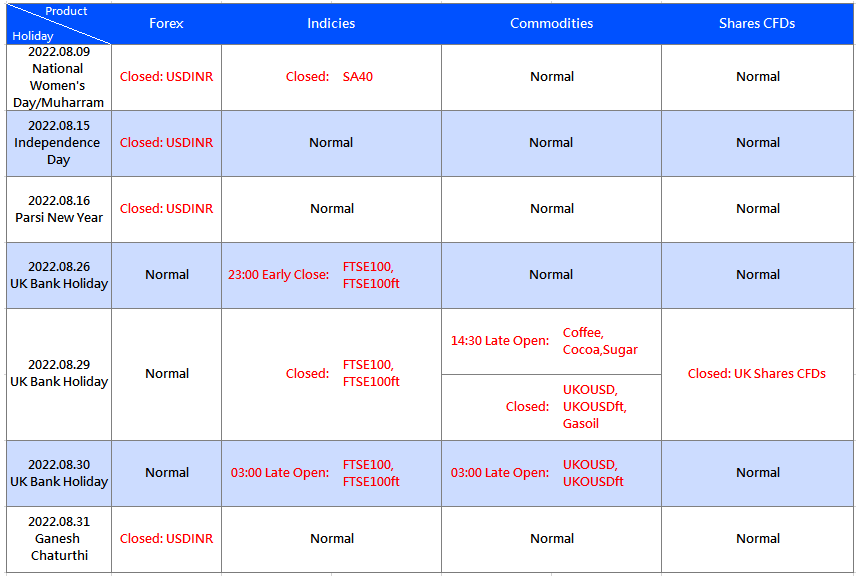
以上时间为MT4/5服务器时间,其他产品交易时间不受影响,在极少数情况下,以上信息可能会因流通性供应商的调整而变化,具体请以MT4/5实际交易时间为准。
如您有任何疑问,我们的团队将十分乐意为您解答。
请留言或发邮件至 [email protected] 或联系在线客服。
Back
尊敬的用户:
您好!
受到 8 月国际节假日影响,VT Markets 部分产品交易时间将有所调整,详情请查看如下:
以上时间为MT4/5服务器时间,其他产品交易时间不受影响,在极少数情况下,以上信息可能会因流通性供应商的调整而变化,具体请以MT4/5实际交易时间为准。
如您有任何疑问,我们的团队将十分乐意为您解答。
请留言或发邮件至 [email protected] 或联系在线客服。

US stock stopped a three-day rally on Monday as hawkish comments from Federal Reserve and data showing slower growth undermined market risk sentiment. Stocks had surged in July on speculation that rampaged inflation may have peaked and the central bank was closed to the end of the rate-hiking cycle on signs. While more than half of the S&P 500 firms’ earnings have exceeded analyst estimates so far, the rate of earnings is still under the 62% average pace set in the last five quarters. Moreover, Fed officials’ suggestion to the central bank pointed out that a more aggressive interest hike is necessary, which brings the market back to the dark from the sunlight in July.
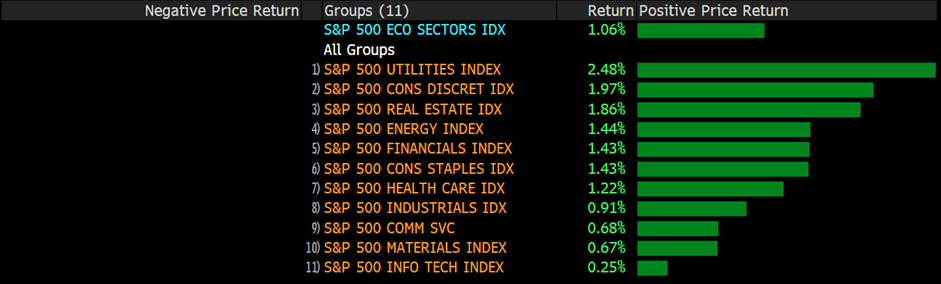
The benchmarks, S&P500 and Dow Jones Industrial Average both slid on Monday. S&P500 declined by 0.28% daily after reaching its best month since 2020. Seven of eleven sectors stayed in negative territory as Energy, Financial, and Real Estate performed worst among all groups, falling 2.18%, 0.89%, and 0.89% respectively, while it’s worth noting that outperforming sector CONS Staples rose 1.21%. The Nasdaq 100 was nearly not changed and the MSIC World index advanced with a
1.2% rally for the day.
Main Pairs Movement
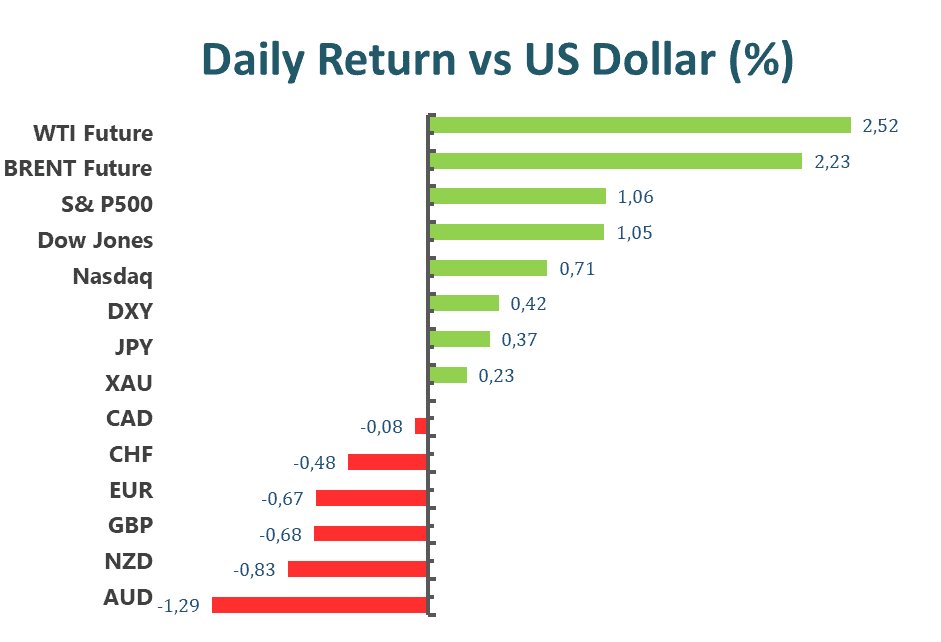
The US dollar declined on Monday, as investors weighed the possibility of the Federal Reserve will not raise interest rates as hawkish as a few months ago. Besides, the jobs data will be announced at the end of this week, which may be confirmed that the improvement in the labour market is a slowdown. The DXY index dropped with a 0.43% loss for the day. However, the greenback has been up roughly 10% for the year so far, triggered by Fed’s aggressive rate hike policy.
The GBP/USD advanced by 0.65% for the day, as the cables witnessed new transactions amid the US dollar under selling pressure caused by dialled-down Fed monetary policy. GBP/USD reached a daily high level above 1.229 in the middle of the US trading session. Meanwhile, EURUSD also touched its daily high level above 1.027 at the beginning of the US session. Nevertheless, the unchanged unemployment rate played a key stuck for European Central Bank(ECB) to push the interest rate hike policy.
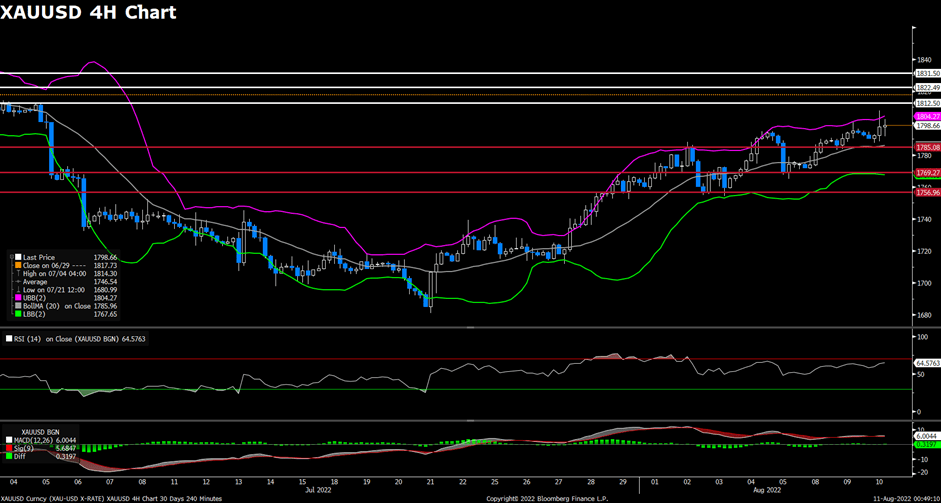
Gold rose 0.35% daily. Ahead of NFP and job data on Friday, XAUUSD witnessed fresh upside traction and touched a daily high above 1774$ mark. Meanwhile, WTI and BRENT dropped 3.79% and 4.80% respectively on Monday.
Technical Analysis
EURUSD (4-Hour Chart)
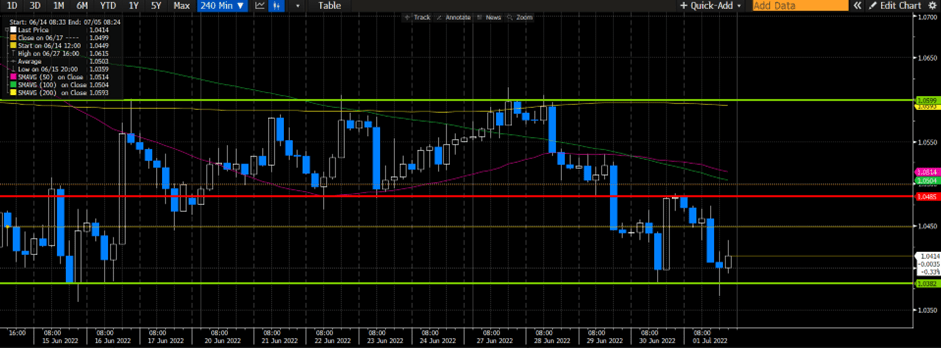
The EUR/USD pair advanced on Monday, regaining upside momentum and touched a daily high above near 1.027 level after the release of dismal US ISM Manufacturing PMI data. The pair is now trading at 1.0268, posting a 0.41% gain daily. EUR/USD stays in the positive territory amid a weaker US dollar across the board, as the risk-on market sentiment exerted bearish pressure on the greenback and helped the EUR/USD pair to find demand. The US ISM Manufacturing PMI declines to 52.8 in July, which was the lowest reading since June 2020 and showed slowing signs in business activity. For the Euro, investors continued to fuel their speculations of an impending recession in the Eurozone amid the downbeat German Retail Sales data, which plunged the most since 1994 and dropped 8.8% YoY in June.
For the technical aspect, the RSI indicator is 61 figures as of writing, suggesting that the upside is more favoured as the RSI stays above the mid-line. As for the Bollinger Bands, the price preserved its bullish momentum and continued to climb toward the upper band, therefore the upside traction should persist. In conclusion, we think the market will be slightly bullish as the pair tests the 1.0264 resistance line. A sustained strength above that resistance might open the road for additional gains.
Resistance: 1.0264, 1.0438, 1.0484
Support: 1.0177, 1.0153, 1.0111
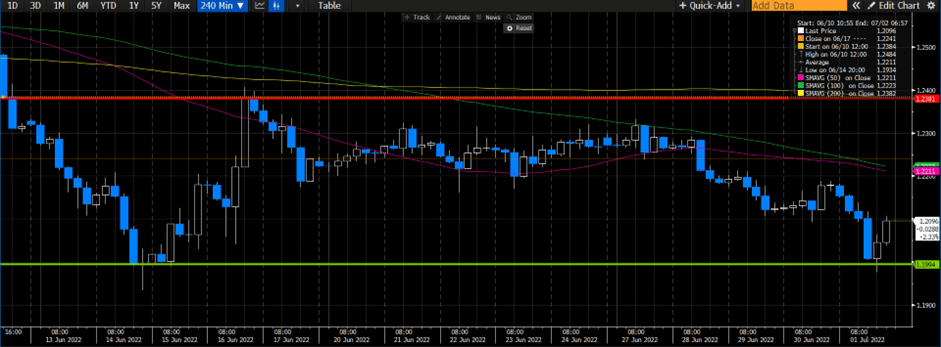
GBPUSD (4-Hour Chart)
The GBP/USD pair surged on Monday, jumping back above the 1.220 mark and kept refreshing its daily high during the US trading session amid renewed weakness in the US dollar. At the time of writing, the cable stays in positive territory with a 0.88% gain for the day. Investors continued to scale back their expectations for more aggressive rate hikes by the Federal Reserve amid the fear of recession, which acted as a headwind for the safe-haven greenback. Markets are now pricing in a 30% probability of a 75 bps Fed rate hike in September. For the British pound, despite the data from the UK showing that the S&P Global Manufacturing PMI fell to 52.1 in July, the cable remained underpinned by the rising bets for a 50 bps rate hike by the Bank of England.
For the technical aspect, the RSI indicator is 70 figures as of writing, suggesting that the pair is facing heavy upside pressure as the pair stays in the overbought zone. For the Bollinger Bands, the price moves out of the upper bands so a strong trend continuation can be expected. In conclusion, we think the market will be slightly bearish as long as the 1.2284 resistance line holds. The pair might witness some short-term technical corrections before climbing higher amid the overbought condition.
Resistance: 1.2284, 1.2317, 1.2381
Support: 1.2218, 1.2200, 1.2115
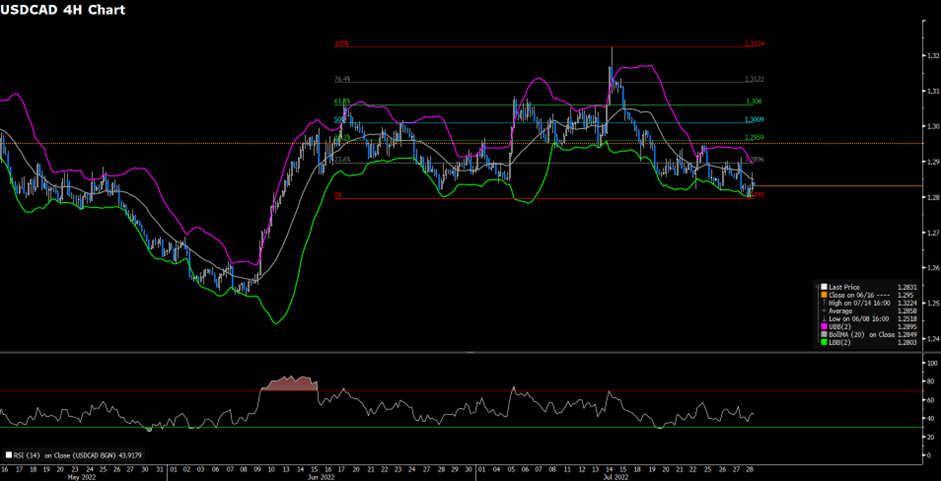
USDCAD (4-Hour Chart)
Despite the diminishing odds for more aggressive Fed rate hikes continuing to weigh on the US dollar, the pair USD/CAD gained positive traction and rebounded from seven-week lows toward 1.2835 during the US session. USD/CAD is trading at 1.2846 at the time of writing, rising 0.23% daily. Last week, the Fed hinted that it could slow the pace of the rate hike campaign at some point, which continued to undermine the safe-haven greenback. On top of that, the retreating crude oil prices have acted as a headwind for the commodity-linked loonie and pushed USD/CAD higher as WTI slides towards the $96 per barrel area. Oil prices remained under pressure amid a cautious mood ahead of this week’s OPEC meeting.
For the technical aspect, the RSI indicator is 50 figures as of writing, suggesting that there is no obvious direction for the pair now. For the Bollinger Bands, the price regained some bullish strength and crossed above the moving average, therefore the upside traction should persist. In conclusion, we think the market will be slightly bullish as the pair is heading to test the 1.2841 resistance. A break above that resistance could open the road for additional gains.
Resistance: 1.2841, 1.2891, 1.2944
Support: 1.2785, 1.2698
Economic Data
| Currency | Data | Time (GMT + 8) | Forecast |
| GBP | Composite PMI (Jul) | 16:30 | 52.8 |
| GBP | Services PMI (Jul) | 16:30 | 53.3 |
| USD | ISM Non-Manufacturing PMI (Jul) | 22:00 | 53.5 |
| USD | Crude Oil Inventories | 22:30 |


The US market is focusing on Non-Farm employment figures this week. The economy added 372,000 payrolls in June of 2022, which is higher than the market forecast of 268,000. Meanwhile, the July projection is at 255,000 additional jobs.
US unemployment rate remains the same in June 2022 at 3.6%, which is similar to the previous months and remains the lowest since February. Market projections are still at 3.6%.
Investors are also keenly anticipating the interest rate decisions of two major central banks: the Bank of England (BoE) and the Reserve Bank of Australia (RBA).
The Bank of England announced its fifth consecutive interest rate hike in June 2022, with a primary bank rate of 25bps to 1.25%, the largest in 13 years to battle inflation. BoE is committed to decreasing inflation to 2%.
BoE also anticipates an inflation rate of above 9% in the following months and above 11% in October. Meanwhile, the Gross Domestic Product (GDP) growth is expected to go down in the first half of the forecast year, which may lead to a 25bps hike in August.
The Reserve Bank of Australia increased its cash rate by 50 bps to 1.35% in July, following the 50bps hike in June and 25bps hike in May. According to the board, there is no need for massive monetary support given the economy’s strength and price pressures. In addition, they are committed to strengthening the amount and timing guided by incoming data. Market analysts forecast a 50bps hike in August.

Lead by big tech, US stock advanced on Friday and notched the best month since 2020. Amazon.com Inc. and Apple Inc. soared as higher revenues from the pair’s iconic powerhouses relieved fears of profit slowdown on profit growth. Despite some concerning indications from economic indicators, the earnings season as a whole has outperformed expectations, with over 75% of S&P500 corporations reporting results that exceeded analyst expectations. Investors cannot resist but predict that Corporate America will be able to weather the storm of inflation, massive rate hikes, and slowing economic growth.
However, two key US price indexes reported higher than forecast, especially the personal consumption expenditures index, which Federal Reserve highly focused on, climbing at the fastest pace since 2005. Overall, the rebound of stocks this month has not yet convinced investors that a new bull market has begun.
Due to a stronger-than-expected earnings season, the S&P500 and the Dow Jones Industrial Average rose on Friday. The S&P500 increased 1.42% daily, while the Dow Jones Industrial Average rose 1% daily. Energy and Consumers Discretion have the best performance of all sectors, increasing by 4.51% and 4.27%, respectively. Meanwhile, the Nasdaq 100 increased by 1.8% on Friday, while the MSCI World index increased by 1.2%.
Main Pairs Movement
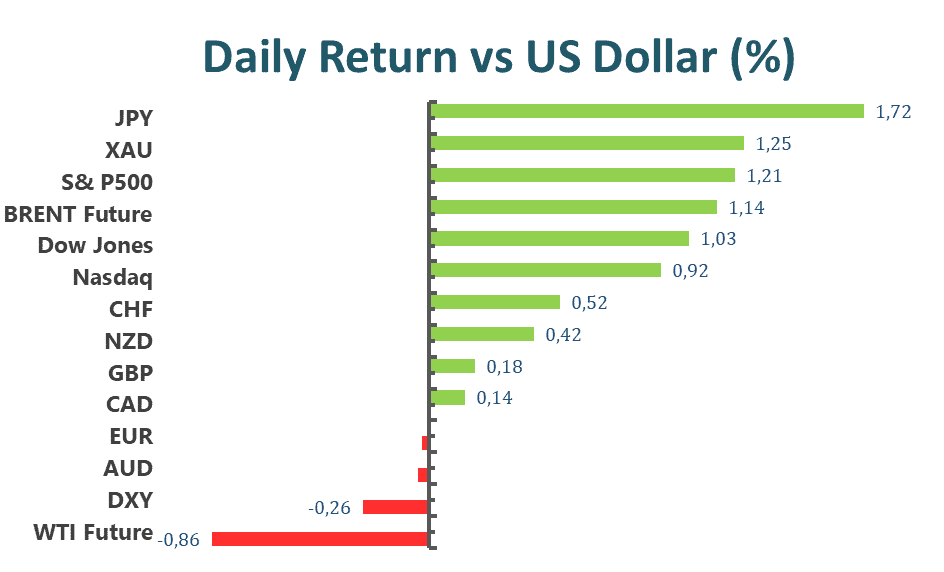
On Friday, the US dollar fell to a three-week low below 105.6 as speculation swirled over a possible recession in the wake of conflicting economic data. The DXY index maintained its bearish trend and dropped to a three-week low during the first half of the trading day, before rebounding to a daily high over 106.6 during the middle of the European trading session. Inflation in the United States remained inexorable in June, according to the US price index, and an increase in interest rates is not inconceivable.
The GBPUSD was steady on Friday, losing 0.07%. The cables witnessed some new transactions and reached a daily high level above 1.224 during the Asia trading session amid a weak US dollar across the board. However, the cables fell to a daily low level below 1.207 following the release of a strong US Personal Consumption Expenditures report ahead of the New York trading session. During the middle of the Asia session, EURUSD reached a daily high above 1.025 before falling to a low below 1.015. The pair increased by 0.23% on the day.
Gold climbed 0.58% daily and is now firmly established at over $1760 as US yields erase prior gains and inflation fears. In the meantime, WTI crude oil gained bullish momentum throughout the late Asian session and surpassed $99 per barrel on Friday.
Technical Analysis
XAUUSD(4-Hour Chart)
Gold gathers bullish move following a dip earlier in the session as the US yields turn south. From the technical perspective, gold continues to build its upside momentum beyond the 1746 support zone and gains positive traction for the third consecutive day on Friday at the time of writing. The four-hour outlook is bullish as gold remains way above the ascending trend line. Despite the RSI indicator having reached beyond the overbought territory, the positive MACD seems to continue to support the bulls. As long as gold sustains its momentum above the trend line, its positive outlook remains unchanged. To the upside, the breakout of the immediate hurdle of 1766 would give gold another rally.
Resistance: 1766, 1786, 1811
Support: 1746, 1721, 1680
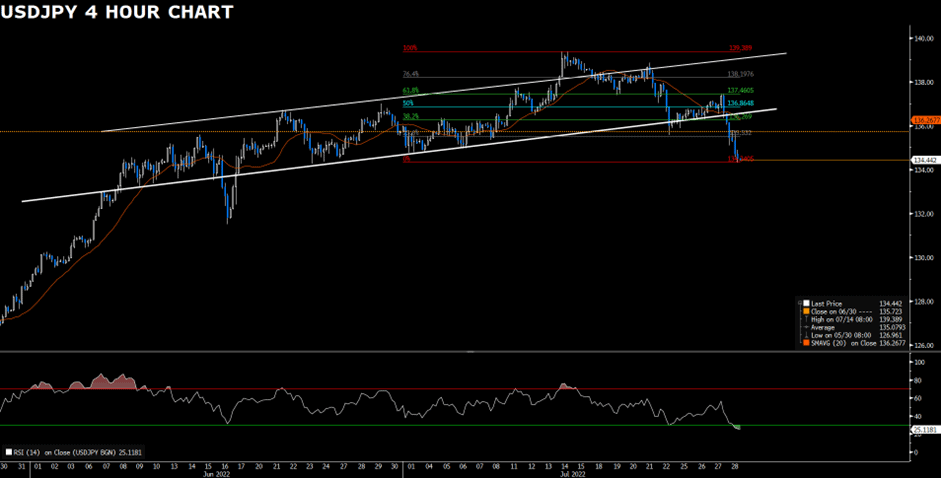
USDJPY (4-Hour Chart)
USDJPY plunges badly to near 133.00 as the US dollar confronts selling pressure following the fading aggressive Fed tightening expectations. From the technical perspective, it is now seen as in correction to the four-hour outlook up trend. Since USDJPY has officially broken the bullish channel, the bias becomes a downside. Strong support is expected to see at 132.50 for the rebound. A breakout of the support level of 132.50 would accelerate the downside, heading further south. For now, for the bull to reclaim its position, USDJPY needs to at least rise above 135.94.
Resistance: 134.13, 135.13, 135.94
Support: 132.50
EURUSD (4-Hour Chart)
EURUSD edges higher near 1.0200 as the US dollar loses traction. From the technical aspect, the euro dollar starts a fresh recovery against the dollar after hitting the midline of the Bollinger band and the 20 Simple Moving Average. EURUSD looks to oscillate in the range of 1.0109- 1.0284 on the four-hour chart. The outlook of EURUSD is currently neutral as the RSI indicator hovers around the midline and the MACD remains neutral. On the upside, the resistance of 1.0284 would be the first major hurdle to break to begin the bullish move of the euro dollar. On the contrary, if EURUSD falls below 1.0109, the pair might decline towards the 0.9952 level.
Resistance: 1.0284, 1.0362, 1.0459
Support: 1.0109, 0.9952
Economic Data
| Currency | Data | Time (GMT + 8) | Forecast |
| CNY | Caixin Manufacturing PMI (Jul) | 09:45 | 51.5 |
| EUR | German Manufacturing PMI (Jul) | 15:55 | 49.2 |
| GBP | Manufacturing PMI (Jul) | 16:30 | 52.2 |
| USD | ISM Manufacturing PMI (Jul) | 22:00 | 52.0 |
US stock rallied on Thursday, preserving its bullish momentum and climbing to a seven-week high as investors pared their bets on Fed’s aggressively rate hikes amid the weak economic data. The US Gross Domestic Product (GDP) in Q2 showed that the economy entered a technical recession after contracting by 0.9%. However, investors remained their speculation that the Federal Reserve could reduce the pace of monetary tightening despite the data showing that the economy is losing momentum.
Fed chairman Jerome Powell also said on Wednesday that rate hikes would slow at one point and he shed quite some light on the future of monetary policy. Inflation measures will likely fall amid the slowing economy, which might bring the end of the tightening cycle nearer. In the Eurozone, Germany’s inflation data flashed mixed signals as the Consumer Price Index (CPI) dropped to 7.5% YoY but the Harmonised Index of Consumer Prices (HICP) climbed to 8.5% yearly.

The benchmarks, S&P 500 and Dow Jones Industrial Average both advanced on Thursday as the dismal economic data eased the expectation for aggressively rate hikes by the Fed. The S&P 500 was up 1.2% on a daily basis and the Dow Jones Industrial Average also advanced with a 1.0% gain for the day. Ten out of eleven sectors stayed in positive territory as the Real Estate and the Utilities sectors are the best performing among all groups, rising 3.70% and 3.53%, respectively. The Nasdaq 100 meanwhile climbed the least with a 0.9% gain on Thursday and the MSCI World index rose 1.3% for the day.
Main Pairs Movement
The US dollar declined on Thursday, remaining under selling pressure and retreated toward the 106.1 level as the safe-haven assets performed better against the greenback yesterday. The DXY witnessed some buying and touched a daily top near the 107 mark during the European session, but then failed to preserve its upside traction meanwhile surrendered most of its daily gains. The market’s expectations of no more aggressive rate hikes from the Fed and the release of weaker US Q2 Gross Domestic Product data both exerted bearish pressure on the US dollar.
GBP/USD edged higher with a 0.18% gain on Thursday amid a weaker US dollar across the board. However, the political jitters in the UK and Brexit woes might limit the upside for the cable. The GBP/USD pair dropped to a daily low below 1.211 level in the late European session, then regained upside traction to recover most of its daily losses. Meanwhile, EUR/USD failed to overcome recent losses and remained under bearish pressure after dropping to a daily low below 1.012 level in the European session. The pair was up almost 0.05% for the day.
Gold surged with a 1.25% gain for the day after refreshing its daily high above the $1756 mark in the late US trading session, as the slowing economy and the renewed weakness in the greenback both lend strong support to the precious metal. Meanwhile, WTI oil failed to preserve its upside traction and retreated to the $97 area on Thursday.
Technical Analysis
XAUUSD(4-Hour Chart)

The metal, XAUUSD, gathers bullish momentum for the second day after the US data showed that the economy contracted in the second quarter, thus boosting XAUUSD. From the technical perspective, XAUUSD builds on the overnight upside rebound above the resistance of 1748. The upward breakout gained some follow-through traction on Thursday. The four-hour outlook turns bullish as XAUUSD lands within the upper bounce of the Bollinger band and the RSI indicator hovers within the positive territory. XAUUSD might consolidate slightly above and below 1748 as the RSI has reached the overbought condition. Stably sustaining above the level would support XAUUSD’s upside.
Resistance: 1769, 1790, 1815
Support: 1748, 1722, 1680
USDJPY (4-Hour Chart)
USDJPY falls sharply following the less hawkish Fed. From the technical perspective, USDJPY surrenders after failing to defend the crucial support level of 136.26 in the early Asian session. The intraday decline has pushed USDJPY towards the 0% Fib. Retracement of 134.34. The outlook of USDJPY becomes bearish as the pair officially trades below the bullish channel. In order to reclaim its upside stance, USDJPY needs to at least climb above 136.26. On the contrary, the breakout of the immediate support of 134.34 would confirm another downside momentum toward 131.00.
Resistance: 134.75, 136.52, 137.06, 137.61
Support: 134.34
USDCAD (4-Hour Chart)
USDCAD makes a meaningful recovery after hitting the support level of 1.2795. The outlook of USDCAD remains bearish as the pair continues to trade below the descending trend line. In the meantime, the RSI stays in the negative territory, suggesting that buyers are on the sideline. Failure to defend the immediate level of 1.2795 would accelerate the downside. On the flip side, USDCAD needs to trade above the immediate hurdle of 1.2896 in order to claim its bullish stance.
Resistance: 1.2896, 1.2959, 1.3009
Support: 1.2795
Economic Data
| Currency | Data | Time (GMT + 8) | Forecast |
| EUR | German Unemployment Change (Jul) | 15:55 | 15K |
| EUR | German GDP (QoQ) (Q2) | 16:00 | 0.1% |
| EUR | CPI (YoY) (Jul) | 17:00 | 8.6% |
| USD | Core PCE Price Index (MoM) (Jun) | 20:30 | 0.5% |
| CAD | GDP (MoM) (May) | 20:30 | -0.2% |
In response to Fed chairman Jerome Powell’s less hawkish remarks after the central bank’s monetary policy decision, US stocks jumped on Wednesday, regaining upside momentum and making a significant return. Wednesday, the US Federal Reserve stated that it had increased the main benchmark rate by 75 basis points to a range of 2.25 to 2.5%, which was in line with market expectations and imposed significant downward pressure on the US currency.
In the news conference, Powell also refuted the notion that the United States is in a recession, stating that the Federal Reserve is moving swiftly to combat inflation. The market’s fears of a recession have been allayed by the comments, which have worked as a tailwind for the equities markets. Fears of an energy crisis have increased in the Eurozone as a result of the German gas regulator’s statement that energy costs could increase considerably owing to the shutdown of the main Russian gas pipeline.

On Wednesday, both the S&P 500 and the Dow Jones Industrial Average climbed, as about 85% of S&P 500 companies rose and the Nasdaq 100 experienced its greatest one-day surge since November 2020. The S&P 500 increased by 2.6% on a daily basis, while the Dow Jones Industrial Average rose by 1.4%. The Communication Services and Information Technology sectors performed the best among all categories, growing 5.11% and 4.29%, respectively. All eleven sectors remained in positive territory. The Nasdaq 100 gained the most on Wednesday with a 4.3% increase, while the MSCI World index advanced 1.9% for the day.

Main Pairs Movement
Following the Federal Reserve’s rate decision, the dollar declined. As anticipated, the central bank upped the benchmark rate. Following the FOMC Press Conference, DXY dropped below 106.4. In addition to the Fed’s monetary policy decision, the market responded to chairman Jerome Powell’s comments in which he stated that he did not foresee a recession and sought to allay congress’ recession fears. Thursday’s announcement of the US’s GDP estimate for the second quarter will also be closely monitored by investors.
Wednesday saw a 1.08% increase in GBP/USD due to a lower US currency. Investors interpreted the Federal Reserve’s consecutive 75 basis point rate hikes and admission that production and spending slowed as “dovish.” After the FOMC meeting, the pound exceeds 1,218. EUR/USD surpassed 1.022 as well. Despite the intensifying oil crisis, cable grew 0.82%.
As a result of the Fed’s restrained comments on Wednesday, gold reached a day high above $1740. WTI recovered positive momentum and surpassed $97.6 per barrel.
Technical Analysis
XAUUSD(4-Hour Chart)

Gold climbs above 1720 with an initial reaction to the US Fed, whose decision to raise the interest rates by 75 basis points as expected. Technically speaking, gold still trades in the tight range above and below 1722. In the meantime, gold remains on the midline of the Bollinger band, showing its directionlessness; however, the RSI indicator at the moment skews to the upside, suggesting that the near-term outlook turns bullish. On the downside, if gold falls below 1722, then its momentum would turn bearish as it would trade within the lower bounce of the Bollinger band.
Resistance: 1722, 1748, 1769
Support: 1680.99
USDJPY (4-Hour Chart)

USDJPY loses traction as the Fed signals that it could slow the pace of rate hikes, causing the greenback to lose interest. From the technical perspective, despite the downward price action, USDJPY remains bullish as it stays within the ascending channel as well as the 20 Simple Moving Average. As long as USDJPY can stay above 136.52 and the bullish channel, then the outlook of the pair remains upside. On the flip side, a breakout of 136.52 would imply that the bearish momentum is in charge, attracting some follow-through sellers. The RSI indicator has skewed to the south, signalling that the breakout is possible.
Resistance: 136.52, 137.06, 137.61
Support: 136.84, 134.75
EURUSD (4-Hour Chart)

EURUSD loses traction in the second half of the day on Wednesday as the greenback recovers ahead of the FOMC meeting. From the technical perspective, EURUSD currently trades slightly above the support of 1.0109. The pair has oscillated in the range of 1.0109- 1.0284 since mid-July. Whether EURUSD can hold above the support level would be a turning point to determine the momentum of the pair. If EURUSD falls below the support, then it will attract some follow-through sellers, causing the pair toward further south. The RSI indicator continues to trade within the negative territory, implying that buyers are still on the sideline.
Resistance: 1.0205, 1.0284, 1.0362
Support: 1.0109, 0.9952
Economic Data
| Currency | Data | Time (GMT + 8) | Forecast |
| USD | FOMC Statement | 02:00 | N/A |
| USD | Fed Interest Rate Decision | 02:00 | 2.50% |
| USD | FOMC Press Conference | 02:30 | N/A |
| AUD | Retail Sales (MoM) (Jun) | 09:30 | 0.5% |
| USD | GDP (QoQ) (Q2) | 20:30 | 0.5% |
| USD | Initial Jobless Claims | 20:30 | 253K |

Tuesday’s decline in US stocks was precipitated by deteriorating economic conditions, worries of a recession, and sky-high inflation. The dismal outlook of the world’s largest retailer, Walmart Inc., illustrates the effects of inflationary pressures on consumer spending. Concerns over a faltering global economy prompted investors to anticipate another 75-basis-point increase before to a widely anticipated Federal Reserve interest rate hike, with the total 150-bps interest rate spike in June and July reaching the highest level since the early 1980s.
Alphabet Inc., the parent company of Google, and Texas Instruments Inc. rose after earnings, but Microsoft fell due to its slowest revenue growth since 2020. In addition, the sales of McDonald’s Corp. and Coca-Cola Co. exceed expectations, and Coinbase Global Inc. is under investigation in the United States for allegedly allowing Americans to trade digital assets that should have been registered as securities, according to three individuals familiar with the situation.

The S&P 500 and Dow Jones Industrial Average both dipped on Tuesday as a result of the Fed’s threat to raise interest rates on Wednesday, recession fears, and disappointing earnings reports. The S&P 500 plummeted 1.19% daily, while the Dow Jones Industrial Average declined 0.7%. Eight of eleven sectors remained in the red, with Consumer Discretion and Communication Services having the worst performance of all categories, falling 3.38% and 2.20%, respectively. In the meantime, the Nasdaq 100 sank 2% on Tuesday, while the MSCI world index declined 0.9%.

Main Pairs Movement
As yesterday’s financial markets were dominated by aversion to risk, the US dollar rose on Tuesday, surrounded by bullish momentum, and approached the 107.30 level. During the first part of the trading day, the DXY index fluctuated in a range between 106.2 and 106.5. It then began to experience considerable purchasing pressure and reached a day high of over 107.2 during the US trading session. Escalating fears of economic slowdown in the Eurozone and the Russia-related energy crisis continued to boost demand for the safe-haven dollar, as the Russian gas giant Gazprom is supplying roughly 20% of its normal natural gas supply. The market’s attention will now move to the Fed’s monetary policy statements.
The GBP/USD exchange rate declined by 0.12% on Tuesday as the US dollar strengthened across the board. Investors continue to be anxious about the possibility of a worldwide recession, which has eclipsed the likelihood of a 50 basis point (bps) rate hike by the Bank of England in August. In the late European session, the GBP/USD pair plummeted to a daily low below the 1.197 level before regaining upward momentum to recover the majority of its daily losses. In the meantime, EUR/USD sustained significant losses yesterday and retested its daily low near 1.010 throughout the US trading session. EU nations also agreed to limit gas consumption during the upcoming winter. The pair fell over 1% for the day.
As investors await additional direction from the Federal Reserve’s monetary policy meeting, gold was little changed with a 0.10% loss for the day after moving sideways in a narrow range below $1719 in the late US trading session. The White House stated on Tuesday that it would sell 20 million barrels from the Strategic Petroleum Reserve, causing WTI oil prices to drop to around $95 per barrel.
Technical Analysis
XAUUSD(4-Hour Chart)

Gold does a little technical progress, consolidating around 1722.66 on Tuesday. From the technical perspective, the four-hour outlook is neutral-to-bearish. Gold has fallen below the midline of the Bollinger Band and the 20 Simple Moving Average, suggesting that bears are in the driver’s seat. Failure to maintain above the resistance level of 1722.66 would bring the pair toward the next support of 1680.99. On the flip side, if gold can move upward above the midline, then the bullish momentum might be able to gain traction on the four-hour chart. The RSI indicator still trades around the midline, reflecting the absence of directional strength. Further price action eyes on the FOMC meeting.
Resistance: 1722, 1748, 1769
Support: 1680.99
USDJPY (4-Hour Chart)

USDJPY surpasses 136.00 as the US dollar regains positive traction on Tuesday ahead of the FOMC meeting. Technically speaking, USDJPY performs a meaningful rebound after hitting the lower band of the ascending channel. USDJPY has breached the psychological resistance of 136.00, suggesting that USDJPY resumes its bid mood. USDJPY attracts some buyers near 136.00, thus the RSI indicator has a skewed upside. The pair is expected to move further north as the RSI has way far from overbought, implying that there are rooms for the pair to ascend. On the flip side, if the pair falls below the bullish channel, then it will lose some positive momentum in the near- term
Resistance: 136.62, 137.06, 137.61
Support: 136.84, 134.75
EURUSD (4-Hour Chart)

EURUSD tumbles towards 1.0100 amid the European gas crisis and fears of a global recession. From the technical perspective, EURUSD is trading at its lowest in a week near the support level of 1.0109. The outlook of the currency pair turns downside as the bearish double-top trading pattern has been formed. In the meantime, the four-hour chart favours a downside extension as EURUSD has breached below the 20 Simple Moving Average. Failure to maintain above 1.0109 would confirm another downside momentum. Moreover, technical indicators, both the RSI and the MACD gain downward traction, trading within the negative regions.
Resistance: 1.0205, 1.0284, 1.0362
Support: 1.0109, 0.9952
Economic Data
| Currency | Data | Time (GMT + 8) | Forecast |
| AUD | CPI (QoQ) (Q2) | 09:30 | 1.9% |
| USD | Core Durable Goods Orders (MoM) (Jun) | 20:30 | 0.25 |
| USD | Pending Home Sales (MoM) (Jun) | 22:00 | -1.5% |
| USD | Crude Oil Inventories | 22:30 | -1.121M |

Amidst the lowest intraday volatility and volume of the year and ahead of this week’s crucial Fed meeting, US stocks inched up on Monday amid a turbulent session. Large technology firms remained under bearish pressure as investors anticipate negative earnings report news. Despite recession fears, investors are awaiting the conclusion of Wednesday’s critical FOMC monetary policy meeting, which is likely to raise interest rates by 75 basis points. However, investors’ scepticism that the Federal Reserve can control inflation without triggering a recession could continue to dampen market sentiment. In the Eurozone, the German Ifo Business Climate Index sank to a two-year low of 88.6 in July, which was worse than expected and reflected the concern of a gas crisis among German businesses.

Monday was a positive day for the S&P 500 and Dow Jones Industrial Average as investors awaited earnings announcements from technology giants amid warnings from a hawkish Federal Reserve. The S&P 500 increased by 0.1% daily, while the Dow Jones Industrial Average increased by 0.3%. The Energy and Utilities sectors performed the best among all categories, advancing 3.71 % and 1.26%, respectively. Eight of eleven sectors remained in positive territory. The Nasdaq 100 fell the most on Monday with a loss of 0.5%, while the MSCI World index remained relatively unchanged.

Main Pairs Movement
On Monday, the US dollar fell below the 106.30 level, since it is largely anticipated that the Federal Reserve will hike interest rates by 75 basis points following its meeting on Wednesday. The DXY index fell the most on Monday, reaching a daily low of 106.2, before rebounding to surpass 106.6 during the US session. In addition to rate hikes, structural characteristics of the U.S. economy, particularly improved energy resilience, have propelled the dollar to multi-year highs.
GBP/USD increased by 0.37% on Monday, despite the US dollar’s weakness and the unpredictability of UK politics. At the start of the week, the cable pairs plummeted to a daily low of roughly 1.196, before gaining bullish momentum to surpass 1.208 during the late Asia session. Similarly, EUR/USD fell to a level of 1.018 at the start of yesterday and then rallied to a day high at 1.026. The pairings remain flat for the day as traders anticipate fresh hints, the US CB consumer confidence report for July and the FOMC meeting on Wednesday.
Gold began the week with a 0.46% loss, falling under intense selling pressure in late Asia and at the start of the US trading session when XAUUSD hit a daily low below the $1715 level. Awaiting the Fed’s interest rate policy decision, the price trend has now shifted to neutral. On Monday, WTI oil prices increased by 2.11% and reached almost $96.
Technical Analysis
XAUUSD(4-Hour Chart)

Gold initially attempted to rally early Monday, but turned around to show signs of weakness. Gold hovers around the $1,715 region during the American trading session. From the technical perspective, the intraday decline brings gold below the resistance of $1,722; the four-hour outlook turns downside following the trading pattern of the double-bottom formation. The RSI indicator has turned southward, suggesting that buyers are on the sideline and sellers are back in the market. If gold breaks below the midline of the Bollinger band, gold is likely to see further downward pressure and an acceleration of the downside. In order to regain positive traction, gold needs to climb above $1,722.
Resistance: 1722, 1748, 1769
Support: 1680.99
USDJPY (4-Hour Chart)

USDJPY turns upside as the US dollar rallied a bit during the trading session. From the technical aspect, the overall outlook of USDJPY is back to bullish after the pair trades within the ascending channel. The recovery frankly suggests that the corrective phase comes to an end. The acceptance above 136.52 would confirm the bullish stance of the pair. The upside is also supported by the RSI indicator, which turns upward, attracting some follow-through buyers back into the market. On the contrary, failure to stand above 136.52 and trade within the ascending channel would make the currency pair back in a bearish mood.
Resistance: 136.52, 137.06, 137.61
Support: 136.84, 134.75
EURUSD (4-Hour Chart)

EURUSD has gone back and forth during the course of sessions on Monday as markets continue to carefully monitor ahead of the FOMC meeting. Technically speaking, EURUSD shows that it keeps struggling to overcome the 20 SMA. The near-term outlook of EURUSD is neutral-to-bullish as the RSI slightly skews to the north while the MACD indicator tends to be bullish. The upside momentum remains limited if the pair cannot overcome the resistance of 1.0284, breaching the consolidation. On the flip side, if the EURUSD declines below the current support of 1.0205, then the outlook would turn bearish on the four-hour chart. Further price movement eyes on the FOMC meeting later this week.
Resistance: 1.0284, 1.0362
Support: 1.0284, 1.0109, 0.9952
Economic Data
| Currency | Data | Time (GMT + 8) | Forecast |
| USD | CB Consumer Confidence (Jul) | 22:00 | 97.2 |
| USD | New Home Sales (Jun) | 22:00 | 660K |

All eyes will be on the US Federal Open Market Committee (FOMC) meeting this week for insights into upcoming interest rates hikes after annual inflation hit a 4-decade high of 9.1% in June.
US policymakers are anticipating continued price surges and are backing a 50-75 basis points hike. Officials say the economic outlook warrants moving to a restrictive policy stance, and warned that tighter measures will be imposed if inflation pressures persist.
Advance Gross Domestic Product (GDP) releasing Thursday is expected to edge up 0.8-0.9% in the second quarter. This positive outlook follows a fall of 1.6% in Q1, the first contraction since the pandemic-induced recession in 2020, weighed down by record trade deficits, supply constraints, worker shortages, and high inflation.
US Core Personal Consumption Expenditure (PCE) for June will also be announced this week, predicted at a 0.9% rise.
Australia is expecting yet another bump in its quarterly Consumer Price Index (CPI) figures on the backs of soaring fuel prices and surging building costs. Annual inflation rate saw a 5.1% spike in the first quarter, marking its highest reading since the introduction of the Goods and Services Tax in the early 2000s.
Due to dismal results from social-media companies and weak economic data, US stocks dropped on Friday, failing to maintain the upward momentum and ending a three-day rise. Snap Inc.’s disappointing performance and Twitter Inc.’s weaker-than-anticipated sales figure have heightened concerns about online ad spending, which is also one of the mounting indications that technology businesses are preparing for a recession.
The Fed meeting this week will be the primary focus for investors, as market sentiment remains fragile in the face of higher inflation, rapidly rising interest rates, and fears of a recession, despite market participants’ expectations that the Fed will take a more measured approach to tighten monetary policy. In the Eurozone, economic activity in Germany’s private sector decreased in early July, according to statistics released on Friday, while the eurozone’s manufacturing PMI went below 50 for the first time in more than two years. The economy of the eurozone is likely to fall in the third quarter, as corporate activity has begun to decline.

Both the S&P 500 and Dow Jones Industrial Average sank on Friday, with the S&P 500 falling for the first time in four days due to recession fears and disappointing tech company reports. The S&P 500 decreased by 0.9% on a daily basis, while the Dow Jones Industrial Average decreased by 0.4%. Eight of eleven sectors remained in negative territory, with the Communication Services and Information Technology sectors losing 4.34 % and 1.38 %, respectively, as the poorest performers. The Nasdaq 100 dropped the most on Friday, falling 1.8%, while the MSCI World index dropped 0.5%.

Main Pairs Movement
The US dollar was little changed on Friday, as it faced additional selling pressure and failed to rise above the 107.3 mark in response to data indicating a decline in early July private sector business activity. After the release of the German Manufacturing PMI, the DXY index inched upward and reached a daily high, but then began to experience fresh selling to extend its daily losses below the 106.2 mark. In July, the US S&P Services PMI fell to 47, which was well below the market’s forecast of 52.6 and indicated a worrying downturn in the economy.
The GBP/USD currency rate increased by 0.16 % on Friday after renewed dollar weakness. In terms of economic data, UK Retail Sales decreased by 5.8 % year-over-year in June, but better-than-expected UK PMIs have relieved some pressure on the Bank of England (BoE). At the start of the European session, the GBP/USD pair plummeted to a daily low below the 1.193 level before regaining upward momentum to recoup all of its daily losses. During the initial half of the day, EUR/USD was surrounded by bearish momentum and weighed down by dismal German PMI data. The pair declined by over 0.15 % for the day.
Gold climbed 0.55 % on the day after reaching a daily high above $1738 in the early US trading session, as the precious metal attracted new buyers in response to a strong decline in US government yields. Meanwhile, WTI oil maintained its downward momentum and fell to around $95 per barrel on Friday, as the reopening of the Nord Stream 1 gas pipeline weighed on oil prices.
Technical Analysis
XAUUSD(4-Hour Chart)

Gold surpasses $1,725 at the time of this Friday’s writing. As a result of the poor PMI data, the benchmark 10-year US Treasury bond yield falls by more than 4% every day, reducing the demand for the US dollar. After reaching the crucial support level of $1,680, gold performs a good technical recovery. Due to the fact that the RSI has not yet reached overbought territory and the MACD is continuing to provide support, gold may be able to overcome the $1,732 resistance level. The acceptance of the midpoint of the Bollinger band would protect the bulls of gold.
Resistance: 1732.58, 1756.40, 1779.70
Support: 1680.99
USDJPY (4-Hour Chart)

Following the release of US economic statistics, USDJPY was able to fall below 136,000 during the American session. The USDJPY reached its lowest level in two weeks. The intraday bias is now bearish from a technical standpoint, as the pair has breached the bullish channel. The pair is about to produce a four-hour closing price below the channel and the 136.28 resistance level. Immediate support is located at 135.67, followed by the zone at 134.52. To erase the negative tone, the U.S. dollar must climb back above 136.28.
Resistance: 136.28, 136.95, 137.53
Support: 135.67, 134.52
EURUSD (4-Hour Chart)

After US statistics, the EURUSD has extended its rebound during the American trading day. From a technical standpoint, EURUSD recovers after reaching the lower Bollinger Band band and the 20 Simple Moving Average. The bulls had pushed EURUSD over 1.0205 resistance at the time of writing, indicating a positive change on the four-hour chart. If EURUSD is able to sustain its upward momentum into the next barrier around 1.0284, the probable double-bottom formation will indicate a bullish bias for the pair. Currently, the RSI indicator is trading within the positive region, which supports the upside. Contrariwise, an intraday closing below 1.0205 could pave the way for a decline towards parity. Next week’s FOMC meeting will likely influence future price movements.
Resistance: 1.0284, 1.0362, 1.0459
Support: 1.0205, 1.0109
Economic Data
| Currency | Data | Time (GMT + 8) | Forecast |
| EUR | German Ifo Business Climate Index (Jul) | 16:00 | 90.2 |


